

Abstract
The activation and expansion of brown adipose tissue (BAT) has emerged as a promising strategy to counter obesity and the metabolic syndrome by increasing energy expenditure. The subsequent testing and validation of novel agents that augment BAT necessitates accurate pre-clinical measurements in rodents regarding the capacity for BAT-derived thermogenesis. We present a novel method to measure BAT thermogenesis using infrared imaging following β3-adrenoreceptor stimulation in mice. We show that the increased body surface temperature observed using this method is due solely to uncoupling protein-1 (UCP1)-mediated thermogenesis and that this technique is able to discern differences in BAT activity in mice acclimated to 23 °C or thermoneutrality (30 °C). These findings represent the first standardized method utilizing infrared imaging to specifically detect UCP1 activity in vivo.
Keywords: Brown adipose tissue, Brown fat, BAT, Uncoupling protein-1, Obesity, Diabetes, Metabolism, Thermography, Beige fat, Brite fat
Abbreviations: FDG-PET, fluorodeoxyglucose positron emission tomography; CT, computed tomography; fMRI, functional magnetic resonance imaging; MRS, magnetic resonance spectroscopy
1. Introduction
Brown adipose tissue (BAT) has received renewed interest for its potential to reduce adiposity and improve metabolic health [1]. While BAT was traditionally considered to be lost after infancy, recent evidence supports the presence of functional BAT in adult humans [2–4]. BAT is unique in its expression of uncoupling protein-1 (UCP1), which is activated by cold and β-adrenergic signaling as a means to maintain core body temperature in cold environments [5]. When activated, UCP1 facilitates proton leak across the mitochondrial inner membrane to dissociate oxygen uptake from ATP synthesis and generates large amounts of heat. To this end, numerous regulatory, transcriptional and endocrine factors are being investigated and developed to augment BAT mass and/or activity in order to increase energy expenditure through enhanced UCP1 activation [6]. Therefore non-invasive, objective assessments of BAT activity have become increasingly necessary to determine whether adipose tissue thermogenic capacity has been altered by various interventions in pre-clinical rodent models.
Several nuclear imaging methods have been employed to measure BAT activity in rodents, such as PET/CT [7–10], fMRI [11,12], or 13C-MRS [13] that provide estimates of adipose tissue metabolism. However, these methods rely on the assumption that circulating substrate uptake (FDG-PET/CT, 13C-MRS) or blood flow (fMRI) reflects BAT activity. Since thermal energy is a specific end product of UCP1-mediated metabolism in BAT, its detection is an ideal surrogate of BAT activity. Several studies have measured surface body temperature using infrared imaging in rodents as an analog to BAT activity under basal or stimulated conditions [14–18], however, it remains unknown whether this technique truly measures BAT-derived thermogenesis. Therefore, we chose to test whether surface body temperature assessed using infrared thermography accurately reflects changes in BAT activity in vivo when challenged with the highly specific β3-adrenoreceptor agonist CL-316,243, which is greater than 10,000 times more selective over other β-adrenergic receptors [19].
2. Results
2.1. Validation that surface infrared thermography detects heat output from UCP1
In order to test the specificity of our protocol (Figure 1A and B) to detect UCP1-derived thermogenesis, we injected mice lacking UCP1 (Ucp1−/−) and wild-type litter mates (Ucp1+/+) with saline or the β3-adrenergic agonist CL-316,243 on separate days and measured oxygen uptake and dorsal surface temperature. Ucp1+/+ mice had a significant increase in oxygen uptake following injection of CL-316,243 compared with the saline trial (50 ± 8% higher, Figure 1C, P < 0.05), however, this effect was absent in Ucp1−/− litter mates (7 ± 3% higher, P > 0.05). Similarly, only Ucp1+/+ mice increased dorsal surface temperature in the interscapular (Figure 1D, P < 0.05) or entire body area (Figure 1E, P < 0.05), demonstrating that the thermal changes detected using the infrared camera were specific to UCP1 (for representative images see Figure 1F).
Figure 1.
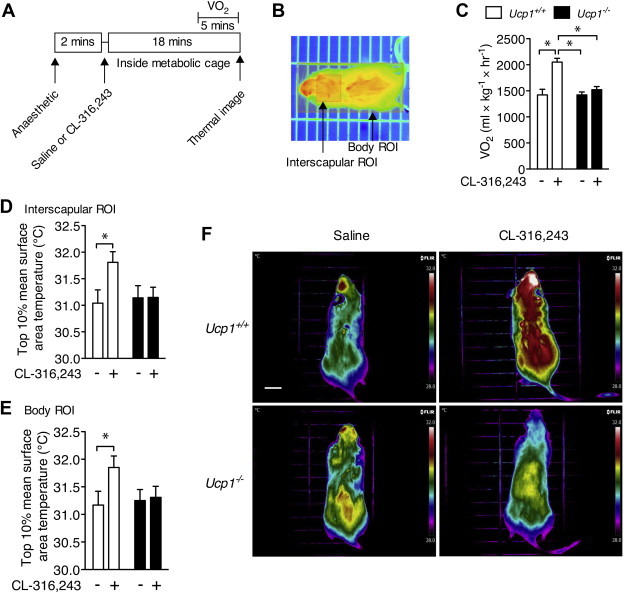
Infrared thermography specifically detects UCP1-mediated thermogenesis in vivo. (A) Time course of the indirect calorimetry and infrared thermography measurements. (B) A representative image of the region of interest (ROI) boxes overlaid on a mouse infrared image during Amide image analysis. (C) Oxygen uptake (VO2) and dorsal surface temperature within a region of interest (ROI) surrounding, (D) the interscapular BAT area, and (E) the entire body of Ucp1+/+ and Ucp1−/− mice following i.p. injection of saline or CL-316,243. N = 8–9 per group. Surface temperature is calculated as the average of the highest 10% area of the ROI. (F) Representative infrared images of Ucp1+/+ and Ucp1−/− mice following the two separate treatments. Images are displayed using the rainbow high contrast color palette in the FLiR Research IR program using a temperature linear display between 28 and 32 °C. Scale bar is 1 cm. *Indicates a significant difference (P < 0.05) from the indicated group as determined using a 2-way repeated measures ANOVA. Data are mean ± SEM.
2.2. Assessing changes in BAT thermogenic capacity using infrared imaging
We next sought to determine whether infrared thermography could be used to detect differences in BAT activity in response to ambient housing temperature. The thermoregulatory adaptation of BAT activity in colder environments is considered one of the main functions of BAT [5]. We found that mice housed at 23 °C had a greater rate of oxygen consumption with CL-316,243 and basally compared with mice bred and housed at 30 °C (Figure 2A, main effect of housing temperature and CL-316,243 treatment as well as an interaction effect, P < 0.05). The surface temperature of the interscapular ROI showed similar changes to VO2 with the β3-agonist (Figure 2B, main effect of housing temperature and CL-316,243 treatment as well as an interaction effect, P < 0.05), but the body ROI only showed a main effect of housing temperature and CL-316,243 treatment (Figure 2C, P < 0.05, for representative images see Figure 2D). Due to the agreement between VO2 and surface temperature in the above experiments, we determined the association between the CL-316,243 induced change in oxygen uptake and the corresponding change in surface body temperature using the interscapular and whole body ROIs. We also included male mice housed at 23 °C in this analysis in order to determine if this relationship was independent of gender. We found significant associations between changes in oxygen uptake and dorsal surface temperature of the interscapular region (Figure 2E, R2 = 0.602, P < 0.05) and the whole body (Figure 2F, R2 = 0.507, P < 0.05), demonstrating a strong positive relationship between changes in whole body energy metabolism and thermogenesis detected via infrared imaging.
Figure 2.
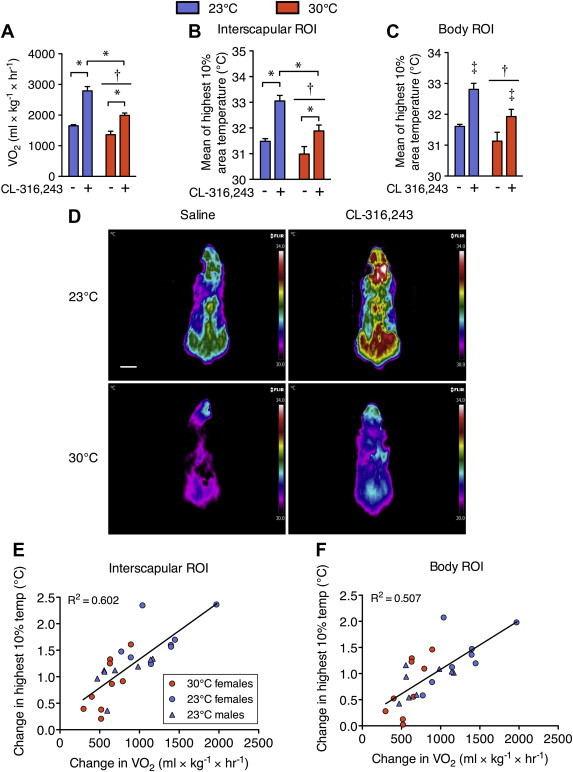
Surface temperature changes in response to a β3-adrenergic agonist reflect brown adipose tissue activity differences due to the ambient housing temperature. (A) Oxygen uptake (VO2) and dorsal surface temperature within a region of interest (ROI) surrounding, (B) the interscapular BAT area, and (C) the entire body of C57Bl6 mice housed at 30 °C or 23 °C following i.p. injection of saline or CL-316,243. Surface temperature is calculated as the average of the highest 10% area of the ROI. (D) Representative infrared images of each ambient temperature group after saline or CL-316,243 injection. Images are displayed using the rainbow high contrast color palette in the FLiR Research IR program using a temperature linear display between 30 and 34 °C. Scale bar is 1 cm. Significant (P < 0.05) correlations between changes in metabolic rate (VO2) and changes in dorsal surface temperature using the (E) interscapular or (F) the whole body ROIs. N = 8–9 per group. Oxygen uptake and temperature data were compared using a 2-way repeated measures ANOVA with injection condition and housing temperature as factors. Correlations were performed using Pearson's Regression. Significance was considered as P < 0.05. *Indicates a significant difference due to a 2-way interaction. †Indicates an overall effect of ambient housing temperature. ‡Indicates an overall effect of CL-316,243 treatment. Data are mean ± SEM.
3. Discussion
The present results demonstrate for the first time that stimulated dorsal surface temperature represents an accurate determination of UCP1-mediated thermogenesis. Additionally, we show this measurement is sufficient to differentiate between mice maintained under standard animal housing conditions (23 °C), a stimulus known to promote a thermogenic program in adipose tissue, compared with mice raised at thermoneutrality (30 °C). A benefit of the present method is that it causes minimal physiologic stress in the tested animals. Previous studies examining responses to stress with thermal imaging have shaved rodents prior to testing [20,21], which may alter the natural thermoregulatory state of the animals and preclude other subsequent experiments. Other studies have used infrared imaging to measure BAT activity in conscious mice [14,17] or using non-selective β-adrenergic agonists [15,22] without validating that the resulting heat signature is derived from BAT. Moreover, under these conditions it is very likely that non-adipose tissues such as skeletal muscle may influence changes in whole body thermogenesis, confounding the interpretations of results. Further, the described analysis of thermal images can be done quickly, is relatively low cost, and does not require highly trained personnel as compared with nuclear imaging. In addition, compared with FDG-PET there is no radiation, which allows sequential and more frequent measurements in the same animal.
Traditional measures of BAT metabolism utilize the principle of local glucose uptake (FDG-PET) or blood flow (fMRI) as analogous measures of tissue activity. However, FDG uptake in response to CL-316,243 stimulation remains inducible in female mice that lack UCP1 [23], demonstrating some degree of non-UCP1 related glucose metabolism. Further, adipose tissue vascular function is reduced with insulin resistance [24], therefore, local blood flow may not accurately reflect adipocyte metabolism. It should be noted that a recent study utilizing MRS imaging of infused 13C-pyruvate may address some of the pitfalls of FDG-PET/CT and MRI imaging [13], however, to our knowledge this method has not been performed in Ucp1−/− mice to demonstrate its selectivity for BAT activity. In the future it will be necessary to compare thermal imaging with other methods used to detect BAT activity following different metabolic stimuli. The current method uses dorsal thermal imaging and since in mice BAT is located in the interscapular region, it is likely that BAT is the predominant contributor to the heat generated after an adrenergic challenge. Further validation using thermal imaging of mice on the ventral plane is required to determine whether this technique may be sensitive enough to detect changes in the activity and/or abundance of beige/brite adipose tissue.
Brown adipose tissue holds an enormous potential to improve metabolic health. In order to more accurately determine the capacity for BAT activation, we have validated the use of infrared thermography as a means to rapidly assess BAT-derived thermogenesis.
4. Materials and methods
4.1. Mouse breeding and housing
Mice heterozygous for Ucp1 expression were obtained from Jackson Laboratories and bred to produce wild-type (Ucp1+/+) and Ucp1-null (Ucp1−/−) mice. Mice were bred and housed at an ambient temperature of 30 °C to prevent thermal stress to the Ucp1−/− mice. A separate cohort of eight male and eight female C57Bl6 mice were acquired from Jackson Laboratories at 11 weeks of age and were housed at 23 °C. All cohorts of mice were tested at 3–4 months of age, maintained on a chow diet (Harlan Teklab diet #8640), and kept on a 12 h light/dark cycle (lights on at 0700h). Mice were handled according to procedures previously approved by the McMaster University Animal Research Ethics Board.
4.2. Indirect calorimetry and thermal imaging
For the metabolic cage studies, mice were tested on two days separated by at least 24 h in a room maintained at 26–28 °C. Mice were anaesthetized using an intraperitoneal (i.p.) injection of 0.5 mg/g body weight Avertin (2,2,2-Tribromoethanol dissolved in 2-methyl-2-butanol; Sigma Aldrich). After 2 min, mice were i.p. injected (opposite side of the body as anesthetic) with saline or 0.033 nmol/g body weight of the β3-adrenergic agonist CL-316,243 (Sigma Aldrich) dissolved in saline. This dose of CL-316,243 was chosen as it is low enough to not produce secondary effects such as inflammation in white adipose tissue [25]. Mice were then placed dorsal side up onto an enclosed stationary treadmill and oxygen uptake was monitored using an indirect calorimetry system (Columbus Instruments, Columbus, OH) with air sampled every 5 s. Twenty minutes following anesthetic injection, mice were removed from the metabolic cage and placed dorsal side up on a bare cage grid. This prolonged period following injection of saline or CL-316,243 allows for stabilization of oxygen uptake (VO2), maximal activation of BAT (in the case of CL-316,243) and consistent thermal measurements (Figure S1a). An infrared camera (T650sc, emissivity of 0.98, FLiR Systems) mounted in the top of a box placed overtop of the mouse on the cage grid was used to acquire a static dorsal thermal image at a focal length of 30 cm immediately after removal from the metabolic monitoring treadmill. Mice were tested with saline and CL-316,243 on separate days rather than sequentially on the same day because we found in pilot experiments that, while measurements of oxygen uptake resembled the current data, thermal imaging data failed to show changes with CL-316,243 (Figure S1b–d), likely due to body cooling in the unconscious mice. Thus, one can only compare thermal measurements if the anesthetic cooling effect is standardized across treatments.
4.3. Data analysis
Indirect calorimetry measurements were exported to CSV files using the CLAMS examination (CLAX) software. VO2 measurements for each condition are the average of the final 5 min of measurement. In order to analyze thermal images, files were converted to semicolon delimited. CSV files using the FLiR Research IR program, and then batch converted to. RAW files. The .RAW files were imported into the freely available image analysis software Amide for Mac OSX (http://amide.sourceforge.net/index.html) by specifying the data format as float, little endian 32-bit, 0 offset bytes, 480 × 640 × 1 dimensions and gate, frames, and voxel size as 1. Images were aligned and overlapped in order to draw a region of interest (ROI) capturing the entire body of the mouse (body ROI) or a smaller area surrounding the interscapular region (interscapular ROI) such that each type of ROI was overlaid on all thermal images at once. This allowed for identical sizing of each type of ROI (body box or interscapular box) across all mice and conditions. The interscapular ROI was sized 2.07 cm by 2.28 cm for all mice, started at the rearward base of the ears (Figure 1B) and was centered laterally on the scapulae. The body box was sized 9 cm by 4.2 cm in this study in order to accommodate the body of the largest mouse. The absolute scaling of the images was confirmed using the cage grid spacing as the standard. For each ROI, the mean of the warmest 10% area was calculated using Amide and used as the primary variable across conditions. Using the mean of the highest 10% area allows for an objective quantification of thermal changes, as the warmest part of the torso of wild-type mice is always the interscapular region in wild-type mice. Temperature scaling of representative thermal images was centered around the mean body temperature of all mice being compared and a scale span of 4 °C was used for good color contrast between the saline and CL-316,243 treatments.
4.4. Statistics
For analyses comparing Ucp1+/+ and Ucp1−/− mice or mice housed at 23 °C and 30 °C a 2-way repeated measures ANOVA was used to assess genotype/housing temperature and stimulation condition effects. When significant differences were observed (P < 0.05), a Tukey's honestly significant different post-hoc test was used to assess specific differences. Correlations were performed using Pearson's Regression. All statistics were performed using Statistica 5.0 or GraphPad Prism 5.
Author contributions
J.D.C., K.M.M., T.H.F., E.P.M., and G.R.S. designed the study. J.D.C. performed the experiments and analyzed the data. J.D.C., K.M.M., G.R.S., and E.P.M. wrote and edited the manuscript.
Acknowledgments and funding sources
This work was funded by a research grant from the Faculty of Health Sciences at McMaster University to G.R.S. and K.M.M. E.P.M. was supported by a Canadian Diabetes Association Post-Doctoral Fellowship Number is: PF-3-13-4311-EM. G.R.S. is a Canada Research Chair in Metabolism and Obesity.
Contributor Information
Katherine M. Morrison, Email: morriso@mcmaster.ca.
Gregory R. Steinberg, Email: gsteinberg@mcmaster.ca.
Conflict of interest
None declared.
Appendix A. Supplementary data
The following is the supplementary data related to this article:
References
- 1.Enerbäck S. Human brown adipose tissue. Cell Metabolism. 2010;11:248–252. doi: 10.1016/j.cmet.2010.03.008. [DOI] [PubMed] [Google Scholar]
- 2.Cypess A.M., Lehman S., Williams G., Tal I., Rodman D., Goldfine A.B. Identification and importance of brown adipose tissue in adult humans. New England Journal of Medicine. 2009;360:1509–1517. doi: 10.1056/NEJMoa0810780. [DOI] [PMC free article] [PubMed] [Google Scholar]
- 3.van Marken Lichtenbelt W.D., Vanhommerig J.W., Smulders N.M., Drossaerts J.M., Kemerink G.J., Bouvy N.D. Cold-activated brown adipose tissue in healthy men. New England Journal of Medicine. 2009;360:1500–1508. doi: 10.1056/NEJMoa0808718. [DOI] [PubMed] [Google Scholar]
- 4.Virtanen K.A., Lidell M.E., Orava J., Heglind M., Westergren R., Niemi T. Functional brown adipose tissue in healthy adults. New England Journal of Medicine. 2009;360:1518–1525. doi: 10.1056/NEJMoa0808949. [DOI] [PubMed] [Google Scholar]
- 5.Enerbäck S., Jacobsson A., Simpson E.M., Guerra C., Yamashita H., Harper M.E. Mice lacking mitochondrial uncoupling protein are cold-sensitive but not obese. Nature. 1997;387:90–94. doi: 10.1038/387090a0. [DOI] [PubMed] [Google Scholar]
- 6.Wu J., Cohen P., Spiegelman B.M. Adaptive thermogenesis in adipocytes: is beige the new brown? Genes & Development. 2013;27:234–250. doi: 10.1101/gad.211649.112. [DOI] [PMC free article] [PubMed] [Google Scholar]
- 7.Baba S., Tatsumi M., Ishimori T., Lilien D.L., Engles J.M., Wahl R.L. Effect of nicotine and ephedrine on the accumulation of 18F-FDG in brown adipose tissue. Journal of Nuclear Medicine. 2007;48:981–986. doi: 10.2967/jnumed.106.039065. [DOI] [PubMed] [Google Scholar]
- 8.Baba S., Jacene H.A., Engles J.M., Honda H., Wahl R.L. CT Hounsfield units of brown adipose tissue increase with activation: preclinical and clinical studies. Journal of Nuclear Medicine. 2010;51:246–250. doi: 10.2967/jnumed.109.068775. [DOI] [PubMed] [Google Scholar]
- 9.Mirbolooki M.R., Constantinescu C.C., Pan M.-L., Mukherjee J. Quantitative assessment of brown adipose tissue metabolic activity and volume using 18F-FDG PET/CT and Beta3-adrenergic receptor activation. EJNMMI Research. 2011;1:30. doi: 10.1186/2191-219X-1-30. [DOI] [PMC free article] [PubMed] [Google Scholar]
- 10.Wang X., Minze L.J., Shi Z.-Z. Functional imaging of brown fat in mice with 18F-FDG micro-PET/CT. Journal of Visualized Experiments. 2012 doi: 10.3791/4060. (6) [DOI] [PMC free article] [PubMed] [Google Scholar]
- 11.Chen Y.I., Cypess A.M., Sass C.A., Brownell A.-L., Jokivarsi K.T., Kahn C.R. Anatomical and functional assessment of brown adipose tissue by magnetic resonance imaging. Obesity (Silver Spring) 2012;20:1519–1526. doi: 10.1038/oby.2012.22. [DOI] [PMC free article] [PubMed] [Google Scholar]
- 12.Khanna A., Branca R.T. Detecting brown adipose tissue activity with BOLD MRI in mice. Magnetic Resonance in Medicine. 2012;68:1285–1290. doi: 10.1002/mrm.24118. [DOI] [PMC free article] [PubMed] [Google Scholar]
- 13.Lau A.Z., Chen A.P., Gu Y., Ladouceur-Wodzak M., Nayak K.S., Cunningham C.H. Noninvasive identification and assessment of functional brown adipose tissue in rodents using hyperpolarized 13C imaging. International Journal of Obesity (London) 2014;38:126–131. doi: 10.1038/ijo.2013.58. [DOI] [PubMed] [Google Scholar]
- 14.Akesson L., Hawkins T., Jensen R., Fuller J.M., Breslow N.E., Lernmark A. Decreased core temperature and increased beta(3)-adrenergic sensitivity in diabetes-prone BB rats. Diabetes Technology & Therapeutics. 2007;9:354–362. doi: 10.1089/dia.2006.0036. [DOI] [PubMed] [Google Scholar]
- 15.Jackson D.M., Hambly C., Trayhurn P., Speakman J.R. Can non-shivering thermogenesis in brown adipose tissue following NA injection be quantified by changes in overlying surface temperatures using infrared thermography? Journal of Thermal Biology. 2001;26:85–93. doi: 10.1016/s0306-4565(00)00023-1. [DOI] [PubMed] [Google Scholar]
- 16.Schulz T.J., Huang P., Huang T.L., Xue R., McDougall L.E., Townsend K.L. Brown-fat paucity due to impaired BMP signalling induces compensatory browning of white fat. Nature. 2013;495:379–383. doi: 10.1038/nature11943. [DOI] [PMC free article] [PubMed] [Google Scholar]
- 17.Warner A., Rahman A., Solsjö P., Gottschling K., Davis B., Vennström B. Inappropriate heat dissipation ignites brown fat thermogenesis in mice with a mutant thyroid hormone receptor α1. Proceedings of the National Academy of Sciences of the United States of America. 2013;110:16241–16246. doi: 10.1073/pnas.1310300110. [DOI] [PMC free article] [PubMed] [Google Scholar]
- 18.Whittle A.J., Carobbio S., Martins L., Slawik M., Hondares E., Vázquez M.J. BMP8B increases brown adipose tissue thermogenesis through both central and peripheral actions. Cell. 2012;149:871–885. doi: 10.1016/j.cell.2012.02.066. [DOI] [PMC free article] [PubMed] [Google Scholar]
- 19.Bloom J.D., Dutia M.D., Johnson B.D., Wissner A., Burns M.G., Largis E.E. Disodium (R,R)-5-[2-[[2-(3-chlorophenyl)-2-hydroxyethyl]-amino] propyl]-1,3-benzodioxole-2,2-dicarboxylate (CL 316,243). A potent beta-adrenergic agonist virtually specific for beta 3 receptors. A promising antidiabetic and antiobesity agent. Journal of Medicinal Chemistry. 1992;35:3081–3084. doi: 10.1021/jm00094a025. [DOI] [PubMed] [Google Scholar]
- 20.Carter E.A., Bonab A.A., Paul K., Yerxa J., Tompkins R.G., Fischman A.J. Association of heat production with 18F-FDG accumulation in murine brown adipose tissue after stress. Journal of Nuclear Medicine. 2011;52:1616–1620. doi: 10.2967/jnumed.111.090175. [DOI] [PMC free article] [PubMed] [Google Scholar]
- 21.Marks A., Vianna D.M.L., Carrive P. Nonshivering thermogenesis without interscapular brown adipose tissue involvement during conditioned fear in the rat. American Journal of Physiology. Regulatory, Integrative and Comparative Physiology. 2009;296:R1239–R1247. doi: 10.1152/ajpregu.90723.2008. [DOI] [PubMed] [Google Scholar]
- 22.Nishio M., Yoneshiro T., Nakahara M., Suzuki S., Saeki K., Hasegawa M. Production of functional classical brown adipocytes from human pluripotent stem cells using specific hemopoietin cocktail without gene transfer. Cell Metabolism. 2012;16:394–406. doi: 10.1016/j.cmet.2012.08.001. [DOI] [PubMed] [Google Scholar]
- 23.Jeanguillaume C., Metrard G., Ricquier D., Legras P., Bouchet F., Lacoeuille F. Visualization of activated BAT in mice, with FDG-PET and its relation to UCP1. Advances in Molecular Imaging. 2013;3:19. [Google Scholar]
- 24.Karpe F., Fielding B.A., Ilic V., Macdonald I.A., Summers L.K.M., Frayn K.N. Impaired postprandial adipose tissue blood flow response is related to aspects of insulin sensitivity. Diabetes. 2002;51:2467–2473. doi: 10.2337/diabetes.51.8.2467. [DOI] [PubMed] [Google Scholar]
- 25.Li P., Zhu Z., Lu Y., Granneman J.G. Metabolic and cellular plasticity in white adipose tissue II: role of peroxisome proliferator-activated receptor-alpha. American Journal of Physiology. Endocrinology and Metabolism. 2005;289:E617–E626. doi: 10.1152/ajpendo.00010.2005. [DOI] [PubMed] [Google Scholar]
Associated Data
This section collects any data citations, data availability statements, or supplementary materials included in this article.