

SUMMARY
Store-operated calcium entry (SOCE) regulates critical cellular functions and is determined by precise ER/plasma membrane (PM) junctional interactions. Here we have assessed the effect of hypotonic cell volume increase on SOCE in a salivary gland epithelial cell line (HSG). Thapsigargin (Tg) activated a 2APB- and 1 μM Gd3+- sensitive, inwardly rectifying, cation current, ISOC, while hypotonic solution (150 mOsm) induced cell swelling and activated an outwardly rectifying cation current that was blocked by 100 μM Gd3+ but not by 2APB. HTS addition before or after Tg attenuated the sensitivity of Ca2+ influx to 2APB and 1 μM Gd3+. After HTS-induced volume increase, while stimulation of cells with Tg resulted in intracellular Ca2+ release without Ca2+ influx, stimulation with CCh caused neither internal Ca2+ release nor Ca2+ influx Importantly, HTS caused the ER to recede from the plasma membrane which prevented Tg-stimulated clustering of STIM1 in the ER/PM region and association of STIM1 with TRPC1 and Orai1. Disruption of SOCE was dependent on the level of hypotonic stress as 225 mOsm HTS induced relatively less cell swelling or disruption of SOCE. These results demonstrate that epithelial cells can tolerate small increases (up to 5%) in cell volume while larger increases lead to disruption of ER-PM interactions that are critical for activation of SOCE. We suggest that loss of SOCE could impact cell function and contribute to the deleterious effects of severe hypotonic stress.
1. INTRODUCTION
Activation of store-operated calcium entry (SOCE) in response to depletion of intracellular Ca2+ channels is a precisely orchestrated process that involves signaling from the ER to the plasma membrane (PM) and assembly of store-operated calcium (SOC) channels. Both temporal and spatial determinants contribute to the regulation of SOCE. A central player in this process is STIM1, a Ca2+ binding ER protein, which acts as a sensor of [Ca2+] in the ER. Following store depletion, STIM1 oligomerizes and then translocates to the cell periphery [1-3]. The site of these peripheral STIM1 aggregates, referred to as puncta, represents the location where it interacts with and activates channels involved in SOCE. Members of the Orai and TRPC proteins have been suggested as components of these channels [4-7], although there is considerable debate presently regarding the role of TRPC1 in SOCE [8]. Orai1 is the critical component of the highly Ca2+-selective CRAC channels while TRPCs contribute to relatively nonselective Ca2+ permeable cation channels in a variety of cells [4, 5, 9]. Both Orai1 and TRPC1 are activated by STIM1 after store depletion [6, 7, 10-12]. Orai1 is diffusely localized in the plasma membrane of resting cells and after store depletion is recruited to the region of the STIM1 puncta. While the exact mechanism regulating the movement of Orai1 within the plasma membrane is not yet clear, the two proteins are strongly colocalized following stimulation. Furthermore, CRAC channel activity has been detected at this very location [1, 13]. Thus the channel associates with its regulatory component and is activated within specialized ER/PM domains.
Not much is known regarding the architecture or spatial constraints of this critical ER/PM signaling domain. We have previously reported that TRPC1, a component of SOC channels, is anchored and is regulated by STIM1, within lipid raft domains [14, 15]. We suggested that plasma membrane lipid rafts might serve as a platform for assembly of the SOC channel complex. Consistent with this, the association of STIM1 with lipid rafts increased following store depletion. Further, STIM1 interacted with TRPC1 within these plasma membrane domains and disruption of lipid rafts decreased the STIM1-TRPC1 interaction as well as SOCE. More recently, plasma membrane PIP2 has been proposed to serve as an anchor for peripheral STIM1 aggregates [16, 17]. These data are suggestive of lipid raft involvement in STIM1 signaling since bulk of the PIP2 in the plasma membrane is associated with lipid raft domains. A role for lipid rafts in regulation of SOCE via Orai/TRPC channels was also suggested recently [18].
SOCE regulates a number of critical cellular processes such as activation of lymphocytes and macrophages, platelet aggregation, exocrine gland fluid secretion, proliferation of endothelial and other cells types, etc. [19, 20]. Recent studies show that a number of cellular processes modulate SOCE by affecting the ER-PM interactions that are critical for SOCE signaling. Cell division, both meiosis [21] and mitosis [22], result in inactivation of ICRAC. In the former instance, there is internalization of Orai1 which leads to loss of SOCE. The latter study shows that mechanisms associated with mitosis result in phosphorylation of STIM1, leading to loss of STIM1 clustering in the ER/PM domains and therefore loss of SOCE. Thus, while the integrity and architecture of the ER/PM junctional region is critical for the regulation of SOCE, the interactions between the proteins in this region and probably the architecture of the domain itself have remarkable dynamic properties.
Epithelial cells undergo volume changes in response to physiological stimulation during secretion of fluids and electrolytes or following pathological conditions such as ischemia or metabolic imbalance. However, these cells also have the unique ability to recover their normal cell volume in the continued presence of the stimulus. Regulatory volume decrease (RVD) is triggered in response to an increase in cell volume while regulatory volume increase (RVI) occurs following cell shrinkage. Under physiological conditions, salivary gland acinar cells undergo a decrease in cell volume due to water secretion in response to agonist stimulation of fluid secretion which is followed by RVI which reverses the cell volume to near resting levels [23, 24]. However, depending on the magnitude and length of stimulus, these cells often display an overshoot in cell volume when the signal is terminated (i.e. volume increases transiently to values above resting). This overshoot is due to agonist-dependent upregulation of ion transporters such as NKCC1 suggesting that the cell might continue to increase in volume even after the stimulation is terminated [23]. These findings also suggest that the robust decrease in cell volume during agonist stimulation of fluid secretion likely masks an underlying increase in cell volume due to water inflow. In acinar cells this is consistent with the proposed entry of water into the cell via the basolateral membrane and exit via the luminal membrane [25, 26]. Notably ductal cells are almost constantly exposed to hypoosmotic saliva at their luminal region [23] . Irrespective of whether the initial event is cell swelling or shrinkage, return of the cell to its resting volume is critical. Impaired RVD (i.e. persistent swelling) has been associated with necrotic cell death while cell shrinkage (without induction of RVI) is associated with apoptotic cell death [27, 28]. As discussed above, SOCE critically depends on molecular interactions that require ER-PM interactions. Since SOCE is critical for regulation of a variety of functions in salivary gland epithelial cells, it is important to consider the impact of cell volume changes on this critical Ca2+ entry mechanism. In the present study, we have examined the effect on SOCE of an increase in cell volume induced by exposure of cells to hypotonic solution (HTS), a maneuver often used to assess mechanisms involved in cell volume changes. Exposure to HTS results in influx of water into the cells and increase in cell volume which is followed by RVD and recovery of cell volume to near resting levels in the continued presence of HTS. We hypothesized that an increase in cell volume could induce disruption of SOCE by perturbing ER/PM junctional domains that are required for SOCE.
We report herein that cell swelling by HTS leads to activation of a Ca2+ entry pathway that is distinct from SOCE. In our previous study [29], we have identified that TRPV4 is the cation channel mediating Ca2+ entry in response to HTS-induced increase in cell volume. Here we we show that increase in cell volume also attenuated SOCE as a result of perturbations in the architecture of the ER/PM junctional region. Peripheral ER receded from the PM region in cells during cell swelling. This was accompanied by a decrease in the formation of STIM1 puncta in the ER/PM junctional region and disruption of STIM1/TRPC1/Orai1 association, both of which are required for activation of SOCE the humans submandibular gland cells line, HSG. Together these alterations account for the loss of SOCE. Further, the extent of disruption of ER/PM signaling was dependent on the level of hypotonic stress and cell swelling. Although the cell volume recovered to almost resting conditions in the continued presence of high hypotonic stress, SOCE did not recover. With lower hypotonic stress both cell swelling and attenuation of SOCE were reduced and furthermore, Tg stimulation after RVD lead to full activation of SOCE. In aggregate, these findings suggest that increases in cell volume can have significant effects on SOCE which can impact regulation of cell function.
2. MATERIALS AND METHODS
2.1. Cell Culture
Human submandibular gland (HSG) cells were cultured using Earle’s minimal essential medium. The media were supplemented with 10% fetal calf serum, 2 mM glutamine, 1% penicillin/streptomycin at 37°C in 5% CO2 and 100% humidity.
2.2. Patch clamp experiment
Coverslips with HSG cells were transferred to the recording chamber and perfused with an standard external solution with the following composition (mM): NaCl, 145; KCl, 5; MgCl2, 1; CaCl2, 1; HEPES, 10; Glucose, 10; pH 7.4 (NaOH). The patch pipette had resistances between 3 and 5 mΩ after filling with the standard intracellular solution that contained the following (mM): cesium methane sulfonate, 145; NaCl, 8; MgCl2, 10; HEPES, 10; EGTA, 10; pH 7.2 (CsOH). Osmolarity for all the solutions was adjusted with mannose to 300±5 mOsm using a vapor pressure Osmometer (Wescor). Patch clamp experiments were performed in the standard whole cell configuration at room temperature (22–25 °C) using an Axopatch 200B amplifier (Axon Instruments). The current was assessed by measuring the current amplitudes at a potential of -80 mV, taken from the currents in response to voltage ramps ranging from -90 to 90 mV over a period of 1 s imposed every 4 s (holding potential was 0 mV) and digitized at a rate of 1 KHz. Liquid-junction potentials were less than 8 mV and were not corrected. Capacitative currents and series resistance were determined and minimized. For analysis, current recorded during the first ramp was used for leak subtraction of the subsequent current records.
2.3. [Ca2+]i Measurement
Fura2 fluorescence was measured in single HSG cells cultured for 24 to 48h on glass bottom MatTek tissue culture dishes. Cells were loaded with Fura2 by incubation with 1 μM Fura2-AM at 37 °C for about 45 to 60 minutes. Fluorescence was recorded using a Polychrome V spectrofluorimeter (Till Photonics) and the Metafluor imaging software (Molecular Devices) with excitation at 340 and 380 nm and emission at 510 nm. Cells were bathed in standard external solution, with Ca2+ omitted from the solution (Ca2+-free medium). Data are presented as mean ± S.E. Origin 7.5 (OriginLab) was used for data analysis and display.
2.4. Cell volume measurement
Cells were loaded with the fluoroprobe calcein (Molecular Probes) and excited at 490 nm. Emitted fluorescence was measured at 510 nm. In situ calibration of the dye was performed. The relationship between dye fluorescence and the volume change was linear over a volume range from +35 to −35%. All experiments were repeated using at least three different passages of cells. Data are presented as mean ± S.E. Origin 7.5 (OriginLab) was used for data analysis and display. Significant difference between individual groups was tested by using analysis of variance. For measuring swelling-activated currents and volume changes, an isotonic solution containing (mM) 75 NaCl, 6 CsCl, 5 CaCl2, 1 MgCl2, 10 HEPES, 150 D-mannitol, and 10 glucose, pH 7.4, with NaOH (305 ± 5 mOsm) was used. Cell swelling was induced by omitting mannitol from this solution to reach proper osmolarity. In some experiments, the reduction of osmolarity was achieved by reducing NaCl in the normal external solution as indicated.
2.5. TIRF microscopy (TIRFM)
TIRFM imaging was conducted using an Olympus IX81 motorized inverted microscope (Olympus) as described previously [14, 15]. Images were collected using a Hamamatsu EM C9100 camera (Hamamatsu) and MetaMorph imaging software (Molecular Devices). Cells were bathed in a Ca2+-containing standard external solution (recipe as described above). Solution changes were accomplished by selecting flow from a multi-chambered valve controlled mechanical fed reservoir.
2.6 Immunoprecipitation and Western blotting
Immunoprecipitation was carried out as described earlier [15, 30]. Following stimulation cells were lysed and used for immunoprecipitation. Proteins were resolved in 4-12% NuPAGE gels followed by Western blotting with the desired antibodies.
3. RESULTS AND DISCUSSION
3.1. Hypotonic conditions induce an increase in cell volume, activation of non-selective cation channel, and attenuation of SOCE
HSG displayed an increase in cell volume when exposed to hypotonic solution (HTS; 150 mOsm) due to inflow of water into the cell (Fig. 1A). Consistent with our previous report [29] HTS-induced cell swelling triggered an increase in [Ca2+]i (Fig. 1B). Our previous findings demonstared that this is primarily due to TRPV4-mediated Ca2+ entry. This increase in [Ca2+]i leads to the activation of a KCa channel, which together with a volume-dependent Cl- channel, account for the electrolyte flux that drives water flow and results in RVD. The HTS-stimulated Ca2+ entry pathway was quite distinct from SOCE stimulated by Tg (compare Figs. 1C and D). While SOCE was inhibited by 1μM Gd3+, HTS-mediated Ca2+ entry was sensitive to high (>100 μM) but not low [Gd3+]. Importantly, when cells were exposed to HTS after Tg stimulation, Ca2+ influx seen upon readdition of Ca2+ to the medium was no longer sensitive to 1 μM Gd3+ (Fig. 1E). Thus, HTS alters the characteristics of Tg-induced SOCE.
Fig. 1. HTS increased [Ca2+]i and RVD, and altered sensitivity of the Tg-induced Ca2+ influx to Gd3+.
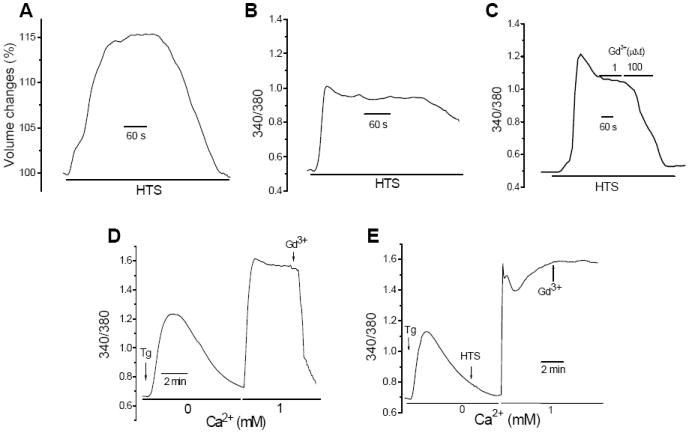
(A) HTS-induced volume changes were determined by measuring calcein fluorescence (data are expressed as % of resting volume). Further details are provided in Materials and Methods. Unless otherwise indicated osmolarity of HTS was 150 mOsm in all experiments. (B) [Ca2+]i responses (data show fura2 fluorescence, 340/380 ratio) in cells exposed to HTS. (C) Sensitivity of HTS-induced Ca2+ responses to Gd3+. (D). Tg-induced [Ca2+]i change (intracellular release was measured in Ca2+ free medium and Ca2+ entry measured after addition of 1mM Ca2+ to the external medium). 1 μM Gd3+ was added where indicated. (E). HTS was added after Tg-induced intracellular Ca2+ release prior to add-back of Ca2+. 1 μM Gd3+ was added where indicated.
This was further confirmed by using 2APB which blocks SOCE at concentrations >20 μM [4]. As shown in Figure 2A, Tg-induced Ca2+ influx was completely attenuated by addition of 20 μM 2APB, a hallmark characteristic of SOCE. Addition of HTS at the peak of the Tg-induced [Ca2+]i increase stimulated further rise in [Ca2+]i (Fig. 2B). However, subsequent addition of 20 μM 2APB did not decrease [Ca2+]i (compare Figs. 2B and C), suggesting that the characteristics of Ca2+ influx were altered. Conversely, when Tg was added after HTS-induced [Ca2+]i increase (i.e after maximal cell volume increase) there was a small additional increase in [Ca2+]i (Fig. 2D) which was also insensitive to 2APB (Fig. 2E). Together the data in Figures 1 and 2 suggest that cell volume-increase in response to hypotonic stress markedly suppresses SOCE.
Fig. 2. HTS altered the sensitivity of Tg-activated Ca2+ responses to 2APB.
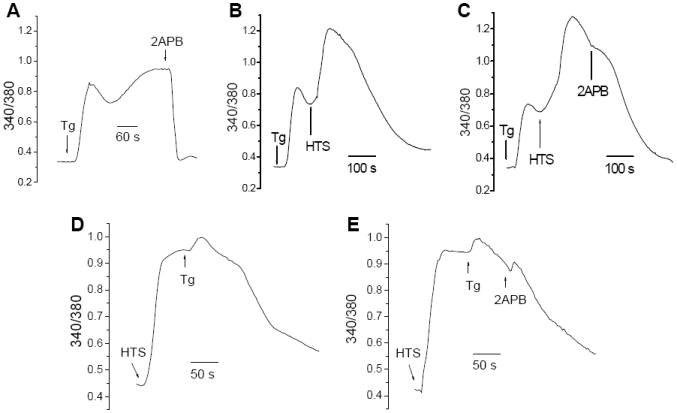
(A) Tg-induced increases in [Ca2+]i in isosmotic buffer, 20 μM 2APB was added where indicated. (B, C) HTS was added after Tg stimulation (as indicated) followed by 20 μM 2APB where indicated. (D, E) Tg was added following HTS-induced [Ca2+]i increase, 20 μM 2APB was added where indicated.
3.2. Effect of HTS on ISOC
Store depletion in HSG cells activates a relatively nonselective, inwardly rectifying, current, ISOC, which we have previously characterized [31, 32]. Here we examined the effect of HTS on this current. Tg treatment of cells leads to generation of ISOC (Fig. 3A) which was completely blocked by addition of 1μM Gd3+ to the external medium (see inset) as was the case with SOCE (see Fig. 1C). Perfusion of cells with HTS following development of Tg-stimulated ISOC (Fig. 3B, inset shows I-V curve of ISOC) lead to development of a larger and outwardly rectifying current (37±5 pA/pF, n=12), with a reversal potential about 0 mV (1.2±0.5 mV) that was not blocked by 1μM Gd3+. As reported earlier, this outwardly rectifying current is mediated by TRPV4 which is activated in response to exposure of cells to HTS [29]. A similar change in the current characteristics was induced when cells stimulated with IP3 (added to the pipette solution, which lead to generation of ISOC) were exposed to HTS in the perfusate (Figs. 3C and D). Consistent with the [Ca2+]i measurements, these data further demonstrate that HTS perturbs SOCE. To determine if HTS hindered activation of SOCE, cells were first stimulated with HTS which resulted in a outwardly rectifying large current in the cell (Figs. 3E and F). Subsequent perfusion of cells with either Tg or carbachol (in HTS) did not lead to additional increase in the current or alteration in current characteristics.
Fig. 3. HTS activated an outwardly rectifying cation conductance and altered the characteristics of Tg-stimulated ISOC.
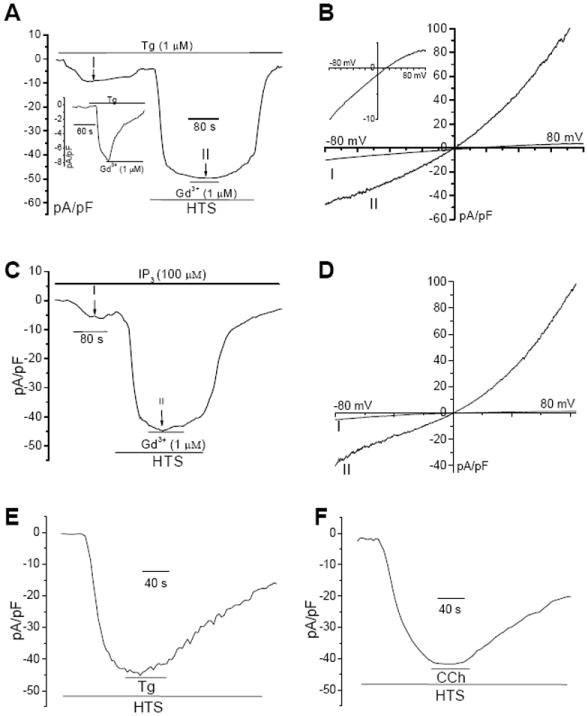
(A) Tg-induced inwardly rectifying ISOC (inset shows inhibition of this current by 1μM Gd3+). Tg stimulated cell was subsequently perfused with HTS (long bar) and 1μM Gd3+ was included in the perfusate where indicated (short bar). Details of patch clamp measurements are given in the Materials and Methods section. (B) I-V curves of the currents obtained in A (at -80 mV) at points 1 and 11. Inset shows the current at 1 on an enlarged scale. (C and D) Conditions were similar to those described for A and B except that IP3 was included in the pipette solution during current recordings. (E, F) Cells were first perfused with HTS. Tg or CCh were added as indicated after development of maximum current with HTS.
3.3. Cell swelling attenuated agonist-mediated, but not Tg-induced, internal Ca2+ release
To further examine the effect of HTS on SOCE, we compared changes in [Ca2+]i and cell volume in cells stimulated with HTS and either Tg or CCh. Figures 4A and B show that while Tg induced a small increase in [Ca2+]i in HTS-treated cells CCh did not. However, when cell volume changes were measured under these conditions, Tg addition after HTS produced a rapid transient decrease in cell volume which quickly reverted back to the pattern seen in the presence of HTS alone (compare Figs. 4C and 1A). In contrast, CCh did not alter HTS-induced change in cell volume (Fig. 4D). As seen in Figures 3E and F, neither Tg nor CCh induce any additional ISOC like current in HTS-treated cells. We have shown previously that RVD is dependent on an increase in [Ca2+]i which triggers KCa channel activation in HSG cells, an event critical for RVD [29]. Thus, we suggest that Tg-induced transient recovery of cell volume in HTS-treated cells is due to Ca2+ release from the ER, although this does not appear to affect the global [Ca2+]i (Fig. 4A).
Fig. 4. Tg, but not CCh, induced a transient volume decrease in HTS-treated cells.
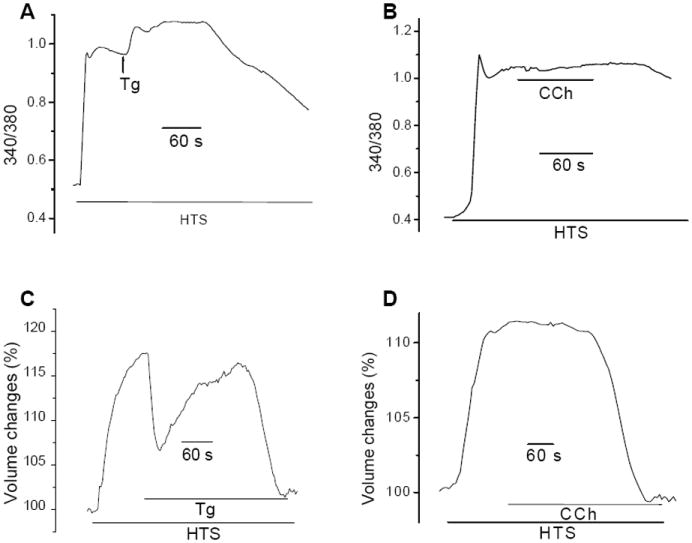
(A, B) Fura2-loaded cells were first exposed to HTS and then either Tg (A) or CCh (B). (C, D). Cell volume changes in cells under the conditions described for A and B.
To further examine the apparent loss of CCh-signaling, we assessed the status of ER in HSG cells. Under isotonic conditions, the reticular ER pattern can be clearly visualized by ER tracker using TIRFM (Fig. 5A). However, during HTS-induced cell swelling, the ER receded from the plasma membrane as indicated by a decrease in fluorescence intensity (Fig. 5A). Tg or CCh stimulation did not change ER localization or alter the effect of HTS (data not shown). This effect of HTS on ER architecture was seen within the same time interval as cell swelling. These important findings demonstrate that HTS-induced cell swelling alters the spatial arrangement of ER near the ER/PM junctional region. Thus the alterations in ER localization could account for the loss of CCh-induced Ca2+ signaling (shown above). We speculate that IP3R receptor functions could be impacted due to effects on receptor clustering or its association with other regulatory proteins [33-35], although direct effects on IP3 generation cannot be ruled out presently. However, it is important to note that loss of CCh signaling in cells will compromise function of ductal as well as acinar cells, both of which are regulated by muscarinic receptor signaling [23, 36]. HTS-induced inhibition of SOCE during cell swelling could also be a consequence of perturbation in the ER-PM signaling that couples depletion of internal Ca2+ stores to activation of SOCE.
Fig. 5. HTS induced ER in subplasma membrane region to recede and inhibited STIM1 translocation in response to Ca2+ store depletion.
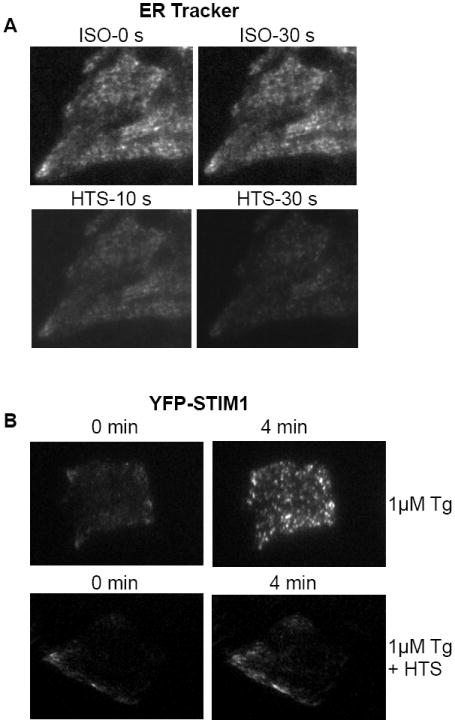
(A) HSG cells were incubated with ER-Tracker for 30 mins at 37°C and TIRFM imaging was taken continuously as shown at different time points. Cell were first exposed to isotonic (ISO) solution and then perfused with HTS. (B) STIM1 puncta formation in response to Tg stimulation (top panel) and in cells first exposed to HTS, followed by Tg (bottom panel). Images were taken by TIRFM as described in Materials and Methods.
3.4. Disruption of the ER/PM junctional regions during HTS-induced cell swelling
A key ER/PM signaling mechanism that is required for SOCE activation is the reorganization of STIM1 from a diffused ER localization to aggregates in the cell periphery. As discussed above, the location of STIM1 aggregates in the cell periphery is the site where the protein interacts with and activates plasma membrane channels involved in mediating SOCE. Disruption in the translocation of STIM1 or its interaction with the channels mediating SOCE (Orai1 and TRPC1 in HSG cells) negatively impact SOCE [15, 21, 22, 37-39]. The translocation of STIM1 in response to Tg-induced store depletion of cells in normal isotonic solution is shown in Fig 5B, upper panels. While YFP-STIM1 was not clearly detected prior to Tg addition (left panel), within 4 mins after Tg addition STIM1 relocated into puncta that were clearly visualized by TIRFM (right panel). As expected from the effects of HTS on ER localization, exposure of the cells to HTS for 3 minutes (i.e. to allow maximum cell swelling) before Tg treatment greatly reduced the relocation of STIM1 (Fig. 5B, bottom panel). These data agree well with our findings that addition of HTS before store depletion prevents activation of SOCE.
3.5. Effect of HTS-induced cell swelling on assembly of channels involved in SOCE
We have previously shown that a TRPC1/Orai1/STIM1 complex is involved in SOCE in HSG cells [30]. Further, both TRPC1 and Orai1 cluster with STIM1 in response to store depletion (Figs. 6A and C). We examined the effect of HTS on this protein complex. When cells were exposed to HTS before Tg, clustering of STIM1 with both TRPC1 and Orai1 was greatly reduced (Figs. 6B and D). This is consistent with the inhibition of STIM1 relocation by HTS-induced cell swelling (Fig. 5B). This is further demonstrated in Figure 6F which shows co-immunoprecipiation of STIM1 with TRPC1 and Orai1. The association between these three proteins was increased by Tg (compare control (ctrl) and Tg-treated (Tg) lanes in Fig 6F). However, when cells were treated with HTS prior to Tg stimulation (HTS-Tg) the association between the proteins was completely disrupted. Thus, the assembly of the Ca2+ influx channels that occurs within ER/PM junctional domains in response to store depletion is disrupted by HTS-induced increase in cell volume. This can account for the attenuation of SOCE in salivary gland cells in cells exposed to HTS. It is most likely that disruption of assembly of the channel complex is due to inhibition of peripheral STIM1 puncta.
Fig. 6. HTS decreased the association of both TRPC1 and Orai1 with STIM1 in response to Ca2+ store depletion.
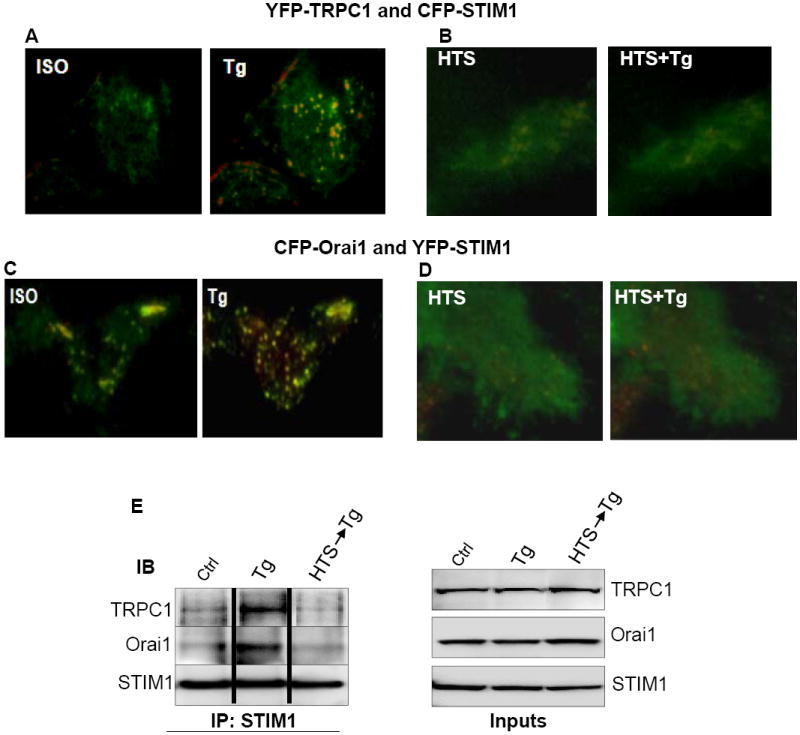
HSG cells were tranfected with 1μg of each YFP-TRPC1 and CFP-STIM1 (A, B), or Orai1-CFP and YFP-STIM1 (C, D). Cells were first exposed to isotonic (ISO) solution (A, C) or HTS (B, D) and then stimulated with Tg. Overlay images were taken by TIRFM as described in Materials and Methods. For (A, B), YFP-TRPC1 was pseudocolored green and CFP-STIM1, red. For (C, D), Orai1-CFP was pseudocolored green and YFP-STIM1, red. Areas of colocalization appears yellow in these images. (E) Immunoprecipitation (IP) with anti-STIM1 antibody of lysates from control (Ctrl) cells or cells treated with Tg (Tg), or with HTS first and then Tg (HTS, Tg). Immunoblotting was conducted with anti-TRPC1, -Orai1 and -STIM1 antibodies at 1:1000 dilution each.
3.6 Reversibility of SOCE following HTS-induced cell swelling
Epithelial cells, such as salivary gland cells, undergo dynamic changes in cell volume as a result of ion transport pathways that are activated in response to various stimuli [23, 24 , 40]. However, long term exposure to osmotic stress or acute exposure to high levels of stress has deleterious consequences on cell function and survival [27, 28]. Inhibition of SOCE can severely compromise cell function including fluid secretion and ion channel activation [32]. Thus, we examined whether SOCE recovered following RVD in the continued presence of HTS. Figure 7A shows that following exposure to high level of osmotic stress (150 mOsm), there was no recovery of SOCE. Addition of Tg at a time when cell volume decreased back to near normal values induced only intracellular Ca2+ release. However, in cells exposed to lower levels of stress (225 mOsm HTS), substantial [Ca2+]i increase was seen after Tg addition which was blocked by 2APB (Figs. 7B and C). Similarly, addition of Tg at the peak of cell volume and [Ca2+]i increase induced under this condition, resulted in activation of SOCE. Thus, the extent of disruption of ER/PM signaling and loss of SOCE is dependent on the severity of hypotonic stress imposed on the cell. Lower levels of stress lead to less swelling (e.g. about 5% increase with 225 mOsm and 15% increase with 150 mOsm, Figs. 7D and E) and therefore induce relatively less perturbation of ER/PM interactions involved in SOCE. A significant finding of this study is that although cells appear to regulate their cell volume when exposed to severe hypotonic stress (see Fig. 7D), critical cellular mechanisms such as SOCE are disrupted even after recovery to near normal cell volume (Fig. 7A). In the continued presence of the stress, such prolonged loss of SOCE could have serious consequences on cell function.
Fig. 7. Effect of HTS on SOCE was dependent on the extent of cell swelling and severity of stress.
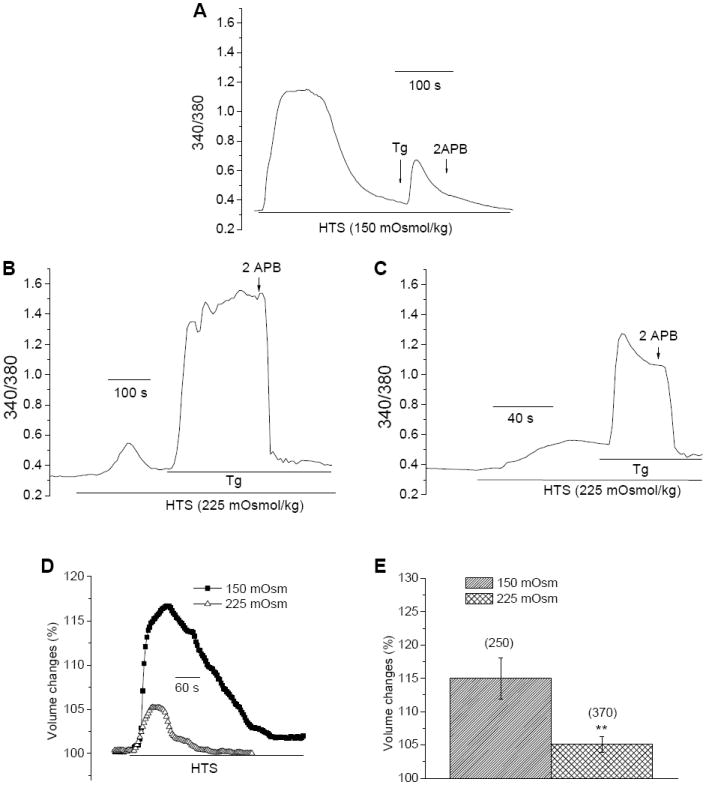
[Ca2+]i (A-C) and cell volume measurements (D) in HSG cells exposed to 150 or 225 mOsm HTS. Tg and 2-APB were added as indicated in the figure. Maximum increase in cell volume in the two conditions is plotted in (E) (number of cells are shown above the bars). ** indicates a significant difference in volume change compared to the other condition.
The data presented above reveal novel effects of cell volume increase on the ER/PM signaling mechanisms associated with SOCE. We show that cell swelling induced by exposure of cells to hypotonic condition, leads to a change in the architecture of the ER/PM junctional domains due to ER receding from the membrane during cell swelling. As a consequence, the formation of STIM1 puncta in the ER/PM junctional region is perturbed which disrupts the interaction of STIM1 with the store-operated channels, Orai1 and TRPC1. The net result is impairment in the activation of SOCE. The loss of SOCE is correlated with the extent of cell swelling and is irreversible under conditions of high hypotonic stress, despite recovery of cell volume to near resting levels. Lower levels of hypotonic stress induce less inhibition of SOCE and under these conditions, activation of SOCE recovers after cells return to their normal volume. It is interesting that the effects of HTS on SOCE are consistently seen in all the cells. Together, these data demonstrate that cells can tolerate a range of hypotonic stress. However, when hypotonic stress is high, inducing >15% increase in cell volume in HSG cells, SOCE is disrupted. The exact tolerance might vary between cell types, depending on the architecture of the cells and other factors such as the presence of water and ion channels the function of which can counteract the increase in cell volume.
In salivary and other exocrine glands cells, agonist stimulation of fluid secretion is mediated by Ca2+-dependent activation of K+ and Cl- channels. Typically agonist activation induces intracellular Ca2+ release which results in activation of SOCE which is required for maintaining a sustained increase in [Ca2+]i, an event essential for prolonged fluid secretion. Thus, under physiological conditions when SOCE is activated, these cells undergo a decrease in volume. Cells recover normal cell volume by a process called RVI. However, accumulation of electrolytes in the cytosol or changes in the osmolarity of the ambient medium can induce swelling of cells beyond their normal volume. Further, upregulation of ion transporters during agonist stimulation of cells can also result in persistent inflow of electrolytes and water for a short period of time following termination of stimulus. It is also important to note that cells such as acinar cells mediate vectorial flow of water. Thus water inflow across the basolateral membrane could induce different effects in this part of the cell compared to water secretion in the luminal region. Ductal cells are almost constantly exposed to hypotonic saliva in the lumen which during active secretion can be less that 100 mOsm [23]. As we have shown above, exposure to hypotonic conditions results in an increase in cell volume which impairs SOCE by disrupting key ER-PM interactions that are required for activation of SOCE. Our data show that cells recover their volume and SOCE when exposed to low levels of HTS. However, SOCE is not recovered following the relatively larger volume increase induced by higher levels of HTS. Indeed, high hypotonic stress can induce cell damage and cell death. Further studies are required to determine whether SOCE has a role in the survival of cells that undergo swelling and whether loss of this function contributes to the cell damage seen in pathological conditions such as ischemia or metabolic disorders which are associated with unregulated changes in cell volume.
Acknowledgments
We acknowledge NIDCR-DIR funding for ISA, and University of North Dakota and ND-EPSCoR Student fellowships awarded to BP. We would also like to thank the following for kindly giving us their DNAs: Dr. Tobias Meyer (Stanford University, CA) for the CFP- and YFP-STIM1, and Dr. Tamas Balla (NICHD, NIH, MD) for Orai1-CFP.
Footnotes
Publisher's Disclaimer: This is a PDF file of an unedited manuscript that has been accepted for publication. As a service to our customers we are providing this early version of the manuscript. The manuscript will undergo copyediting, typesetting, and review of the resulting proof before it is published in its final citable form. Please note that during the production process errors may be discovered which could affect the content, and all legal disclaimers that apply to the journal pertain.
References
- 1.Luik RM, Wang B, Prakriya M, Wu MM, Lewis RS. Oligomerization of STIM1 couples ER calcium depletion to CRAC channel activation. Nature. 2008;454:538–542. doi: 10.1038/nature07065. [DOI] [PMC free article] [PubMed] [Google Scholar]
- 2.Liou J, Fivaz M, Inoue T, Meyer T. Live-cell imaging reveals sequential oligomerization and local plasma membrane targeting of stromal interaction molecule 1 after Ca2+ store depletion. P Natl Acad Sci USA. 2007;104:9301–9306. doi: 10.1073/pnas.0702866104. [DOI] [PMC free article] [PubMed] [Google Scholar]
- 3.Roos J, DiGregorio PJ, Yeromin AV, Ohlsen K, Lioudyno M, Zhang S, Safrina O, Kozak JA, Wagner SL, Cahalan MD, Velicelebi G, Stauderman KA. STIM1, an essential and conserved component of store-operated Ca2+ channel function. J Cell Biol. 2005;169:435–445. doi: 10.1083/jcb.200502019. [DOI] [PMC free article] [PubMed] [Google Scholar]
- 4.Birnbaumer L. The TRPC class of ion channels: a critical review of their roles in slow, sustained increases in intracellular Ca(2+) concentrations. Annu Rev Pharmacol Toxicol. 2009;49:395–426. doi: 10.1146/annurev.pharmtox.48.113006.094928. [DOI] [PubMed] [Google Scholar]
- 5.Ambudkar IS, Ong HL, Liu X, Bandyopadhyay B, Cheng KT. TRPC1: the link between functionally distinct store-operated calcium channels. Cell Calcium. 2007;42:213–223. doi: 10.1016/j.ceca.2007.01.013. [DOI] [PubMed] [Google Scholar]
- 6.Yuan JP, Zeng W, Huang GN, Worley PF, Muallem S. STIM1 heteromultimerizes TRPC channels to determine their function as store-operated channels. Nat Cell Biol. 2007;9:636–645. doi: 10.1038/ncb1590. [DOI] [PMC free article] [PubMed] [Google Scholar]
- 7.Huang GN, Zeng W, Kim JY, Yuan JP, Han L, Muallem S, Worley PF. STIM1 carboxyl-terminus activates native SOC, I(crac) and TRPC1 channels. Nat Cell Biol. 2006;8:1003–1010. doi: 10.1038/ncb1454. [DOI] [PubMed] [Google Scholar]
- 8.DeHaven WI, Jones BF, Petranka JG, Smyth JT, Tomita T, Bird GS, Putney JW., Jr TRPC channels function independently of STIM1 and Orai1. J Physiol. 2009;587:2275–2298. doi: 10.1113/jphysiol.2009.170431. [DOI] [PMC free article] [PubMed] [Google Scholar]
- 9.Yuan JP, Kim MS, Zeng W, Shin DM, Huang G, Worley PF, Muallem S. TRPC channels as STIM1-regulated SOCs. Channels (Austin) 2009;3:221–225. doi: 10.4161/chan.3.4.9198. [DOI] [PubMed] [Google Scholar]
- 10.Park CY, Hoover PJ, Mullins FM, Bachhawat P, Covington ED, Raunser S, Walz T, Garcia KC, Dolmetsch RE, Lewis RS. STIM1 clusters and activates CRAC channels via direct binding of a cytosolic domain to Orai1. Cell. 2009;136:876–890. doi: 10.1016/j.cell.2009.02.014. [DOI] [PMC free article] [PubMed] [Google Scholar]
- 11.Yuan JP, Zeng W, Dorwart MR, Choi YJ, Worley PF, Muallem S. SOAR and the polybasic STIM1 domains gate and regulate Orai channels. Nat Cell Biol. 2009;11:337–343. doi: 10.1038/ncb1842. [DOI] [PMC free article] [PubMed] [Google Scholar]
- 12.Zeng W, Yuan JP, Kim MS, Choi YJ, Huang GN, Worley PF, Muallem S. STIM1 gates TRPC channels, but not Orai1, by electrostatic interaction. Mol Cell. 2008;32:439–448. doi: 10.1016/j.molcel.2008.09.020. [DOI] [PMC free article] [PubMed] [Google Scholar]
- 13.Luik RM, Wu MM, Buchanan J, Lewis RS. The elementary unit of store-operated Ca2+ entry: local activation of CRAC channels by STIM1 at ER-plasma membrane junctions. J Cell Biol. 2006;174:815–825. doi: 10.1083/jcb.200604015. [DOI] [PMC free article] [PubMed] [Google Scholar]
- 14.Pani B, Ong HL, Brazer SC, Liu X, Rauser K, Singh BB, Ambudkar IS. Activation of TRPC1 by STIM1 in ER-PM microdomains involves release of the channel from its scaffold caveolin-1. P Natl Acad Sci USA. 2009;106:20087–20092. doi: 10.1073/pnas.0905002106. [DOI] [PMC free article] [PubMed] [Google Scholar]
- 15.Pani B, Ong HL, Liu X, Rauser K, Ambudkar IS, Singh BB. Lipid Rafts Determine Clustering of STIM1 in Endoplasmic Reticulum-Plasma Membrane Junctions and Regulation of Store-operated Ca2+ Entry (SOCE) J Biol Chem. 2008;283:17333–17340. doi: 10.1074/jbc.M800107200. [DOI] [PMC free article] [PubMed] [Google Scholar]
- 16.Ercan E, Momburg F, Engel U, Temmerman K, Nickel W, Seedorf M. A conserved, lipid-mediated sorting mechanism of yeast Ist2 and mammalian STIM proteins to the peripheral ER. Traffic. 2009;10:1802–1818. doi: 10.1111/j.1600-0854.2009.00995.x. [DOI] [PubMed] [Google Scholar]
- 17.Walsh CM, Chvanov M, Haynes LP, Petersen OH, Tepikin AV, Burgoyne RD. Role of phosphoinositides in STIM1 dynamics and store-operated calcium entry. Biochem J. 2010;425:159–168. doi: 10.1042/BJ20090884. [DOI] [PMC free article] [PubMed] [Google Scholar]
- 18.Liao Y, Plummer NW, George MD, Abramowitz J, Zhu MX, Birnbaumer L. A role for Orai in TRPC-mediated Ca2+ entry suggests that a TRPC:Orai complex may mediate store and receptor operated Ca2+ entry. P Natl Acad Sci USA. 2009;106:3202–3206. doi: 10.1073/pnas.0813346106. [DOI] [PMC free article] [PubMed] [Google Scholar]
- 19.Abramowitz J, Birnbaumer L. Physiology and pathophysiology of canonical transient receptor potential channels. FASEB J. 2009;23:297–328. doi: 10.1096/fj.08-119495. [DOI] [PMC free article] [PubMed] [Google Scholar]
- 20.Ambudkar IS, Ong HL. Organization and function of TRPC channelosomes. Pflugers Arch. 2007;455:187–200. doi: 10.1007/s00424-007-0252-0. [DOI] [PubMed] [Google Scholar]
- 21.Yu F, Sun L, Machaca K. Orai1 internalization and STIM1 clustering inhibition modulate SOCE inactivation during meiosis. P Natl Acad Sci USA. 2009;106:17401–17406. doi: 10.1073/pnas.0904651106. [DOI] [PMC free article] [PubMed] [Google Scholar]
- 22.Smyth JT, Petranka JG, Boyles RR, DeHaven WI, Fukushima M, Johnson KL, Williams JG, Putney JW., Jr Phosphorylation of STIM1 underlies suppression of store-operated calcium entry during mitosis. Nat Cell Biol. 2009;11:1465–1472. doi: 10.1038/ncb1995. [DOI] [PMC free article] [PubMed] [Google Scholar]
- 23.Melvin JE, Yule D, Shuttleworth T, Begenisich T. Regulation of fluid and electrolyte secretion in salivary gland acinar cells. Annu Rev Physiol. 2005;67:445–469. doi: 10.1146/annurev.physiol.67.041703.084745. [DOI] [PubMed] [Google Scholar]
- 24.Foskett JK, Melvin JE. Activation of salivary secretion: coupling of cell volume and [Ca2+]i in single cells. Science. 1989;244:1582–1585. doi: 10.1126/science.2500708. [DOI] [PubMed] [Google Scholar]
- 25.Gresz V, Kwon TH, Hurley PT, Varga G, Zelles T, Nielsen S, Case RM, Steward MC. Identification and localization of aquaporin water channels in human salivary glands. Am J Physiol Gastrointest Liver Physiol. 2001;281:G247–254. doi: 10.1152/ajpgi.2001.281.1.G247. [DOI] [PubMed] [Google Scholar]
- 26.Ishikawa Y, Ishida H. Aquaporin water channel in salivary glands. Jpn J Pharmacol. 2000;83:95–101. doi: 10.1254/jjp.83.95. [DOI] [PubMed] [Google Scholar]
- 27.Hoffmann EK, Lambert IH, Pedersen SF. Physiology of cell volume regulation in vertebrates. Physiol Rev. 2009;89:193–277. doi: 10.1152/physrev.00037.2007. [DOI] [PubMed] [Google Scholar]
- 28.Stutzin A, Hoffmann EK. Swelling-activated ion channels: functional regulation in cell-swelling, proliferation and apoptosis. Acta Physiol (Oxf) 2006;187:27–42. doi: 10.1111/j.1748-1716.2006.01537.x. [DOI] [PubMed] [Google Scholar]
- 29.Liu X, Bandyopadhyay B, Nakamoto T, Singh B, Liedtke W, Melvin JE, Ambudkar I. A role for AQP5 in activation of TRPV4 by hypotonicity: concerted involvement of AQP5 and TRPV4 in regulation of cell volume recovery. J Biol Chem. 2006;281:15485–15495. doi: 10.1074/jbc.M600549200. [DOI] [PubMed] [Google Scholar]
- 30.Ong HL, Cheng KT, Liu X, Bandyopadhyay BC, Paria BC, Soboloff J, Pani B, Gwack Y, Srikanth S, Singh BB, Gill DL, Ambudkar IS. Dynamic assembly of TRPC1-STIM1-Orai1 ternary complex is involved in store-operated calcium influx. Evidence for similarities in store-operated and calcium release-activated calcium channel components. J Biol Chem. 2007;282:9105–9116. doi: 10.1074/jbc.M608942200. [DOI] [PMC free article] [PubMed] [Google Scholar]
- 31.Liu X, Groschner K, Ambudkar IS. Distinct Ca(2+)-permeable cation currents are activated by internal Ca(2+)-store depletion in RBL-2H3 cells and human salivary gland cells, HSG and HSY. J Membr Biol. 2004;200:93–104. doi: 10.1007/s00232-004-0698-3. [DOI] [PubMed] [Google Scholar]
- 32.Liu X, Cheng KT, Bandyopadhyay BC, Pani B, Dietrich A, Paria BC, Swaim WD, Beech D, Yildrim E, Singh BB, Birnbaumer L, Ambudkar IS. Attenuation of store-operated Ca2+ current impairs salivary gland fluid secretion in TRPC1(-/-) mice. P Natl Acad Sci USA. 2007;104:17542–17547. doi: 10.1073/pnas.0701254104. [DOI] [PMC free article] [PubMed] [Google Scholar]
- 33.Mikoshiba K. IP3 receptor/Ca2+ channel: from discovery to new signaling concepts. J Neurochem. 2007;102:1426–1446. doi: 10.1111/j.1471-4159.2007.04825.x. [DOI] [PubMed] [Google Scholar]
- 34.Rahman T, Taylor CW. Dynamic regulation of IP3 receptor clustering and activity by IP3. Channels (Austin) 2009;3:226–232. doi: 10.4161/chan.3.4.9247. [DOI] [PubMed] [Google Scholar]
- 35.Taylor CW, Taufiq Ur R, Pantazaka E. Targeting and clustering of IP3 receptors: key determinants of spatially organized Ca2+ signals. Chaos. 2009;19:037102. doi: 10.1063/1.3127593. [DOI] [PubMed] [Google Scholar]
- 36.Ambudkar IS. Regulation of calcium in salivary gland secretion. Crit Rev Oral Biol M. 2000;11:4–25. doi: 10.1177/10454411000110010301. [DOI] [PubMed] [Google Scholar]
- 37.Cahalan MD, Zhang SL, Yeromin AV, Ohlsen K, Roos J, Stauderman KA. Molecular basis of the CRAC channel. Cell Calcium. 2007;42:133–144. doi: 10.1016/j.ceca.2007.03.002. [DOI] [PMC free article] [PubMed] [Google Scholar]
- 38.Fahrner M, Muik M, Derler I, Schindl R, Fritsch R, Frischauf I, Romanin C. Mechanistic view on domains mediating STIM1-Orai coupling. Immunol Rev. 2009;231:99–112. doi: 10.1111/j.1600-065X.2009.00815.x. [DOI] [PubMed] [Google Scholar]
- 39.Navarro-Borelly L, Somasundaram A, Yamashita M, Ren D, Miller RJ, Prakriya M. STIM1-Orai1 interactions and Orai1 conformational changes revealed by live-cell FRET microscopy. J Physiol. 2008;586:5383–5401. doi: 10.1113/jphysiol.2008.162503. [DOI] [PMC free article] [PubMed] [Google Scholar]
- 40.Shitara A, Tanimura A, Sato A, Tojyo Y. Spontaneous oscillations in intracellular Ca(2+) concentration via purinergic receptors elicit transient cell swelling in rat parotid ducts. Am J Physiol Gastrointest Liver Physiol. 2009;297:G1198–1205. doi: 10.1152/ajpgi.00168.2009. [DOI] [PubMed] [Google Scholar]