

Abstract
Objectives
Biomarkers that detect pancreatic cancer at earlier stages could improve the outcome of this deadly disease.
Methods
We investigated a dozen biomarker candidates for their potential as pancreatic cancer blood biomarkers using ELISA assays.
Results
Among them, the MIF and OPN blood tests were nearly perfect in distinguishing pancreatic cancer cases from healthy controls (100% and 95% sensitivity respectively at 100% specificity). Five biomarker candidates were then tested on an expanded set of diseased controls which included sera from pancreatitis patients. The sensitivity dropped significantly for all five candidate markers.
Conclusions
Our results suggest that biomarker marker candidates could fail in various steps of biomarker development. Earlier knowledge of candidate biomarker flaws could lead to strategies to overcome the flaw, or alternatively lead to earlier termination of biomarkers that are prone to failure in the later phases of validation testing.
Keywords: Pancreatic cancer, biomarker, early detection, pancreatitis
Introduction
Pancreatic cancer is an uncommon cancer; it only accounts for 2% of all new cancer cases in the United States. However, it is the fourth leading cause of cancer deaths in the United States, and has the worst five year survival rate (1 to 4%)1; primarily because the diagnosis occurs at a late stage when the disease is inoperable and the lack of effective therapy cancers1. When pancreatic cancer is diagnosed early, e.g. when a cancer is smaller than 2 cm and at stage 1, the five year survival rate can be improved to 37%2. Therefore, biomarkers that allow detection of pancreatic cancer at an early and treatable stage provide an attractive strategy to improve the outcome of this deadly disease.
The current clinical biomarker for pancreatic cancer, CA19-9, is frequently elevated in benign conditions such as acute and chronic pancreatitis, hepatitis, or biliary obstruction3. Moreover, it is not adequate for early diagnosis due to its low sensitivity and specificity4,5. Clearly, new and better biomarkers are needed for effective early detection of pancreatic cancers.
The recent advances in technologies in genomics and proteomics have provided new tools for simultaneous global profiling of large numbers of genes or proteins when comparing two or more samples. In pancreatic cancer, we and others have focused on the comparative profiling of cancer and normal pancreas, and have identified large numbers of differentially expressed genes/proteins 6-8. The identification of gene and protein expression alterations in cancer could provide the basis for diagnostic and prognostic biomarker development9. What is needed now is to better characterize and validate these hundreds of biomarker candidates and develop them into clinically useful tests.
While many candidates are discovered, few cancer biomarkers are clinically useable. Biomarker development is extremely costly, and many markers fail during the validation stages. It is crucial with candidate markers to provide in-depth characterization of a candidate, also known as pre-validation, to determine whether the candidate should move forward to clinical sample-sets in later phase trials. Pepe et al10 describe the candidate characterization as part of the biomarker discovery and integral to the development of clinically relevant markers. To address this issue, in this study, we investigated 12 biomarker candidates that were previously identified in pancreatic cancer tissue or pancreatic cancer juice with proteomic studies and/or expression array analysis, for their potential as blood biomarkers for pancreatic cancer. Our goal was to evaluate these candidates in a pre-validation pilot study and select the best performing candidates for future validation in phase 2 and 3 studies. ELISA tests of these 12 biomarker candidates were characterized against two samples sets: the first filtration set was performed on blood samples of pancreatic cancer and normal healthy controls. Candidates that survived the first filtration set were then tested against an expanded sample set that includes acute pancreatitis and chronic pancreatitis controls. Statistical analysis was used to determine the best biomarker candidates that are worthy of further validation.
Materials and methods
Serum samples
Serum samples were obtained with Human Subject's approval and patient consent. Patients with pancreatic cancer or pancreatitis were identified in the gastroendoscopy and surgical clinics at the University of Washington and Northwestern University Medical Centers. The diagnosis of disease was made histologically or by imaging in combination with supporting laboratory values for the pancreatic cancer and pancreatitis patients. For these pre-validation studies, convenience samples were used: e.g. samples were anonymous and, outside of the clinical diagnosis, without annotation. All the pancreatic cancer cases were operable; hence, they represented a mixture of localized pancreatic cancer (stages 2 and 3A). In general, samples were obtained in red top tubes (clot activator and silicone coated interior from Becton Dickinson) and processed within 4 hours using a uniform protocol. Once processed the serum was stored at -80°C, and no more than 2 freeze thaw cycles were allowed for a specimen used in the ELISA studies. The healthy controls were purchased from Innovative Research (Southfield, MI).
Initially, the ELISA tests were performed only on serum from pancreatic cancer cases and healthy controls (the first filter set). If a biomarker candidate ELISA could statistically separate cancer from the controls, then the biomarker candidate ELISA was tested on an expanded independent group of diseased and healthy controls (the second filter set). A minimum of 15 cases and 5 normal controls were used for the first filter set (average 32 cases and 14 healthy controls per ELISA). These numbers were expanded for the second filter set to include more diseased and healthy controls (average =36 total controls per ELISA). ELISA tests for each of the 12 biomarkers were acquired over time as they became commercially available; therefore the ELISA tests were not performed in parallel, but rather sequentially. The number of cases and controls varied per ELISA test; because as the serum specimens were depleted over time, new specimens had to be used. Testing of the samples by ELISA was performed in duplicate and in a blinded fashion (samples were coded).
ELISA
ELISA kits were obtained commercially as outlined in Table 1. The tests were performed according to manufacture protocols. Samples were tested in duplicate; mean values were used for subsequent analysis.
Table 1.
Selection of biomarker candidates for pilot study.
| Protein name | Gene Symbol | Method the candidate was Identified | ELISA source | city state | Reference (PMID) |
|---|---|---|---|---|---|
| S100A4 | S100A4 | Proteomics, multiple database matches | Circulex | Woburn, MA | 16230073, 14695172 |
| Galectin 3 | LGALS3 | Proteomics, multiple database matches | EMD Bioscience | San Diego, CA | 16230073, 16865675, 15526344, 15924292 |
| Annexin A5 | ANXA5 | Proteomics, multiple database matches | Bender Medsystems | Burlingame, CA | 16230073, 16215274, 15604267 |
| Lipocalin 2 | LCN2 | Multiple database matches | R&D Systems | Minneapolis, MN | 16299235, 11943709, 15958547 |
| Matrix metalloproteinase 7 | MMP7 | Proteomics, multiple database matches | R&D Systems | Minneapolis, MN | 14695172, 11943709, 16285947 |
| Osteopontin | OPN | Multiple database matches | R&D Systems | Minneapolis, MN | 16299235, 11943709, 14767473, 15753353 |
| Insulin-like growth factor binding protein 2 | IGFBP2 | Proteomics, multiple database matches | ALPCO | Salem, NH | 14767473, 16739137 |
| Macrophage migration inhibitory factor | MIF | Proteomics | R&D Systems | Minneapolis, MN | 17496331 |
| Thrombospondin 2 | THBS2 | Proteomics, multiple database matches | R&D Systems | Minneapolis, MN | 16230073, 14695172, 11943709, 16285947, 14767473 |
| Carcinoembryonic antigen-related cell adhesion molecule 5 | CEACAM5 | Proteomics, multiple database matches | BioQuant | San Diego, CA | 14695172, 15924292, 12750293, 16815451 |
| A Disintegrin and Metalloproteinase Domain 8 | ADAM8 | database muliple matches | R&D Systems | Minneapolis, MN | 15958547, 14767473, 12750293 |
| Syndecan 1 | SDC1 | Proteomics, multiple database matches | Diaclone | Stamford, CT | 16215274, 16299235, 15958547 |
Statistical Methods
In order to enable comparison of markers that are measured on different scales, we first transformed all markers (e.g., by their logs) so that the values in the control group appeared normally distributed, and re-scaled so that the healthy controls had a mean of zero and a variance of one11,12. Standardization of the markers does not affect the ROC curves for individual markers but facilitates the comparison of markers because of the uniformity of units of measurement (i.e. the number of standard deviations above the average healthy subject)11. Welch's t-tests were used to determine which markers demonstrated significant differences between mean serum marker levels in pancreatic cancer, healthy controls and pancreatitis controls. Receiver operating characteristic (ROC) curve methods were used to quantify marker performance in distinguishing cancer cases from controls13.
As noted above, two filter sets of serum were used to assess the candidate biomarkers. The first filter set eliminated candidates that were unable to distinguish normal healthy controls from pancreatic cancer using a t-test. Individual markers were ranked by their sensitivity at the highest specificity (100% and 95%) in comparing cancer cases to healthy controls. These specificity levels were chosen because the low prevalence of pancreatic cancer requires that a screening test have very high specificity in order to keep the false positive results at a reasonable level. Candidate biomarkers that could distinguish cancer from healthy controls were then evaluated a second time using an expanded control set that included acute pancreatitis, chronic pancreatitis and additional healthy controls using both a t-test and ranking by sensitivity at high specificity (100% and 95%). We combined markers using approaches that did not require statistical fitting because of the low sample sizes. The assessment of biomarker combinations was only ascertained on a uniform (exact) set of cases and controls shared by multiple ELISA tests. To combine markers, we restricted attention to combination rules in which elevation of any marker above its respective threshold constitutes a positive result (e.g., an “or” rule). Because all markers were on the same scale, this “or” rule was implemented by using the maximum score of the individual markers in the combined set as previously described14. Combination markers were evaluated by the estimated sensitivity at 95% specificity.
Results
Selections of candidates for pilot study
In light of the rich source of published data concerning differentially expressed proteins/genes in pancreatic cancer, we have compiled a comprehensive database representing differentially expressed proteins in pancreatic cancer identified by expression array and proteomics in more than 40 studies including our own proteomic and expression microarray data6,7,15. Almost 400 of these differentially expressed proteins/genes were reported by at least 2 studies. Because validation could be an expensive and long process, we first prioritized these biomarker candidates for validation. Candidates for ELISA testing were prioritized based on: 1) targets with the highest abnormal expression level in cancer compared to non-cancer; 2) specificity of the target for cancer and absence in normal tissues throughout the body; 3) number of times that a target was identified in independent pancreatic cancer studies; 4) biologic role of the target; and 5) availability of ELISA tests for the target. These criteria helped to select the initial targets we report here.
The most critical rate limiting step in the biomarker development process is the assay development for measuring the biomarker in the blood. Despite the recent introduction of several novel and promising approaches for alternative methods of measuring biomarkers in the blood, the current gold standard for a blood-based assay is the ELISA. However, ELISA development for each target protein takes about 12 months to create. While we are currently developing new ELISA assays and other mass spectrometry based assays for several biomarker candidates, the top 12 prioritized biomarker candidates for which commercial ELISA kits were available were listed in Table 1.
For these 12 candidates, we first checked if they had been evaluated in previous studies. Indeed, 4 of the 12 candidates had been previously tested for pancreatic cancer biomarker, including OPN (osteopontin)16, CEACAM5 (carcinoembryonic antigen-related cell adhesion molecule 5)17, MMP 7 (matrix metalloproteinase 7)18, and LCN 2 (lipocalin 2)19. These 4 candidates were included in our study for re-evaluation as individual markers, as well as their performance in a composite biomarker panel, which had not been previously performed.
Chronic pancreatitis mimics many aspects of pancreatic cancer, and thus could be a major contributing factor causing false-positive for pancreatic cancer marker. We first evaluated the expression of the candidates in chronic pancreatitis tissue either by immunohistochemistry or proteomics analysis. Our previous work using quantitative proteomics to profile pancreatic cancer, chronic pancreatitis, and normal pancreas tissues revealed that 5 of the candidates (S100A4, galectin 3, Annexin A5, insulin-like growth factor binding protein 2 and macrophage migration inhibitory factor) showed no or low degree of over-expression in chronic pancreatitis; however, their over-expression in pancreatic cancer were even more profound (Table 2)20. Lipocalin 219, MMP718, osteopontin21, CEACAM522 and syndecan 123 also displayed higher expression in pancreatic cancer than chronic pancreatitis (Table 2).
Table 2.
Expression of the candidate biomarkers in pancreatic cancer and chronic pancreatitis.
| Protein name | Gene Symbol | fold-change | method | Reference (PMID) | ||
|---|---|---|---|---|---|---|
| normal pancreas | chronic pancreatitis | pancreatic cancer | ||||
| S100A4 | S100A4 | 1 | 3.1 | 10 | proteomics# | * |
| Galectin 3 | LGALS3 | 1 | 1.5 | 20 | proteomics# | * |
| Annexin A5 | ANXA5 | 1 | 1.5 | 6.5 | proteomics# | * |
| Lipocalin 2 | LCN2 | 1 | 1 | 4.3 | IHC | 18392050 |
| Matrix metalloproteinase 7 | MMP7 | negative -weak | negative-moderate | highly positive | IHC | 17507610 |
| Osteopontin | OPN | 1 | 1.6 | 2.2 | DNA microarray | 15970685 |
| Insulin-like growth factor binding protein 2 | IGFBP2 | 1 | 0.9 | 4.6 | proteomics# | 17496331 |
| Macrophage migration inhibitory factor | MIF | 1 | 1 | 1.7 | proteomics# | * |
| Thrombospondin 2 | THBS2 | no expression | enhanced expression | enhanced expression | IHC | 15502640 |
| Carcinoembryonic antigen-related cell adhesion molecule 5 | CEACAM5 | 1 | 6.7 | 52.4 | DNA microarray | 12861384 |
| A Disintegrin and Metalloproteinase Domain 8 | ADAM8 | 1 | 1 | 4 | DNA microarray | 12750293 |
| Syndecan 1 | SDC1 | moderate | weak | over-expression | IHC | 15886501 |
stable-isotope labeling and LC MS/MS based proteomics methods
unpublished data
Evaluation of individual candidates
This pilot study was carried out to evaluate the tissue-based targets as potential biomarkers worthy of future validation; therefore for this pre-validation characterization we used a limited number of cases and control for our analysis. Our strategy was as following: 1) the first filter set is designed to eliminate the candidates that do not exhibit significant differences between the cases (pancreatic cancer) and healthy controls; 2) the second filter set: identifies the candidates that do not show significant differences between cases and expanded controls (including healthy and pancreatitis controls); 3) lastly, use of ROC analysis to assess the sensitivity and specificity of the candidates that pass the filtering from first two steps. By using two filters we have a better understanding of candidate biomarker performance and, specifically, at what point a candidate biomarker fails; it is possible that candidate proteins that can distinguish pancreatic cancer from normal healthy controls but not from pancreatitis controls is still of some value if it was combined with a panel of biomarkers or, alternatively, with a pancreatitis-specific biomarker.
First Filter Set: comparison of candidate biomarker performance in pancreatic cancer cases and normal healthy controls
Of the 12 candidates tested in blood, annexin A5 and galectin 3 were undetectable in most of the sera, while all of the other 10 candidates yielded sufficient detection signals. Thus, annexin A5 and galectin 3 were eliminated from further ELISA analysis at this time. As shown in Table 3, five of the candidates were significantly different between the pancreatic cancer cases and healthy controls (Welch's t-test; p≤ 0.02), including MIF (macrophage migration inhibitory factor), OPN, MMP7, LCN2, and THBS2 (thrombospondin 2). Among these, LCN2 was significantly reduced in the sera of cancer cases compared to healthy controls, whereas the other four candidates (MIF, OPN, MMP7 and THBS2) were significantly increased in the sera of cancer cases compared to healthy controls. The serum values of ADAM8 (A Disintegrin and Metalloproteinase Domain 8), IGFBP2 (insulin-like growth factor binding protein 2), CEACAM5 and SDC1 were increased in cancer cases compared to healthy controls, but these changes were not statistically significant. The remaining candidate, S100A4 was decreased in the sera of cancer cases, but again did not reach statistical significance. Thus after the first filtering step, 5 biomarker candidates remained (MIF, OPN, MMP7, LCN2, and THBS2) and passed through to the second filtering step, and the other 5 candidates were eliminated from further study.
Table 3.
Single biomarker ELISA values (normalized to mean and standard deviation of healthy controls).
| Marker | Healthy controls* | Pancreatitis | All controls (including healthy and pancreatitis) | Pancreatic cancer | p value | ||||
|---|---|---|---|---|---|---|---|---|---|
|
| |||||||||
| No. of controls | No. of pancreatitis controls | Mean ± SEM | No. of controls | Mean ± SEM | No. of cases | Mean ± SEM | cancer vs healthy controls | cancer vs all controls | |
|
| |||||||||
| MIF | 16 | 26 | 9.19 ± 0.54 | 42 | 5.69 ± 0.78 | 17 | 10.62 ± 0.43 | <0.0001 | <0.0001 |
| MMP7 | 9 | 30 | 1.34 ± 0.23 | 39 | 1.03 ± 0.21 | 66 | 2.56 ± 0.19 | <0.0001 | <0.0001 |
| THBS2 | 36 | 24 | 0.44 ± 0.3 | 60 | 0.18 ± 0.16 | 37 | 1.01 ± 0.19 | 0.0002 | 0.0012 |
| OPN | 5 | 20 | 1.45 ± 0.18 | 25 | 1.16 ± 0.2 | 20 | 1.98 ± 0.1 | 0.0100 | 0.0010 |
| LCN2 | 5 | 19 | 0.37 ± 0.36 | 24 | 0.29 ± 0.3 | 20 | 1.73 ± 0.38 | 0.0134 | 0.0047 |
|
| |||||||||
| ADAM8 | 9 | 22 | 0.73 ± 0.37 | 31 | 0.52 ± 0.29 | 37 | 0.74 ± 0.22 | 0.0826 | 0.5338 |
| CEACAM | 5 | 20 | 0.26 ± 0.24 | 25 | 0.2 ± 0.21 | 20 | 0.81 ± 0.23 | 0.1574 | 0.0581 |
| IGFBP2 | 5 | 20 | 0.48 ± 0.14 | 25 | 0.38 ± 0.14 | 15 | 0.72 ± 0.12 | 0.1848 | 0.0788 |
| S100A4 | 23 | 9 | -0.63 ± 0.3 | 32 | -0.18 ± 0.18 | 24 | -0.07 ± 0.18 | 0.8079 | 0.6659 |
| SDC1 | 29 | 30 | -0.14 ± 0.42 | 59 | -0.07 ± 0.23 | 65 | 0.02 ± 0.24 | 0.9516 | 0.7843 |
SEM: standard error of the mean.
Healthy controls all have a mean normalized value=1.00 because all the ELISA values were normalized against the healthy controls.
Second Filter Set: comparison of candidate biomarkers in pancreatic cancer cases and expanded controls (including normal and pancreatitis controls)
Because pancreatitis is a frequent false positive factor for pancreatic cancer, sera from acute and chronic pancreatitis patients were also tested and used as a disease control. When the samples from acute pancreatitis, chronic pancreatitis and healthy controls were combined as a single control group, the 5 candidates that passed through the first filtering step still demonstrated statistically significant differences in the mean serum level of cancer cases compared to the all controls, although overall performance dropped markedly (Table 3).
ROC evaluation
We then used ROC to determine the sensitivity and specificity of the 5 candidates that exhibited significant differences between the sera of pancreatic cancer and all controls. When only healthy controls were used in the ROC analysis, all 5 candidates achieved good AUC values (≥0.80, Table 4). Among them, MIF had a perfect AUC (=1.0); OPN, and MMP7 had almost perfect AUC values (=0.99, and 0.92 respectively). Because the prevalence of pancreatic cancer is low (approximately 1 in every 10,000 people), a screening biomarker needs to have a high specificity, thus we performed the analysis at 95% and at 100% specificity. At 95% specificity, MIF and OPN reached 95% or above sensitivity (Figure 1 for MIF) when compared to healthy controls. At 95% specificity, the sensitivities for MMP7, LCN2 and THBS2 ranged from 48% to 77% (Figure 2 for MMP7). When all controls (including healthy controls and pancreatitis) were used in the ROC analysis, the performance of these 5 candidates greatly dropped. The AUC for the 5 candidates was between 0.73 and 0.78 (Table 4). At 95% specificity, the highest sensitivity was 26% by MMP7, the second highest sensitivity was 22% by THBS2. The sensitivities at 95% specificity for other 3 candidates were between 20% and 6%.
Table 4.
Single marker ROC analysis.
| ALL CANCER CASES VS. NORMAL CONTROLS | |||||
|---|---|---|---|---|---|
|
| |||||
| Marker | AUC | Sensa. at 100% Specb. | Sens. at 95% Spec. | Spec. at 100% Sens. | Spec. at 95% Sens. |
| MIF | 1.00 | 100 | 100 | 100 | 100 |
| OPN | 0.99 | 95 | 95 | 80 | 100 |
| MMP7 | 0.92 | 77 | 77 | 0 | 44 |
| LCN2 | 0.85 | 65 | 65 | 0 | 60 |
| THBS2 | 0.80 | 43 | 49 | 0 | 6 |
| ALL CANCER CASES VS. ALL CONTROLS (INCLUDING PANCREATITIS AND HEALTHY CONTROLS) | |||||
|
| |||||
| Marker | AUC | Sens. at 100% Spec. | Sens. at 95% Spec. | Spec. at 100% Sens. | Spec. at 95% Sens. |
|
| |||||
| MIF | 0.78 | 0 | 6 | 57 | 57 |
| MMP7 | 0.78 | 15 | 26 | 0 | 18 |
| OPN | 0.76 | 0 | 10 | 28 | 56 |
| LCN2 | 0.75 | 15 | 20 | 13 | 46 |
| THBS2 | 0.73 | 8 | 22 | 0 | 7 |
Sens=sensitivity
Spec=specificity
Figure 1.
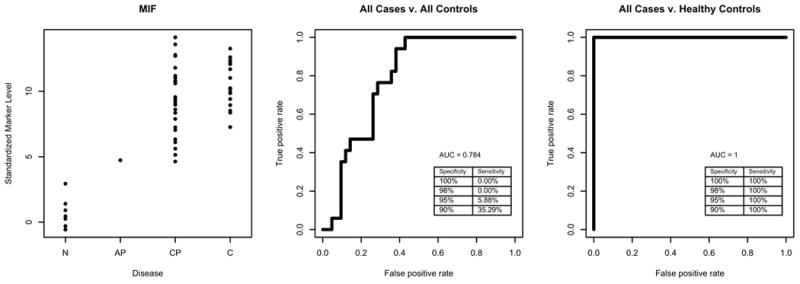
ROC analysis of MIF. Left panels is plot of standardized values for each sample groups; the middle panel is ROC with all controls, and the right panel is ROC with healthy control.
Figure 2.
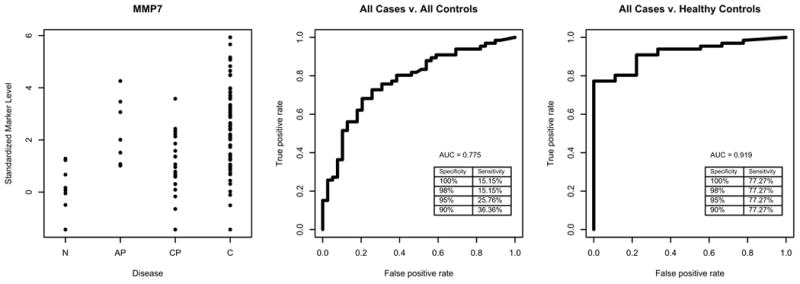
ROC analysis of MMP7. Left panels is plot of standardized values for each sample groups; the middle panel is ROC with all controls, and the right panel is ROC with healthy control.
Evaluation of biomarker combinations
To determine whether we could improve the AUC, we next tested the candidate biomarkers as possible combinations of 2, 3, or 4 biomarkers as panels. The numbers of normal controls listed in Table 5 is low because for composite biomarker analysis only the serum samples that were uniformly tested on every candidate could be included in the analysis. The MIF biomarker candidate was not included in the panel evaluation because it was tested on pancreatitis controls that did not overlap with the pancreatitis controls used for other markers. The panel combinations of OPN, MMP7, THBS2, and/or LCN2 did not improve the AUC, specificity, or sensitivity over the best single marker performance (Table 5).
Table 5.
Combination marker ROC analysis.
| ALL CANCER CASES VS. NORMAL CONTROLS | |||||||
|---|---|---|---|---|---|---|---|
|
| |||||||
| Marker | AUC | No. Cases | No. Controls | Sensa. at 100% Specb. | Sens. at 95% Spec. | Spec. at 100% Sens. | Spec. at 95% Sens. |
| OPN | 0.99 | 20 | 5 | 95 | 95 | 80 | 100 |
| MMP7+OPN | 0.98 | 20 | 5 | 95 | 95 | 60 | 100 |
| MMP7+THBS2 | 0.95 | 20 | 5 | 95 | 95 | 0 | 100 |
| OPN+THBS2 | 0.98 | 20 | 5 | 95 | 95 | 60 | 100 |
| LIPOCALIN+MMP7+OPN | 0.97 | 20 | 5 | 95 | 95 | 40 | 100 |
| LIPOCALIN+MMP7+THBS2 | 0.95 | 20 | 5 | 95 | 95 | 0 | 100 |
| MMP7+OPN+THBS2 | 0.97 | 20 | 5 | 95 | 95 | 40 | 100 |
| LIPOCALIN+MMP7+OPN+THBS2 | 0.96 | 20 | 5 | 95 | 95 | 20 | 100 |
| ALL CANCER CASES VS. ALL CONT ROLS (INCLUDING PANCREATITIS AND HEALTHY CONTROLS) | |||||||
|
| |||||||
| Marker | AUC | No. Cases | No. Controls | Sens. at 100% Spec. | Sens. at 95% Spec. | Spec. at 100% Sens. | Spec. at 95% Sens. |
|
| |||||||
| MMP7 | 0.72 | 20 | 24 | 10 | 25 | 13 | 17 |
| LIPOCALIN+MMP7 | 0.71 | 20 | 24 | 10 | 25 | 8 | 13 |
| MMP7+OPN | 0.74 | 20 | 24 | 10 | 25 | 17 | 38 |
| MMP7+THBS2 | 0.73 | 20 | 24 | 10 | 25 | 0 | 46 |
| LIPOCALIN+MMP7+OPN | 0.73 | 20 | 24 | 10 | 25 | 13 | 38 |
| LIPOCALIN+MMP7+THBS2 | 0.73 | 20 | 24 | 10 | 25 | 0 | 46 |
| MMP7+OPN+THBS2 | 0.73 | 20 | 24 | 10 | 25 | 13 | 38 |
| LIPOCALIN+MMP7+OPN+THBS2 | 0.73 | 20 | 24 | 10 | 25 | 8 | 38 |
Sens=sensitivity
Spec=specificity
Discussion
In this biomarker development study, we investigated 12 biomarker candidates that were previously identified in pancreatic cancer tissue or juice by proteomics and/or expression array analysis for their potential as blood biomarkers for pancreatic cancer. Among these 12 candidates, two candidates (LGALS3 and ANXA5) were not detectable in the serum, and five (S100A4, ADAM8, CEACAM, IGFBP2 and SDC1) did not demonstrate statistically significant differences between the sera from pancreatic cancer cases and healthy controls. The remaining five candidates, MIF, OPN, MMP7, LCN2, and THBS2, were selected for further evaluation for potential biomarker development by assessing performance on an expanded control sets that included pancreatitis patients. The MIF and OPN blood tests were nearly perfect in distinguishing pancreatic cancer cases from healthy controls (100% and 95% sensitivity respectively at 100% specificity). The sensitivity of MMP7, LCN and THBS2 ranged from 77-43% at 100% specificity. However, when acute and chronic pancreatitis groups were also included as controls, the sensitivity dropped significantly for all candidate markers; the best performing markers in this setting were MMP7 and LCN which had a sensitivity of to 25% and 20%, respectively, at 95% specificity. A combination of markers could not improve the performance over any given single marker. It is noted that many proteins have multiple isoforms, and existing ELISA assay may not detect the specific isoform relevant to cancer. However, we believe that the results from our study will provide useful information to the researchers in the field.
These data suggest a number of things: 1) that proteins discovered from pancreatic cancer tissues can be detected in blood and could potentially be useful for biomarkers of disease; 2) that biomarker performance is influenced by the inclusion of diseased controls, such as the pancreatitis controls; 3) biomarker candidates fail for a variety of different reasons. Some are too low in abundance to be detected in the blood; some can not accurately distinguish cancer from healthy controls, and some lack specificity in the setting of acute and chronic inflammation of the pancreas. It is likely that cancer biomarker development, in general, will suffer from similar problems. However, some of these problems are surmountable. It is possible to enrich for proteins that are too low in abundance to be measured by direct ELISA. Enrichment can include sub-proteome extraction, such as the glycoproteome, prior to ELISA testing of plasma, as many blood based biomarkers are glycoproteins. Enrichment can also include direct protein identification through mass spectroscopy techniques that can be combined with or without directed antibody capturing24. For the issue of false positive results arising in the setting of acute and chronic inflammation, it is possible to more thoroughly examine the pancreatitis proteome and exclude protein candidates that cross reference between cancer and pancreatitis. Another tactic would be to develop biomarkers that are specific for chronic pancreatitis (lipase and pancreatic amylase already exist for acute pancreatitis). Patients who had a positive cancer biomarker could have reflexive sequential testing to detect pancreatitis. This strategy would provide the advantage of correctly detecting 2 diseases.
CA19-9 is the current clinical biomarker used for pancreatic cancer detection in suspected patients and for therapeutic response; however it is not used for screening. CA19-9 has a median sensitivity of 79% (range 70-90%) and median specificity of 82% (range 68-91%)25. One study showed that in the AUC of CA19-9 was 0.71 in distinguishing pancreatic cancer cases from normal and benign pancreas disease controls26. In our study, each of the five biomarker candidates (MIF, OPN, MMP7, LCN2, and THBS2) had AUC values slightly higher than CA19-9 (between 0.73 and 0.78).
In summary, we have characterized 12 pancreatic cancer biomarker candidates and found high performance of 5 candidates when tested against cases and healthy controls. All of these candidate biomarkers had a dramatic drop in performance when diseased controls were included. By understanding the flaws in an individual biomarker candidate, it is possible to design strategies to improve its performance. For example, a flawed biomarker can be improved by designing a companion marker, such as a specific chronic pancreatitis biomarker, that could improve the overall performance when used as in composite or reflexive testing. Moreover, by discovering these flaws in the early phase of biomarker development, we prevent the costly run of candidates through more extensive validation phases of development. This in turn shortens the time to failure for those candidates that should be eliminated, and reserves valuable validation samples for those candidates that have been characterized and appropriately optimized. Lastly, the shortfall in our top candidates points to the need to include protein and expression data from non-cancerous but diseased organs (in this case pancreatitis) in the early stages of cancer biomarker development and prioritization. Our dataset did include some proteomic data on chronic pancreatitis; however this dataset was limited and could be further expanded. We believe that careful characterization of biomarker candidates, as part of the development phase, will lead to fewer biomarker failures in later validation stages-- where significant time and resource will be invested.
Acknowledgments
Special thanks to Chana Palmer and Patrick Brown for assistance in the prioritization of proteins, and Richard H. Bell Jr. for providing assistance with specimen collection at Northwestern Hospital.
Funding sources: This work was supported by NIH R01CA107209 and NIH K07CA116296. Additional funding came from the Canary Foundation, Gene and Mary Ann Walters Pancreatic Cancer Foundation, the AACR-PanCAN Career Development Award for Pancreatic Cancer Research.
Contributor Information
Ru Chen, GI Division/Department of Medicine, University of Washington, Seattle.
David Crispin, GI Division/Department of Medicine, University of Washington, Seattle.
Sheng Pan, Department of Pathology, University of Washington, Seattle.
Sarah Hawley, Canary Foundation, Palo Alto, CA.
Martin W. McIntosh, Fred Hutchinson Cancer Research Center, Seattle.
Damon May, Fred Hutchinson Cancer Research Center, Seattle.
Hoda Anton-Culver, Department of Epidemiology, University of California, Irvine, CA.
Argyrios Ziogas, Department of Epidemiology, University of California, Irvine, CA.
Mary P. Bronner, Department of Anatomic Pathology, Cleveland Clinic Foundation, Cleveland, OH.
Teresa A. Brentnall, GI Division/Department of Medicine, University of Washington, Seattle.
References
- 1.Jemal A, Siegel R, Ward E, et al. Cancer statistics, 2006. CA Cancer J Clin. 2006;56:106–130. doi: 10.3322/canjclin.56.2.106. [DOI] [PubMed] [Google Scholar]
- 2.Tsuchiya R, Noda T, Harada N, et al. Collective review of small carcinomas of the pancreas. Ann Surg. 1986;203:77–81. doi: 10.1097/00000658-198601000-00013. [DOI] [PMC free article] [PubMed] [Google Scholar]
- 3.Steinberg W. The clinical utility of the CA 19-9 tumor-associated antigen. Am J Gastroenterol. 1990;85:350–355. [PubMed] [Google Scholar]
- 4.Grote T, Logsdon CD. Progress on molecular markers of pancreatic cancer. Curr Opin Gastroenterol. 2007;23:508–514. doi: 10.1097/MOG.0b013e3282ba5724. [DOI] [PubMed] [Google Scholar]
- 5.Misek DE, Patwa TH, Lubman DM, et al. Early detection and biomarkers in pancreatic cancer. J Natl Compr Canc Netw. 2007;5:1034–1041. doi: 10.6004/jnccn.2007.0086. [DOI] [PubMed] [Google Scholar]
- 6.Chen R, Pan S, Brentnall TA, et al. Proteomic profiling of pancreatic cancer for biomarker discovery. Mol Cell Proteomics. 2005;4:523–533. doi: 10.1074/mcp.R500004-MCP200. [DOI] [PubMed] [Google Scholar]
- 7.Chen R, Pan S, Crispin DA, et al. Gene expression and proteomic analysis of pancreatic cancer: a recent update. Cancer Genomics and Proteomics. 2006;3:1–10. [PubMed] [Google Scholar]
- 8.Harsha HC, Kandasamy K, Ranganathan P, et al. A compendium of potential biomarkers of pancreatic cancer. PLoS Med. 2009;6:e1000046. doi: 10.1371/journal.pmed.1000046. [DOI] [PMC free article] [PubMed] [Google Scholar]
- 9.Rai AJ, Chan DW. Cancer proteomics: Serum diagnostics for tumor marker discovery. Ann N Y Acad Sci. 2004;1022:286–294. doi: 10.1196/annals.1318.044. [DOI] [PubMed] [Google Scholar]
- 10.Pepe MS, Etzioni R, Feng Z, et al. Phases of biomarker development for early detection of cancer. J Natl Cancer Inst. 2001;93:1054–1061. doi: 10.1093/jnci/93.14.1054. [DOI] [PubMed] [Google Scholar]
- 11.McIntosh MW, Drescher C, Karlan B, et al. Combining CA 125 and SMR serum markers for diagnosis and early detection of ovarian carcinoma. Gynecol Oncol. 2004;95:9–15. doi: 10.1016/j.ygyno.2004.07.039. [DOI] [PMC free article] [PubMed] [Google Scholar]
- 12.Pepe MS, Longton G. Standardizing diagnostic markers to evaluate and compare their performance. Epidemiology. 2005;16:598–603. doi: 10.1097/01.ede.0000173041.03470.8b. [DOI] [PubMed] [Google Scholar]
- 13.Pepe MS. The Statistical Evaluation of Medical Tests for Classification and Prediction. Oxford, UK: Oxford University Press; 2003. [Google Scholar]
- 14.Palmer C, Duan X, Hawley S, et al. Systematic evaluation of candidate blood markers for detecting ovarian cancer. PLoS ONE. 2008;3:e2633. doi: 10.1371/journal.pone.0002633. [DOI] [PMC free article] [PubMed] [Google Scholar]
- 15.Chen R, Pan S, Aebersold R, et al. Proteomics studies of pancreatic cancer. Proteomics Clin Appl. 2007;1:1582–1591. doi: 10.1002/prca.200700414. [DOI] [PMC free article] [PubMed] [Google Scholar]
- 16.Koopmann J, Fedarko NS, Jain A, et al. Evaluation of osteopontin as biomarker for pancreatic adenocarcinoma. Cancer Epidemiol Biomarkers Prev. 2004;13:487–491. [PubMed] [Google Scholar]
- 17.Ozkan H, Kaya M, Cengiz A. Comparison of tumor marker CA 242 with CA 19-9 and carcinoembryonic antigen (CEA) in pancreatic cancer. Hepatogastroenterology. 2003;50:1669–1674. [PubMed] [Google Scholar]
- 18.Kuhlmann KF, van Till JW, Boermeester MA, et al. Evaluation of matrix metalloproteinase 7 in plasma and pancreatic juice as a biomarker for pancreatic cancer. Cancer Epidemiol Biomarkers Prev. 2007;16:886–891. doi: 10.1158/1055-9965.EPI-06-0779. [DOI] [PMC free article] [PubMed] [Google Scholar]
- 19.Moniaux N, Chakraborty S, Yalniz M, et al. Early diagnosis of pancreatic cancer: neutrophil gelatinase-associated lipocalin as a marker of pancreatic intraepithelial neoplasia. Br J Cancer. 2008;98:1540–1547. doi: 10.1038/sj.bjc.6604329. [DOI] [PMC free article] [PubMed] [Google Scholar]
- 20.Chen R, Brentnall TA, Pan S, et al. Quantitative Proteomics Analysis Reveals That Proteins Differentially Expressed in Chronic Pancreatitis Are Also Frequently Involved in Pancreatic Cancer. Mol Cell Proteomics. 2007;6:1331–1342. doi: 10.1074/mcp.M700072-MCP200. [DOI] [PubMed] [Google Scholar]
- 21.Kolb A, Kleeff J, Guweidhi A, et al. Osteopontin influences the invasiveness of pancreatic cancer cells and is increased in neoplastic and inflammatory conditions. Cancer Biol Ther. 2005;4:740–746. doi: 10.4161/cbt.4.7.1821. [DOI] [PubMed] [Google Scholar]
- 22.Friess H, Ding J, Kleeff J, et al. Microarray-based identification of differentially expressed growth- and metastasis-associated genes in pancreatic cancer. Cell Mol Life Sci. 2003;60:1180–1199. doi: 10.1007/s00018-003-3036-5. [DOI] [PMC free article] [PubMed] [Google Scholar]
- 23.Juuti A, Nordling S, Lundin J, et al. Syndecan-1 expression--a novel prognostic marker in pancreatic cancer. Oncology. 2005;68:97–106. doi: 10.1159/000085702. [DOI] [PubMed] [Google Scholar]
- 24.Pan S, Aebersold R, Chen R, et al. Mass spectrometry based targeted protein quantification: methods and applications. J Proteome Res. 2009;8:787–797. doi: 10.1021/pr800538n. [DOI] [PMC free article] [PubMed] [Google Scholar]
- 25.Goonetilleke KS, Siriwardena AK. Systematic review of carbohydrate antigen (CA 19-9) as a biochemical marker in the diagnosis of pancreatic cancer. Eur J Surg Oncol. 2007;33:266–270. doi: 10.1016/j.ejso.2006.10.004. [DOI] [PubMed] [Google Scholar]
- 26.Sandblom G, Granroth S, Rasmussen IC. TPS, CA 19-9, VEGF-A, and CEA as diagnostic and prognostic factors in patients with mass lesions in the pancreatic head. Ups J Med Sci. 2008;113:57–64. doi: 10.3109/2000-1967-214. [DOI] [PubMed] [Google Scholar]