

Significance
Pancreatic neuroendocrine tumors (PanNETs) are a rare pathology, and molecular mechanisms underlying their development have not been well defined. This article shows that a two-hit inactivation of the PHLDA3 gene is required for PanNET development: methylation of the locus and loss of heterozygosity. PHLDA3 functions as a suppressor of PanNETs via repression of Akt activity and downstream Akt-regulated biological processes. In addition, the tumor-suppressing pathway mediated by MEN1, a well known suppressor of PanNETs, is dependent on the pathway mediated by PHLDA3, and inactivation of PHLDA3 and MEN1 cooperatively contribute to PanNET development. A novel PHLDA3-mediated pathway of tumor suppression that is important in the development of PanNETs is demonstrated, and the findings may contribute to personalized medicine of PanNET patients.
Keywords: p53, PH domain, everolimus, p53 target gene, mTOR
Abstract
The molecular mechanisms underlying the development of pancreatic neuroendocrine tumors (PanNETs) have not been well defined. We report here that the genomic region of the PHLDA3 gene undergoes loss of heterozygosity (LOH) at a remarkably high frequency in human PanNETs, and this genetic change is correlated with disease progression and poor prognosis. We also show that the PHLDA3 locus undergoes methylation in addition to LOH, suggesting that a two-hit inactivation of the PHLDA3 gene is required for PanNET development. We demonstrate that PHLDA3 represses Akt activity and Akt-regulated biological processes in pancreatic endocrine tissues, and that PHLDA3-deficient mice develop islet hyperplasia. In addition, we show that the tumor-suppressing pathway mediated by MEN1, a well-known tumor suppressor of PanNETs, is dependent on the pathway mediated by PHLDA3, and inactivation of PHLDA3 and MEN1 cooperatively contribute to PanNET development. Collectively, these results indicate the existence of a novel PHLDA3-mediated pathway of tumor suppression that is important in the development of PanNETs.
Neuroendocrine tumors (NETs) arise from cells of the endocrine and nervous systems, and are found in tissues such as lung, pancreas and pituitary (1–3). NETs often produce, store and release biogenic amines and polypeptide hormones, and secretary granules containing these products provide a diagnostic marker for NETs. The mechanisms underlying the development of NETs remain unclear to date, due to the low incidence of these tumors and due to the lack of suitable experimental model systems, including genetically engineered mouse models. Pancreatic NET (PanNET), which is probably the best-studied NET, is the second-most common pancreatic tumor, having an incidence of ∼1 per 100,000 individuals. Patients having late-stage PanNET often harbor tumors that are unresectable or metastatic and face limited treatment options. Accordingly, the prognosis of patients having metastatic PanNET is the worst among the NET subtypes, with a 5-y survival rate of 27–43% (1). Recently, the drug Everolimus has shown promise in the treatment of PanNETs (4), providing a significant improvement in progression-free survival. Everolimus is an inhibitor of mammalian target of rapamycin (mTOR), a downstream mediator of the phosphoinositide 3-kinase (PI3K)/protein kinase B (AKT) pathway. The striking efficacy of Everolimus demonstrates the importance of the PI3K/Akt pathway in the pathology of PanNETs.
In agreement with these clinical results, studies on pancreatic endocrine cell lines have identified the PI3K/Akt signaling pathway as a major proliferation and survival pathway in these cells (5). Activated Akt phosphorylates substrates such as mTOR and controls various biological processes, including protein synthesis, proliferation, cell growth, and survival. Regulation of pancreatic islet β-cell proliferation, cell size, and apoptosis by Akt has been demonstrated using various mouse models. For example, transgenic mice overexpressing constitutively active Akt in β-cells exhibit increased β-cell proliferation and cell size and decreased induction of apoptosis (6).
Recently, the results of whole exomic sequencing of 10 PanNET specimens were published, revealing several key genetic alterations (7). In particular, genes in the PI3K/Akt pathway, i.e., TSC2, PTEN, and PIK3CA, were mutated in 15% of PanNETs. However, this represents only a subset of PanNETs, and may not fully explain the remarkable clinical results achieved by Everolimus in the majority of PanNET patients.
Previously, we have shown that Pleckstrin homology-like domain family A, member 3 (PHLDA3) is a novel p53-regulated repressor of Akt. The PHLDA3 contains a PH domain that, we showed, competes with the PH domain of Akt for binding to membrane lipids, thereby inhibiting Akt translocation to the cellular membrane and its activation. We also showed that PHLDA3 may have a tumor suppressive function (8). However, there has hitherto been no reported role for PHLDA3 in human tumors, and its in vivo function has remained elusive. In this report, we demonstrate that the PHLDA3 gene is a novel tumor suppressor, inactivation of which can lead to the development of PanNETs. We show that the PHLDA3 genomic locus undergoes LOH and that the PHLDA3 promoter is methylated at a high frequency in PanNETs. Furthermore, analysis of PHLDA3-deficient mice showed that these mice frequently develop islet hyperplasia as a result of enhanced islet cell proliferation and an increase in islet cell size. Collectively, these results indicate that PHLDA3 functions as a tumor suppressor in PanNETs.
Results
Frequent LOH at the PHLDA3 Gene Locus in PanNETs.
The PHLDA3 gene is located at 1q31, a locus that has been reported to have a high frequency of LOH in two NETs derived from pancreas: insulinomas and gastrinomas (9, 10). We therefore speculated that the PHLDA3 locus may undergo LOH in PanNETs, and analyzed the PHLDA3 locus for LOH using microsatellite markers surrounding the gene in 54 PanNET samples (Fig. 1 A–D; clinical diagnosis for each sample is shown in SI Appendix, Fig. S1A). As shown in Fig. 1B, out of 54 PanNETs, 50 samples were informative and 36 samples showed LOH at the PHLDA3 locus. The incidence of LOH at the PHLDA3 locus (72%) is remarkably high, and was comparable to the reported LOH incidence of the Multiple endocrine neoplasia type 1 (MEN1) gene, which has the highest reported incidence of genomic changes in PanNETs (11). Within the region analyzed, the LOH frequency peaks near the PHLDA3 locus, suggesting that LOH of the PHLDA3 gene is critical for PanNET development (Fig. 1D). This tendency becomes clearer when samples that exhibit partial LOH within this region (PanNET 1–18) were analyzed (Fig. 1D, blue line). A strikingly high incidence of LOH at the PHLDA3 locus indicates the importance of this PHLDA3-regulated tumor suppression pathway in PanNETs. Most of the PanNETs analyzed in this study are nonfunctional, and we found no associations between PHLDA3 LOH and specific PanNET type or insulin/glucagon positivity, to the extent that we examined this (SI Appendix, Fig. S1).
Fig. 1.
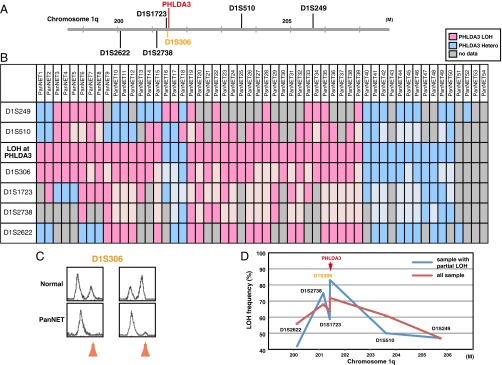
Frequency of LOH at the PHLDA3 gene locus in PanNETs. (A) Chromosomal locations of PHLDA3 gene and microsatellite markers used in this study. D1S306 is located just next to the PHLDA3 gene (32 kb upstream). (B) Microsatellite analysis of the PHLDA3 gene locus region. PanNET samples were analyzed for LOH around the PHLDA3 gene locus. Because D1S306 is located next to the PHLDA3 gene, the LOH status of the PHLDA3 gene was determined from the LOH status of the D1S306 locus. For some loci with no data (not informative or data unavailable), the LOH status of the locus was determined from the surrounding LOH status (shown in faint pink and faint blue). (C) Representative microsatellite analysis results. In normal tissues, two peaks derived from maternal and paternal alleles were detected, whereas in tumors, one allele was lost (shown by orange arrows), indicating LOH at the locus. (D) LOH frequency for each microsatellite marker. Frequencies from all samples (shown by red line) and frequencies from samples showing LOH partially within the analyzed region (PanNET1-18, shown by blue line) are shown.
PHLDA3 and MEN1 Cooperatively Suppress PanNET.
The most outstanding genomic aberration previously reported in PanNETs was the mutation and LOH of the MEN1 gene, a tumor suppressor gene associated with multiple endocrine neoplasia type 1 (7, 11). It has been reported that ∼50% of PanNET cases exhibit LOH of the MEN1 gene. Therefore, we analyzed whether MEN1 LOH is observed in our PanNET samples. As shown in Fig. 2 A and B, 32 samples out of 48 informative samples showed LOH at the MEN1 locus. Frequent LOH was observed at the MEN1 locus in our samples (67%), confirming previous studies. We next combined the LOH data for the PHLDA3 and MEN1 loci. As shown in Fig. 2C, LOH at the PHLDA3 and MEN1 loci did not show a mutually exclusive pattern, which would be expected if PHLDA3 and MEN1 were on the same tumor suppressing pathway. Interestingly, we observed a significant frequency of double LOH, i.e., occurring at both the PHLDA3 and MEN1 loci (25 of 45 samples, P < 0.05 by Fisher’s exact test). These data suggest that development of PanNET involves the functional loss of both pathways.
Fig. 2.
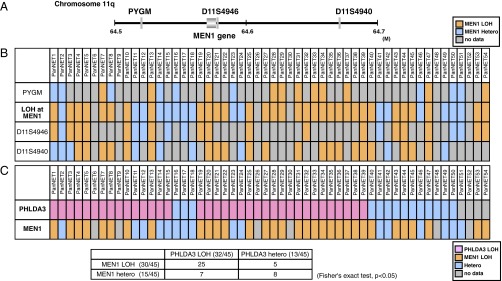
Relationship between PHLDA3 and MEN1 tumor-suppressing pathways. (A) Chromosomal locations of the MEN1 gene and microsatellite markers used in this study. (B) Analysis of LOH at the MEN1 locus. The LOH status of the MEN1 gene was determined from the LOH status of either of the informative markers. (C) Relationship between LOH status of the PHLDA3 and MEN1 loci. In total, 45 samples informative for both PHLDA3 and MEN1 loci were analyzed.
LOH at the PHLDA3 Locus Is Correlated to Poor Prognosis in PanNET Patients.
To select the proper treatment for each PanNET patient, prediction of disease prognosis is important. We observed that LOH at the PHLDA3 locus was associated with advanced stage PanNETs, whereas absence of LOH was associated with lower tumor grades. These associations were statistically significant (P < 0.01, by Fisher’s exact test), suggesting that the LOH is associated with a malignant phenotype in PanNETs (Fig. 3A). We next analyzed the relationship between LOH at the PHLDA3 locus and the prognosis of PanNET patients. As shown in Fig. 3B, patients exhibiting LOH at the PHLDA3 locus seemed to have a poorer prognosis compared with the patients without LOH. However, the observed difference did not achieve statistical significance, probably due to the relatively small numbers of patients analyzed. On the other hand, LOH at the MEN1 locus had no influence on tumor grade or patient survival, as has been reported (7) (Fig. 3 C and D). It will be necessary to extend these studies with larger numbers of patients before reaching a firm conclusion, however these results suggest that the PHLDA3-regulated pathway, but not the MEN1-regulated pathway, may be a critical determinant of the prognosis of PanNET patients.
Fig. 3.

LOH at the PHLDA3 and MEN1 gene locus and progression of PanNETs. (A) LOH at the PHLDA3 gene locus and grade of PanNETs. The P value was calculated by Fisher’s exact test. (B) Kaplan–Meier plots of overall survival of patients with PanNETs. Fourteen or 31 patients without or with PHLDA3 LOH were analyzed. Wilcoxon test was used to determine the P value. (C) LOH at the MEN1 gene locus and grade of PanNETs. (D) Kaplan–Meier plot for overall survival of patients with PanNETs. Twelve or 30 patients without or with MEN1 LOH were analyzed as in B.
The PHLDA3 Gene Undergoes Aberrant Methylation in Addition to LOH in PanNETs.
Because we found frequent LOH at the PHLDA3 locus in PanNETs, we next examined how the remaining allele is inactivated. The PHLDA3 gene is mutated in several cancers: 11 mutations in lung, urinary, and large intestine cancer are reported in the COSMIC database (http://cancer.sanger.ac.uk/cancergenome/projects/cosmic), and mutation in lung cancer was reported by Yoo et al. (12). Therefore, we analyzed the PHLDA3 ORF genomic sequence in our PanNET samples, but did not find any mutations within the coding regions (SI Appendix, Fig. S2). We next analyzed PHLDA3 mRNA expression levels in these PanNETs. As shown in Fig. 4A, PHLDA3 expression was significantly lower in samples showing LOH at the PHLDA3 locus compared with samples without LOH. We noticed a CpG island overlapping the promoter region and the first exon of the PHLDA3 gene (Fig. 4B). We therefore analyzed whether the methylation status of the PHLDA3 gene is related to PHLDA3 transcription levels. Specifically, we analyzed DNA methylation levels within the first exon of the PHLDA3 gene, because it has been reported that methylation of the first exon is tightly linked to transcriptional silencing (13). Analysis of PHLDA3 mRNA expression levels in four cancer cell lines revealed that PHLDA3 is highly expressed in LNCaP and MDA-MB-M468 cells, whereas expression is very low in DLD1 and H1299 cells (Fig. 4C). Analysis of DNA methylation levels by methylation-specific PCR revealed detectable methylation only in DLD1 and H1299 cells, cell lines with low PHLDA3 expression (Fig. 4D). It is of note that, in H1299 cells, a human lung NET cell line, PHLDA3 mRNA expression was remarkably low and methylation was remarkably high. We further treated H1299 cells with 5-aza-C to demethylate the PHLDA3 gene. As shown in Fig. 4E, 5-aza-C treatment resulted in decreased methylation at the PHLDA3 gene and enhanced expression of PHLDA3 in a 5-aza-C concentration-dependent manner. A similar result was obtained using a human PanNET cell line A99 (Fig. 4F) and the mouse insulinoma cell line MIN6 that has very low PHLDA3 expression (SI Appendix, Fig. S3 A and B). These results indicate that methylation of the PHLDA3 gene affects PHLDA3 transcription levels. We then analyzed the methylation status of the PHLDA3 promoter in PanNET samples that had undergone LOH at the PHLDA3 locus. As shown in Fig. 4G, methylation was not detected in normal pancreas or islets, whereas significant methylation was detected in all LOH+ samples (seven of seven) analyzed. These results show that the PHLDA3 gene can undergo methylation in addition to LOH in PanNETs, indicating that a two-hit inactivation of the PHLDA3 gene may often occur. We also analyzed LOH− samples and found detectable levels of methylation in two of four samples (SI Appendix, Fig. S4). Thus, the repression of PHLDA3 expression in LOH− samples due to methylation may also contribute to tumor progression in PanNETs.
Fig. 4.

PHLDA3 expression and promoter region methylation status in PanNETs. (A) PHLDA3 gene expression in PanNETs. Total RNAs were prepared from normal pancreas and PanNETs. RNA was pooled from 5 normal pancreases for the normal controls. RNA was isolated from PanNET samples with (10 samples) or without LOH (7 samples). Gene expression was quantitated by RT-PCR and normalized to GAPDH. (B) Genomic organization of PHLDA3 promoter region and location of CpG island. Wide lines indicate exonic regions of the PHLDA3 gene (+1 to +831 and +2994 to +3677). (C) PHLDA3 gene expression in cell lines. Gene expression was analyzed as in A. (D) DNA methylation of the PHLDA3 promoter. Genomic DNAs from the indicated cell lines were analyzed by methylation-specific PCR. Positions of the primers used in the assay are shown in B. Primers designed to amplify methylated DNA (upper panel) or DNA with or without DNA methylation (lower panel) were used. Fully methylated DNA was used as a control. (E and F) 5-aza-C treatment of Lung NET H1299 cells (E) or PanNET A99 cells (F). Both genomic DNAs and total RNAs were isolated, and analyzed as in D and A, respectively. (G) Methylation status of PHLDA3 promoter in normal pancreas, normal isolated islets and PanNETs (samples showing LOH at the PHLDA3 locus was analyzed). Genomic DNAs were prepared and analyzed as in D.
PHLDA3 Controls Akt Activity, Cell Proliferation, and Apoptosis of Islet Cells.
PanNETs are derived from pancreatic islet endocrine cells. It is well known that, in islet β cells, Akt signaling plays a central role in promoting cell growth and inhibiting apoptosis (5). Therefore, in β cells, loss of PHLDA3 function may result in the hyperactivation of Akt oncogenic signaling, and thus lead to tumor progression. To analyze the function of PHLDA3 in islet β cells, we examined RIN and MIN6 cells, cell lines derived from pancreatic β cells (Fig. 5 A–E). Whereas RIN cells have detectable levels of PHLDA3 expression, MIN6 has very low PHLDA3 expression (SI Appendix, Fig. S3A). We first used a gain-of-function approach to confirm that PHLDA3 functions as a repressor of Akt in MIN6 cells. As shown in Fig. 5A, expression of PHLDA3 resulted in decreased Akt activation levels and decreased phosphorylation of signaling molecules downstream of Akt. Similar results were obtained using PHLDA3−/− mouse embryonic fibroblasts (MEFs, SI Appendix, Fig. S5). Next, we knocked down PHLDA3 expression in RIN cells using siRNA against PHLDA3 (Fig. 5 B and C), and observed increased Akt activation and cell proliferation (Fig. 5 D and E). We observed similar results in normal primary rat islet cells, i.e., knockdown of PHLDA3 expression resulted in activation of Akt (with or without glucose stimulation) and significant enhancement of cell proliferation (Fig. 5 F–H and SI Appendix, Fig. S6). Next, we analyzed the effect of PHLDA3 expression on the apoptosis of islet cells induced by Streptozotocin (STZ), a chemical that is particularly toxic to insulin-producing β cells (14). We observed that although inhibition of PHLDA3 expression by siRNA was relatively poor in isolated rat islets (Fig. 5I), this knockdown significantly reduced the number of apoptotic cells caused by STZ treatment (Fig. 5J). Collectively, these results demonstrate that PHLDA3 controls Akt activity, cell growth, and the apoptosis of islet cells.
Fig. 5.

Effect of PHLDA3 expression on Akt activity, cell proliferation and apoptosis of islet cells. (A) Effect of PHLDA3 expression on Akt activity in MIN6 cells. MIN6 cells were transduced with Ad-LacZ or Ad-PHLDA3 at a moi of 35, and harvested 30 h postinfection. Akt activation and phosphorylation of Akt downstream signaling molecules were analyzed by Western blotting and quantified by normalization to total Akt levels (P-Akt) or by β-actin levels (P-p70 S6K, P-S6, P-Mdm2). (B and C) Efficiency of siRNA inhibition of PHLDA3 expression in RIN cells. RIN cells were transfected with control or PHLDA3 siRNAs. PHLDA3 mRNA levels were analyzed 31 h posttransfection by quantitative RT-PCR, standardized against β-actin (B). PHLDA3 protein levels were also determined 48 h posttransfection by Western blotting (C), using cells subjected to γ-ray irradiation (20 Gy) versus untreated. The γ-ray irradiated samples were included to help identify the band representing PHLDA3 protein (PHLDA3 is induced by p53 activation). (D) Effect of PHLDA3 expression on Akt activation in RIN cells. RIN cells were transfected as in B and Akt activation was analyzed by Western blotting 31 h posttransfection (left) and quantified by normalization to total Akt levels (right). (E) Effect of PHLDA3 expression on RIN cell proliferation. RIN cells were transfected as in B, and labeled with BrdU for 3 h and harvested 28 h post transfection. BrdU positive cells were quantified by using Ziva Ultrasensitive BrdU assay. (F) siRNA suppression of PHLDA3 expression in primary islet cells. Isolated primary islet cells were transfected with control or PHLDA3 siRNA, harvested 30 h post transfection, and PHLDA3 mRNA levels were analyzed by quantitative RT-PCR as in B. (G) Effect of PHLDA3 expression on Akt activation in primary islet cells. Cells were transfected with siRNA as in F and 48 h posttransfection were treated with glucose (30 mM) for 20 min. Levels of Akt activation were analyzed as in D. (H) Effect of PHLDA3 expression on primary islet cell proliferation. Cells were transfected as in F, labeled with BrdU for 4 h and harvested 30 h post transfection. BrdU positive cells were analyzed as in E. (I and J) Effect of PHLDA3 expression on STZ-induced apoptosis of primary rat islets. Isolated islets were pooled from three rats, and transfected with control or PHLDA3 siRNA. At 75 h posttransfection, islets were treated with STZ (20 μg/mL) for 30 min. Islets were then cultured overnight, and total RNAs were prepared and PHLDA3 expression was analyzed by quantitative RT-PCR as in B (I), or subjected to TUNEL staining and analyzed by FACS (J).
Development of Hyperplastic Islets in PHLDA3-Deficient Mice.
To analyze the effect of PHLDA3 deficiency on islets in vivo, we examined the pancreases of PHLDA3-deficient mice. Differences in islet sizes were not detected in 3-mo-old PHLDA3+/+ or PHLDA3−/− mice (SI Appendix, Fig. S7). However, in 6-mo-old PHLDA3−/− mice, we found significantly fewer islets that were smaller than 0.01 mm2 and significantly more islets that were larger than 0.01 mm2, compared with PHLDA3+/+ mice (Fig. 6 A and C). However, the overall average islet size at 6 mo was not significantly different between PHLDA3+/+ and PHLDA3−/− mice (Fig. 6E). At 10 mo, abnormally large islets (larger than 0.08 mm2) were frequently found (Fig. 6 B and D), and the average islet sizes were significantly larger in 10-mo-old PHLDA3+/− and PHLDA3−/− mice compared with PHLDA3+/+ mice (Fig. 6E). Thus, a difference in islet sizes between PHLDA3+/+ and PHLDA3−/− mice appears to emerge between 3 and 10 mo of age. We stained the islets with Ki67 antibody and found significantly more Ki67-positive cells in PHLDA3−/− islets compared with the PHLDA3+/+ islets (Fig. 6F; representative images are shown in SI Appendix, Fig. S8). These data show that loss of PHLDA3 expression results in enhanced proliferation of islet cells.
Fig. 6.

Hyperplastic islets in PHLDA3-deficient mice. Six-month-old (21- to 31-wk-old) (A, C, and E) and 10-mo-old (39- to 49-wk-old) (B and D–F) mice were analyzed. (A and B) Hematoxylin and eosin staining of islets from wild-type, heterozygote and PHLDA3-deficient mice (A, 6-mo; B, 10-mo). (C–E) Calculation of islet sizes. Islet areas were calculated from hematoxylin and eosin-stained pancreas sections. One (6-mo-old mice) or three pancreas sections (10-mo-old mice; sections separated by more than 20 μm z axis) were analyzed per mouse. Islet areas from indicated numbers (n) of mice were analyzed. Size distributions of islets (C, 6-mo; D, 10-mo) and average islet sizes (E; 6- and 10-mo-old) are shown. The P values between PHLDA3+/+ and PHLDA3+/− or PHLDA3−/− were calculated and are shown (*P < 0.05; **P < 0.01). (F) Quantitation of Ki67-positive cells. Pancreas sections from indicated numbers (n) of mice were analyzed. Islet nuclei number and Ki67-positive nuclei number were counted and the percentage of Ki67-positive cells was calculated. (**P < 0.01) Representative images are shown in SI Appendix, Fig. S4.
Enhanced Proliferation of β Cells and Altered Glucose Metabolism in PHLDA3-Deficient Mice.
The islets were further stained with anti-insulin and anti-glucagon antibodies to determine the numbers of β and α cells, respectively, within the islets. Normal murine islets have β cells in the center of the islet and α cells at the periphery surrounding the β cells (as shown in PHLDA3+/+ islets in Fig. 7A). However, in the hyperplastic islets of PHLDA3+/− and PHLDA3−/− mice, huge numbers of β cells and relatively small numbers of α cells were often observed, and the hyperplastic islets often showed abnormal islet architecture, with few α cells at the periphery of the islets (Fig. 7A). We calculated the areas occupied by α and β cell types to determine which of these had increased. As shown in Fig. 7B, the mean percentage area occupied by β cells was significantly higher in PHLDA3−/− islets. The area occupied by β cells was also significantly high in large PHLDA3−/− islets (larger than 0.05 mm2) compared with that seen in large islets infrequently found in PHLDA3+/+ mice (Fig. 7B). Because we had found a significantly higher number of proliferating cells in PHLDA3−/− islets (Fig. 6F), we stained the islets with anti-Ki67, -insulin, and -glucagon antibodies to identify which cell types within the islets were proliferating. As shown in Fig. 7C, we found that most Ki67-positive cells were β cells in PHLDA3−/− islets. Taken together, these data show that islet β cell proliferation is enhanced in PHLDA3-deficient islets.
Fig. 7.

Proliferation of β cells in the islets of PHLDA3-deficient mice. Ten-mo-old (39- to 49-wk-old) mice were analyzed. (A) Distribution of β and α cells in pancreas sections. Pancreas sections were stained with antibodies to identify β cells (anti-insulin; red) and α cells (anti-glucagon; green). Representative images of hyperplastic islets from PHLDA3+/− and PHLDA3−/− mice are shown. (B) Percent area occupied by β cells. Pancreas sections were stained as in A, and areas occupied by α- and β-cells in indicated numbers of islets from PHLDA3+/+ (five mice were analyzed) and PHLDA3−/− (six mice were analyzed) were calculated and percentages of β-cell areas in the islets were determined. Semihyperplasic islets and hyperplastic islets (larger than 0.05 mm2 islet area) were separately calculated and shown at the right. (*P < 0.05; **P < 0.01). (C) Proliferation in pancreas sections. Serial pancreas sections of PHLDA3−/− mice were stained with anti-insulin and anti-glucagon, anti-Ki67 and HE, to determine the cell types that are Ki67 positive. Representative images are shown. (D) Body weight, blood glucose and insulin levels. Indicated numbers (n) of mice were analyzed. Plasma insulin levels and blood glucose levels were determined in blood from tail vein samples, and were determined twice for each mouse. Mice were fed ad libitum. (*P < 0.05; **P < 0.01). (E) Glucose tolerance test (GTT). Indicated numbers (n) of overnight-fasted mice were subjected to GTT by i.p. injection of glucose (2 mg/g body weight). GTT was performed twice for each mouse. The P values between PHLDA3+/+ and PHLDA3+/− or PHLDA3−/− were calculated and are shown in the panels (*P < 0.05; **P < 0.01). The differences between PHLDA3+/− and PHLDA3−/− were not significant (P > 0.05).
It would be expected that abnormal proliferation of β cells would result in the excess production of insulin, leading to altered glucose metabolism in PHLDA3-deficient mice. As shown in Fig. 7D, although the PHLDA3 genotype had no influence on body weights, 10-mo-old PHLDA3+/− and PHLDA3−/− mice had higher plasma insulin and lower blood glucose levels compared with age-matched wild-type mice under fed conditions. Similar results were obtained in 6-mo-old fed mice (SI Appendix, Fig. S9A) and in 10-mo-old fasted mice (SI Appendix, Fig. S9B). Therefore, we performed glucose tolerance tests and found significant enhancement of glucose tolerance in PHLDA3+/− and PHLDA3−/− mice (Fig. 7E). These data show that loss of PHLDA3 expression results in enhanced proliferation of islet cells, especially β cells, and consequential increase of insulin secretion.
We further characterized PHLDA3−/− islets using several β cell markers: the endocrine cell marker chromogranin A (SI Appendix, Fig. S10), the β cell differentiation marker Glut2 (SI Appendix, Fig. S11), and deposition of IAPP (islet amyloid polypeptide; SI Appendix, Fig. S12). None of these markers showed significant difference compared with PHLDA3+/+ islets, indicating that PHLDA3−/− islets retain normal β cell characteristics, to the extent we examined.
PHLDA3-Deficient Islets Have Enhanced Akt Activity and Larger Cell Size, and Are Resistant to Apoptosis.
We further analyzed the effects of PHLDA3 deficiency on several Akt-regulated biological processes. We first confirmed reduction or loss of PHLDA3 expression in PHLDA3+/− and PHLDA3−/− mice islets (Fig. 8A). We found that activation of Akt and phosphorylation of its downstream molecules were augmented in PHLDA3−/− islets (Fig. 8B). It has been reported that enhanced Akt activity has an effect on islet cell size (5, 6). We therefore analyzed islet cell size in PHLDA3+/+, PHLDA3+/−, and PHLDA3−/− mice. As shown in Fig. 8C, islet cell size was significantly increased in PHLDA3−/− and PHLDA3+/− mice. We next analyzed the sensitivity of PHLDA3−/− islets to apoptosis. Wild-type or PHLDA3−/− mice were treated with STZ for 5 consecutive days to produce β cell injury. It is known that STZ-induced apoptosis of β cell results in the elevation of blood glucose, and can thereby experimentally induce type I diabetes in mice. We analyzed blood glucose levels at the indicated times following STZ treatment, and STZ administration resulted in the effective elevation of blood glucose levels in wild-type mice, whereas elevation was diminished in PHLDA3−/− mice (Fig. 8D). When we calculated β cell and α cell areas in STZ-treated mice, we observed a significant increase in the area occupied by β cells in PHLDA3-deficient mice, showing that PHLDA3 is required for the efficient induction of β cell apoptosis by STZ (Fig. 8E). These results demonstrate that PHLDA3 controls Akt activity, cell size, and apoptosis of islet cells in vivo.
Fig. 8.

Akt activation in islets of PHLDA3-deficient mice. (A) PHLDA3 mRNA expression in isolated islets. Islets were isolated from PHLDA3+/+, PHLDA3+/−, and PHLDA3−/− mice, and analyzed for PHLDA3 expression by quantitative RT-PCR, normalized to β-actin. (B) Akt activity and phosphorylation of Akt downstream signaling molecules in isolated islets. Akt activation and phosphorylation of Akt downstream signaling molecules were analyzed by Western blotting and quantified by normalization to total Akt levels (P-Akt, Right) or by β-actin levels (P-p70 S6K, P-S6, P-GSK3β, and P-Mdm2). (C) Islet cell size in PHLDA3-deficient mice. (Left) Indirect immunofluorescence staining of Glut2 in pancreas section from 10-mo-old mice. (Right) Islet areas and nuclei numbers were calculated, and mean islet cell sizes were determined from one hematoxylin- and eosin-stained pancreas sections per indicated numbers (n) of mice. The P values between PHLDA3+/+ and PHLDA3+/− or PHLDA3−/− were calculated and shown in the panels (*P < 0.05; **P < 0.01). The difference between PHLDA3+/− and PHLDA3−/− was also significant (P < 0.05). (D) Blood glucose levels in streptozotocin-induced diabetic mice. Indicated numbers (n) of PHLDA3+/+ or PHLDA3−/− mice were injected i.p. with STZ for 5 consecutive days. Blood glucose levels were determined at different time points as indicated after administration of STZ. (*P < 0.05; **P < 0.01). (E) Distribution of β and α cells in STZ-treated PHLDA3+/+ and PHLDA3−/− mice. (Left) Sections were stained with antibody against insulin (β cell marker; red) and glucagon (α cell marker; green) and representative images are shown. Pancreas sections of three PHLDA3+/+ and three PHLDA3−/− mice were analyzed. (Right) For each mouse, α-cell and β-cell areas were calculated from one pancreas section. (*P < 0.05.)
Discussion
In this report, we have shown that PHLDA3 is a candidate tumor suppressor in PanNETs. We observed that the LOH of the PHLDA3 gene locus in human PanNETs occurs at a remarkably high frequency and is comparable to that of the MEN1 gene locus, the gene reported to be most frequently affected in PanNETs (15). We also showed that LOH at the PHLDA3 gene locus is associated with disease progression and poor prognosis in PanNETs. In contrast, LOH/mutation of MEN1 was found to be unrelated to the prognosis of PanNET patients, both in this and in a previous study (7). These results show that the PHLDA3-regulated tumor suppression pathway is relevant to the progression and malignant phenotype of PanNETs and the poor prognosis of PanNET patients. Because PHLDA3 is a repressor of Akt, we propose that inhibition of the Akt pathway would improve the prognosis of PanNET patients exhibiting LOH of PHLDA3. This possibility is supported by the reported clinical efficacy of the Akt pathway inhibitor Everolimus, which has been shown to improve the survival of PanNET patients significantly. Everolimus treatment was approved in Japan only from 2011, and therefore none of the patients in our study had received Everolimus. We speculate that patients who are positive for PHLDA3 LOH and have a poor prognosis may benefit most from Everolimus treatment. Furthermore, determination of PHLDA3 LOH status could serve as a diagnostic measure to select patients who should receive Everolimus. Thus, it will be important to conduct a prospective study to analyze the effect of Everolimus in patients with or without PHLDA3 LOH.
We have shown that PHLDA3 regulates Akt activity and various Akt-regulated biological processes, i.e., cell proliferation, cell size, and apoptosis, in cultured cell lines and in vivo endocrine cells. Several laboratories have generated transgenic mice that specifically express active Akt in β cells (6, 16). These mice developed hyperplastic islets, but did not develop malignant PanNETs (17). Likewise, we have shown that loss of PHLDA3 and the resulting activation of Akt leads to hyperplastic islet development, but not to the development of PanNETs. Although Akt activation is observed in various cancers and contributes to tumorigenesis and tumor progression, the conclusion derived from these experiments is that activation of Akt pathway alone is insufficient to cause PanNETs unless combined with an oncogenic event in a second pathway. In human PanNETs, double LOH of PHLDA3 and MEN1 is frequently observed. In these cells, loss of PHLDA3 function, i.e., activation of Akt, is combined with loss of MEN1 function to promote PanNET tumorigenesis, and loss of PHLDA3 function particularly contributes to the progression of PanNETs. It would therefore be interesting to generate mice that are doubly deficient in PHLDA3 and MEN1 to analyze whether the islet phenotypes are more pronounced and the hyperplastic islets more prone to malignancy.
We observed hyperplastic islets in PHLDA3 heterozygote (+/−) mice as well as PHLDA3-deficient (−/−) mice. This observation suggests that PHLDA3 is haplo-insufficient for the suppression of endocrine cell proliferation. We have previously shown that PHLDA3 expression represses Akt activity in a dose-dependent manner, consistent with the possibility that loss of a single PHLDA3 allele could lead to enhanced Akt activation and enhanced proliferation of endocrine cells (8). However, we have also shown that in human PanNETs, the PHLDA3 locus undergoes methylation in addition to LOH, suggesting that two hits on the PHLDA3 gene is required for human PanNET development. We assume that loss of both PHLDA3 alleles, and consequent stronger activation of Akt, may be required to exert a tumorigenic phenotype. Future studies should examine the islet phenotypes of PHLDA3+/− and PHLDA3−/− in a MEN1−/− background. We expect that, in a MEN1−/− background, PHLDA3−/− mice would develop PanNETs more frequently than in PHLDA3+/− mice. In addition, because we found association of LOH at the PHLDA3 locus in both nonfunctional and functional human PanNETs, whether nonfunctional PanNETs develop in these mice is an interesting issue.
We previously identified PHLDA3 as a p53 target gene. In the present study, we show that the PHLDA3 locus undergoes frequent LOH in PanNETs, a tumor type in which p53 mutations are rare (3, 7). Recently it has been reported that among the various target genes of p53, PHLDA3 displays prominent tumor suppressor activity (18). Therefore, in tumors harboring a p53 mutation, loss of p53-regulated PHLDA3 expression may significantly contribute to tumor progression, whereas in tumors without a p53 mutation, loss of the PHLDA3 gene itself may drive oncogenesis. Interestingly, global methylation profiling of prostate cancer specimens has revealed significant methylation of the PHLDA3 gene in these cancers (19). In addition, in the COSMIC database, 11 PHLDA3 mutations in several cancers are reported. All mutations are located within the PH domain of PHLDA3, and nonsynonymous mutations may result in loss of Akt repressing ability. Therefore, in addition to inactivation by methylation, these and other mutations that result in a functional loss of PHLDA3 may contribute to some cancers.
In summary, our results show that PHLDA3 is a novel tumor suppressor of PanNET, and PHLDA3 and MEN1 cooperatively suppress its development. PHLDA3 represses Akt activity in islet cells and hyperplastic islets are found in both PHLDA3+/− and PHLDA3−/− mice. Collectively, our data illustrates the importance of the PHLDA3-regulated tumor suppression pathway in PanNETs.
Materials and Methods
Cell Lines, Cell Culture, Transfection, Adenovirus Infection, and Soft Agar Colony Formation Assay.
Cell lines used in this study were: LNCaP (human prostate cancer), MDA-MB-M468 (human breast cancer), DLD1 (human colorectal cancer), H1299 (human lung NET), A99 (human PanNET, ref. 20), RIN (rat pancreatic β cell), and MIN6 (mouse pancreatic β cell). Cell culture and transfection was performed as described (21). The siRNAs were introduced using RNAiMAX (Invitrogen). ON-target plus control and ON-target plus PHLDA3-targeting siRNAs were purchased from Dharmacon Research. Adenovirus infection was performed using previously described adenoviruses expressing LacZ or N-terminally HA-tagged PHLDA3 (8). Everolimus (AdooQ BioScience) was added to cultures at the indicated concentrations. For soft agar colony formation assays, cells were seeded in 3-cm dishes with a bottom layer of 0.5% agarose and a top layer of 0.33% agarose, both in complete media. The assay was performed in triplicate for each sample. Colonies were photographed after 9 (H1299) or 10 (MIN6) days of incubation. Colonies were counted in three to five different views from each plate to calculate average values. The total numbers of colonies larger than 100 (MIN6) or 200 (H1299) pixels were counted per view.
Western Blotting Analysis.
Cells were lysed in lysis buffer [50 mM Tris⋅HCl (pH 8.0), 1% Nonidet P-40, 250 mM NaCl, 50 mM NaF, 1 mM Na3VO4, 1 mM protease inhibitor (PMSF, aprotinin, leupeptin) and 1 mM DDT]. Whole cell lysates were subjected to protein quantification and analyzed by Western blotting. To detect PHLDA3, 20 μg of whole cell lysates (WCL) were loaded. To detect other proteins, 5 μg of WCL were loaded. Antibodies used in this study were: anti-Akt rabbit polyclonal antibody, anti-phospho-Akt (S473) rabbit monoclonal antibody, anti-p70S6K rabbit monoclonal antibody, anti-phospho-p70S6K (T389) rabbit polyclonal antibody, anti-phospho-S6 (S240/244) rabbit monoclonal antibody, anti-phospho-Gsk3β (S9) rabbit polyclonal antibody, anti-phospho-Mdm2 (S166) rabbit polyclonal antibody from Cell Signaling Technology, anti-actin mouse monoclonal antibody from SIGMA from Santa Cruz Biotechnology, anti-PHLDA3 goat polyclonal antibody from Abcam, anti-HA monoclonal antibody (clone 12CA) from Roche Diagnostics.
Reverse Transcription and Real-Time PCR.
Reverse transcription was carried out using kits from Invitrogen following the manufacturer’s instructions (SuperScript First-Strand Synthesis System for RT-PCR). Total RNA (0.2–5 μg) was used for reverse transcription. Reverse-transcribed cDNAs were subjected to real-time PCR, which was performed with a LightCycler 480 Instrument (Roche Diagnostics). For the detection of PHLDA3 (human; Hs00385313_m1, mouse; Mm00449846_m1, rat; rat; Rn01483684_m1), beta actin (mouse; Mm00607939_s1, rat; Rn00667869_m1) and GAPDH (human; Hs02758991_g1, mouse; Mm99999915_g1), TaqMan probe from Applied Biosystems was used.
BrdU Incorporation Assay and Measurement of Cell Number.
BrdU-positive cells were quantified using the Ziva Ultrasensitive BrdU assay (Jaden BioScience). This assay detects the incorporation of BrdU using a labeled anti-BrdU antibody and detection substrate in an ELISA format. By this assay, a small fraction of proliferating cells within a large population of nonproliferating cells can be detected. Cell numbers were analyzed by using CellTiter-Glo Luminescent Cell Viability Assay (Promega). Using this assay, viable cells are determined by quantitation of ATP, an indicator of metabolically active cells.
Flow Cytometry and TUNEL Assay.
Apoptosis of islet cells was quantitated by the TUNEL reaction using the In Situ Cell Death Detection kit, Fluorescein (Roche Diagnostics) followed by flow cytometry. Flow cytometry analysis was performed using a FACS Calibur instrument (Becton Dickinson).
Tumor Samples Used in the Study, and DNA and RNA Extraction from Primary Tumor Samples.
The tumor samples used in this study were surgically resected at the National Cancer Center Hospital (44 samples; PanNET1-18, 24–47, 52, 53), Kyoto University Hospital (6 samples; PanNET19-23, 51), or Kagawa University Hospital (4 samples; PanNET 48–50, 54) between 1993 and 2012. Histological grading of the tumors were determined based on the classification of World Health Organization 2004. This study was approved by the Institutional Review Board of the National Cancer Center, Tokyo. Clinical and pathological data were obtained through a detailed retrospective review of the medical records of all patients with PanNET. Five-micrometer sections of paraffin-embedded tissues were subjected to DNA extraction. Total RNA was extracted from frozen normal pancreas and tumor samples using an RNeasy mini kit (Qiagen).
Microsatellite Analysis.
Microsatellite analysis was performed basically as described (8). We used six primer pairs labeled with FAM that amplify microsatellite loci to achieve accurate detection of LOH at the PHLDA3 locus (Fig. 1A). For the MEN1 locus, three primer pairs were used (Fig. 2A). Amplified PCR products were analyzed with a 3100 automated sequencer (Applied Biosystems). Collected data were analyzed with GeneScan and Genotyper software (Applied Biosystems), and allele sizes and peak heights were calculated. The genotype was determined to be heterozygous if two bands of different sizes were obtained from normal tissues. A ratio of the two peaks in tumor DNA of less than 0.7 in comparison with the corresponding ratio of the two peaks in nontumor DNA was considered as allelic loss.
5-aza-dC Treatment and Methylation-Specific PCR.
Cells were seeded at a density of 3 × 10⁵ cells (H1299 and A99) or 3 × 10⁶ (MIN6) cells per 10-cm dish on day 0 and treated with freshly prepared 5-aza-dC (Sigma-Aldrich) for 24 h on days 1, 3, and 5. After each treatment, cells were placed in fresh medium and harvested on day 6. Genomic DNA was extracted and subjected to bisulfite conversion using EZ DNA Methylation kit (Zymo research). Fully methylated controls were prepared by methylating genomic DNA with SssI methylase (New England Biolabs). Methylation-specific PCR (MSP) was performed basically as described (22). MSP was performed using the specific primer sets shown below. BS-F and R primers were used to amplify DNA with or without methylation. MSP-F and R primers were used to amplify methylated DNA.
BS-F: GTAGATAGAGTTTAGGGGAGTAAGAG
BS- R: CTCTACCCCAACTAACCCAACCC
MSP-F: GAGGGTTGGTTAGGGTAGGAATGTG
MSP-R: ACTCCCCTAAACTCTATCTACACAC
Mice Used in This Study.
Generation of PHLDA3-deficient mice was reported (23). Briefly, a PHLDA3neo targeting vector was obtained by cloning a 6-kb upstream KpnI fragment and a 6-kb downstream HindIII/NotI fragment into pPNT1. The resulting deletion (nucleotides 579–2,096 of GenBank accession no. AF151099) eliminates all of exon 1 and part of exon 2, thus deleting the entire PHLDA3 coding region. PHLDA3−/− mice were generated by crossing the heterozygotes. MEFs were isolated and maintained as described (24). Mouse experiments were performed in a specific pathogen-free environment at the National Cancer Center animal facility according to institutional guidelines, and all of the animal experiments were approved by the Committee for Ethics in Animal Experimentation at the National Cancer Center.
Blood Glucose, Plasma Insulin Measurement, and Glucose Tolerance Tests.
Blood glucose levels were determined with blood samples from tail vein punctures in mice using Glucose pilot (Aventir Biotech), according to the procedures specified by the manufacturer. Plasma insulin levels were determined with blood samples from tail vein punctures or inferior vena cava in mice by ELISA (Morinaga Institute of Biological Science), according to the procedures specified by the manufacturer. For glucose tolerance tests, mice were fasted overnight and blood was drawn from tail vein at 0, 15, 30, 45, 60, 90, and 120 min after i.p. injection of d-glucose (2 mg/g of body weight).
Quantitative Measurement of Islet Morphology.
Islet area and islet nuclei number were measured from hematoxylin and eosin-stained pancreas sections and Ki67-positive cells were counted from immunohistochemically stained pancreas sections using TissueFAXS (TissueGnostics). Chromogranin A signal intensity was also measured using TissueFAXS. α and β cells areas were quantified by the number of pixels in each immunohistochemically stained area in images taken by fluorescence microscopy (Olympus IX2-DSU).
Isolation of Rat and Mouse Primary Islets and Preparation of Primary Islet Cells.
The animal experiment was reviewed and approved by the Institutional Animal Care and Use Committee for Frontier Medical Sciences, Kyoto University. For isolation of rat islets, Lewis or Wistar rats (male, aged 9–11 wk, Shimizu Laboratory Supplies) were used. Islet isolation was performed according to previously described methods (25). Briefly, through midline laparotomy, 10 mL of a type XI collagenase solution (1200 CDU/mL, C9407, Sigma-Aldrich) was infused into the common bile duct that was ligated at the hepatic side before the inflow into the duodenum. The pancreases were removed and digested in a water bath set at 37 °C for 18 min. The digested pancreases were filtered with a stainless steel sieve to separate the islets, and purified using a discontinuous gradient solution (Dextran 70, 17–0280-02, Amersham). Mouse islets were isolated from 10- to 25-wk-old male animals by collagenase digestion of the pancreas, followed by purification using a Ficoll gradient. Islets were handpicked twice. The harvested islets were cultured in RPMI or CRML-1066 medium (11530, Gibco) supplemented with a 1% antibiotic–antimycotic solution (15240-062, Gibco) and 10% (vol/vol) FBS (12103-78P, JRH) in an incubator set at 5% (vol/vol) CO2, 37 °C.
Primary islet cells were prepared by digesting the islets with Accutase for 15 min at 37 °C. Islet cells were washed with RPMI before use in experiments.
Immunohistochemistry.
Immunohistochemistry (IHC) was performed basically according to the manufacturer’s instructions. In brief, after deparaffinization, tissues sections underwent antigen retrieval by autoclaving slides for 5 min in 10 mM citrate buffer (pH 6.0). For fluorescent immunohistochemical staining of insulin, glucagon, and Glut2, nonspecific interactions were blocked for 30 min using a 5% (vol/vol) goat serum solution. The primary antibodies were: guinea pig anti-insulin polyclonal antibody (Abcam) diluted 1:400, mouse anti-glucagon monoclonal antibody (Sigma-Aldrich) diluted 1:750 and rabbit anti-Glut2 polyclonal antibody (Alpha Diagnostic) diluted 1:750 with Signal Enhancer HIKARI (Nacalai Tesque). These were applied to the slides and incubated overnight at 4 °C. As secondary antibodies, Alexa Fluor 488 goat anti-mouse IgG antibody (Invitrogen) diluted 1:500, Alexa Fluor 488 goat anti-rabbit IgG antibody (Invitrogen) diluted 1:500 and Alexa Fluor 546 goat anti-guinea pig IgG antibody (Invitrogen) diluted 1:1,000 with PBST-BSA were applied to the slides and incubated 3 h at room temperature. To detect Ki67- and Chromogranin A-positive cells, sections were pretreated with 0.3% H2O2 for inactivation of endogenous peroxidase. The primary antibody, rat anti-Ki67 monoclonal antibody (DakoCytomation) diluted 1:200, or rabbit anti-Chromogranin A polyclonal antibody (Thermo Scientific) diluted 1:200 with Signal Enhancer HIKARI were applied to the slides and incubated overnight at 4 °C. As secondary antibodies, Histofine Simple Stain MAX PO anti-rat IgG antibody (Nichirei Bioscience) or biotinylated anti-rabbit IgG antibody (VECTOR Laboratories) was used. We used 3,3′-diaminobenzidine tetrahydrochloride (DAB; Muto Pure Chemicals) as the substrate chromogen. The sections were counter stained with hematoxylin.
STZ-Induced Diabetes.
Eleven- to 22-wk-old wild-type and PHLDA3 knockout male mice were injected i.p. with 50 mg/kg streptozotocin daily for 5 consecutive days (Sigma-Aldrich) to produce β cell injury. On days 92, 93, 99, and 100, animals were killed.
Statistical Analysis.
Data were calculated and shown as mean ± SD (for Figs. 4, 5 and SI Appendix, Fig. S3) or as mean ± SEM (Figs. 6–8 and SI Appendix, Figs. S7, S9, and S10A). Comparisons between the samples were performed by Student t test. Survival data were analyzed using XLStat software (version 2013.4.05; Addinsoft), and Kaplan–Meyer plots were drawn. Wilcoxon test was performed to assess the statistical significance of the difference between the survival curves. In Fisher’s exact test, P values were obtained by using two tails. Statistical significance was defined as P < 0.05.
Supplementary Material
Acknowledgments
We thank T. Niwa and T. Ushijima (National Cancer Center, Japan) for advice on methylation-specific PCR, Marc Lamphier for critical reading of the manuscript, Dr. Wanxing Cui for providing isolated human islets, and Drs. T. Yoshida and H. Sakamoto and National Cancer Center Research Core Facility (supported by National Cancer Center Research and Development Fund, 23-A-7) for the LOH analyses in this study. This study was supported by Grants-in-Aid for Scientific Research from the Ministry of Education, Culture, Sports, Science and Technology of Japan (23501279 and 26430133, to R.O.); New Energy and Industrial Technology Development Organization (NEDO) (09A02012a, to R.O.); research grants from Daiichi-Sankyo Foundation of Life Science (to R.O.); the Ichiro Kanehara Foundation (R.O.); Takeda Science Foundation (R.O.); Astellas Foundation for Research on Metabolic Disorders (R.O.); Foundation for Promotion of Cancer Research in Japan (R.O.); Extramural Collaborative Research Grant of Cancer Research Institute, Kanazawa University, Japan (to R.O.); Cooperative Research Program of Institute for Frontier Medical Sciences, Kyoto University, Japan (R.O.); and grants from the National Cancer Center Research and Development Fund (23-B-9, to R.O.; and 23-A-11, to T.T.).
Footnotes
The authors declare no conflict of interest.
This article is a PNAS Direct Submission.
This article contains supporting information online at www.pnas.org/lookup/suppl/doi:10.1073/pnas.1319962111/-/DCSupplemental.
References
- 1.Hauso O, et al. Neuroendocrine tumor epidemiology: Contrasting Norway and North America. Cancer. 2008;113(10):2655–2664. doi: 10.1002/cncr.23883. [DOI] [PubMed] [Google Scholar]
- 2.Yao JC, et al. One hundred years after “carcinoid”: Epidemiology of and prognostic factors for neuroendocrine tumors in 35,825 cases in the United States. J Clin Oncol. 2008;26(18):3063–3072. doi: 10.1200/JCO.2007.15.4377. [DOI] [PubMed] [Google Scholar]
- 3.de Wilde RF, Edil BH, Hruban RH, Maitra A. Well-differentiated pancreatic neuroendocrine tumors: From genetics to therapy. Nat Rev Gastroenterol Hepatol. 2012;9(4):199–208. doi: 10.1038/nrgastro.2012.9. [DOI] [PMC free article] [PubMed] [Google Scholar]
- 4.Yao JC, et al. RAD001 in Advanced Neuroendocrine Tumors, Third Trial (RADIANT-3) Study Group Everolimus for advanced pancreatic neuroendocrine tumors. N Engl J Med. 2011;364(6):514–523. doi: 10.1056/NEJMoa1009290. [DOI] [PMC free article] [PubMed] [Google Scholar]
- 5.Elghazi L, Bernal-Mizrachi E. Akt and PTEN: Beta-cell mass and pancreas plasticity. Trends Endocrinol Metab. 2009;20(5):243–251. doi: 10.1016/j.tem.2009.03.002. [DOI] [PMC free article] [PubMed] [Google Scholar]
- 6.Tuttle RL, et al. Regulation of pancreatic beta-cell growth and survival by the serine/threonine protein kinase Akt1/PKBalpha. Nat Med. 2001;7(10):1133–1137. doi: 10.1038/nm1001-1133. [DOI] [PubMed] [Google Scholar]
- 7.Jiao Y, et al. DAXX/ATRX, MEN1, and mTOR pathway genes are frequently altered in pancreatic neuroendocrine tumors. Science. 2011;331(6021):1199–1203. doi: 10.1126/science.1200609. [DOI] [PMC free article] [PubMed] [Google Scholar]
- 8.Kawase T, et al. PH domain-only protein PHLDA3 is a p53-regulated repressor of Akt. Cell. 2009;136(3):535–550. doi: 10.1016/j.cell.2008.12.002. [DOI] [PubMed] [Google Scholar]
- 9.Yang YM, et al. Chromosome 1q loss of heterozygosity frequently occurs in sporadic insulinomas and is associated with tumor malignancy. Int J Cancer. 2005;117(2):234–240. doi: 10.1002/ijc.21175. [DOI] [PubMed] [Google Scholar]
- 10.Chen YJ, Vortmeyer A, Zhuang Z, Huang S, Jensen RT. Loss of heterozygosity of chromosome 1q in gastrinomas: Occurrence and prognostic significance. Cancer Res. 2003;63(4):817–823. [PubMed] [Google Scholar]
- 11.Corbo V, et al. MEN1 in pancreatic endocrine tumors: Analysis of gene and protein status in 169 sporadic neoplasms reveals alterations in the vast majority of cases. Endocr Relat Cancer. 2010;17(3):771–783. doi: 10.1677/ERC-10-0028. [DOI] [PubMed] [Google Scholar]
- 12.Yoo NJ, Kim YR, Lee SH. Expressional and mutational analysis of PHLDA3 gene in common human cancers. Pathology. 2011;43(5):510–511. doi: 10.1097/PAT.0b013e3283489036. [DOI] [PubMed] [Google Scholar]
- 13.Brenet F, et al. DNA methylation of the first exon is tightly linked to transcriptional silencing. PLoS ONE. 2011;6(1):e14524. doi: 10.1371/journal.pone.0014524. [DOI] [PMC free article] [PubMed] [Google Scholar]
- 14.Lenzen S. The mechanisms of alloxan- and streptozotocin-induced diabetes. Diabetologia. 2008;51(2):216–226. doi: 10.1007/s00125-007-0886-7. [DOI] [PubMed] [Google Scholar]
- 15.Pannett AA, Thakker RV. Multiple endocrine neoplasia type 1. Endocr Relat Cancer. 1999;6(4):449–473. doi: 10.1677/erc.0.0060449. [DOI] [PubMed] [Google Scholar]
- 16.Bernal-Mizrachi E, Wen W, Stahlhut S, Welling CM, Permutt MA. Islet beta cell expression of constitutively active Akt1/PKB alpha induces striking hypertrophy, hyperplasia, and hyperinsulinemia. J Clin Invest. 2001;108(11):1631–1638. doi: 10.1172/JCI13785. [DOI] [PMC free article] [PubMed] [Google Scholar]
- 17.Vivanco I, Sawyers CL. The phosphatidylinositol 3-Kinase AKT pathway in human cancer. Nat Rev Cancer. 2002;2(7):489–501. doi: 10.1038/nrc839. [DOI] [PubMed] [Google Scholar]
- 18.Brady CA, et al. Distinct p53 transcriptional programs dictate acute DNA-damage responses and tumor suppression. Cell. 2011;145(4):571–583. doi: 10.1016/j.cell.2011.03.035. [DOI] [PMC free article] [PubMed] [Google Scholar]
- 19.Mahapatra S, et al. Global methylation profiling for risk prediction of prostate cancer. Clin Cancer Res. 2012;18(10):2882–2895. doi: 10.1158/1078-0432.CCR-11-2090. [DOI] [PubMed] [Google Scholar]
- 20.Yachida S, et al. Establishment and characterization of a new cell line, A99, from a primary small cell carcinoma of the pancreas. Pancreas. 2011;40(6):905–910. doi: 10.1097/MPA.0b013e3182207a58. [DOI] [PMC free article] [PubMed] [Google Scholar]
- 21.Ozeki C, et al. Cancer susceptibility polymorphism of p53 at codon 72 affects phosphorylation and degradation of p53 protein. J Biol Chem. 2011;286(20):18251–18260. doi: 10.1074/jbc.M110.208587. [DOI] [PMC free article] [PubMed] [Google Scholar]
- 22.Yamashita S, Tsujino Y, Moriguchi K, Tatematsu M, Ushijima T. Chemical genomic screening for methylation-silenced genes in gastric cancer cell lines using 5-aza-2′-deoxycytidine treatment and oligonucleotide microarray. Cancer Sci. 2006;97(1):64–71. doi: 10.1111/j.1349-7006.2006.00136.x. [DOI] [PMC free article] [PubMed] [Google Scholar]
- 23.Frank D, et al. Placental overgrowth in mice lacking the imprinted gene Ipl. Proc Natl Acad Sci USA. 2002;99(11):7490–7495. doi: 10.1073/pnas.122039999. [DOI] [PMC free article] [PubMed] [Google Scholar]
- 24.Ohki R, et al. Reprimo, a new candidate mediator of the p53-mediated cell cycle arrest at the G2 phase. J Biol Chem. 2000;275(30):22627–22630. doi: 10.1074/jbc.C000235200. [DOI] [PubMed] [Google Scholar]
- 25.Yang KC, et al. The cytoprotection of chitosan based hydrogels in xenogeneic islet transplantation: An in vivo study in streptozotocin-induced diabetic mouse. Biochem Biophys Res Commun. 2010;393(4):818–823. doi: 10.1016/j.bbrc.2010.02.089. [DOI] [PubMed] [Google Scholar]
Associated Data
This section collects any data citations, data availability statements, or supplementary materials included in this article.