

Abstract
Positron Emission Tomography (PET), a non-invasive functional imaging method at the molecular level, images the distribution of biologically targeted radiotracers with high sensitivity. PET imaging provides detailed quantitative information about many diseases and is often used to evaluate inflammation, infection, and cancer by detecting emitted photons from a radiotracer localized to abnormal cells. In order to differentiate abnormal tissue from surrounding areas in PET images, image segmentation methods play a vital role; therefore, accurate image segmentation is often necessary for proper disease detection, diagnosis, treatment planning, and follow-ups. In this review paper, we present state-of-the-art PET image segmentation methods, as well as the recent advances in image segmentation techniques. In order to make this manuscript self-contained, we also briefly explain the fundamentals of PET imaging, the challenges of diagnostic PET image analysis, and the effects of these challenges on the segmentation results.
Keywords: Image Segmentation, PET, SUV, Thresholding, PET-CT, MRI-PET, Review
1. Introduction
Structural imaging techniques such as computed tomography (CT) and magnetic resonance imaging (MRI) are widely utilized in clinical practice to examine anatomical abnormalities caused by disease. The three dimensional (3D) images produced by these techniques usually give detailed structural information about one’s anatomy that can be used for diagnostic and therapeutic purposes [1]. However, structural imaging is not well suited for pathology detection applications where cellular activity is more significant than anatomical features [2]. The need for functional characterization leads researchers to develop PET scanners, which provide molecular information on the biology of many diseases. When combined with CT or MRI, utilizing both functional (PET) and structural information leads to a higher sensitivity and specificity than is achievable using either modality alone. Although the sensitivity of PET scans is usually much higher than conventional structural images, anatomical information from another modality (CT or MRI) is still needed to properly interpret and localize the radioctracer uptake and the PET images are somewhat limited due to low resolution. Hence, there is a frequent need for assessing functional images together with structural images in order to localize functional abnormalities and distinguish them from normal uptake of PET radiotracers, which tend to normally accumulate in the brain, heart, liver, kidneys, etc. [3, 4, 5]. PET-CT imaging and more recently MRI-PET have been used to combine complementary diagnostic information from different imaging modalities into a single imaging device, removing the need for registration [6]. Using these scanning techniques, disease can be labeled and identified such that an earlier diagnosis with more accurate staging for patients may potentially be delivered [7].
Some of the statistics for the use of PET imaging in the U.S. is summarized in Figure 1 (a). Over 1, 700, 000 clinical PET and PET-CT studies were reported nation-wide for 2011 only. Compared to single PET imaging, the use of PET-CT is relatively higher and continuing to increase. PET imaging is mostly used for (i) diagnosis, (ii) staging, (iii) treatment planning, and (iv) therapy follow-up, in different fields of medicine such as (1) oncology, (2) cardiology, and (3) neurology (Figure 1 (b)). PET is widely used in staging and follow-up therapy in oncology applications (Figure 1 (c)). For instance, radiation therapy, as a common cancer treatment in oncology, aims to target the boundary and volume of abnormal tissue and irradiates the targeted area with a high dosage of radiation, intending to eliminate all cancerous cells. In practice, the determination of this boundary (i.e., delineation) should be kept as small as possible to minimize damage to healthy tissue, but the boundary must ensure the inclusion of the entire extent of the diseased tissue [2]. PET is also used in cardiac applications such as quantifying blood flow to the heart muscle and quantifying the effects of a myocardial infarction [8]. More recently, PET has been used for imaging inflammation and infection in the lungs [9] with 18F – FDG because this glucose analog localizes to activated and proliferated inflammatory cells. The new norm in clinical practice is acquiring PET-CT images instead of a single PET scan to take advantage of the functional and structural information jointly.
Figure 1.
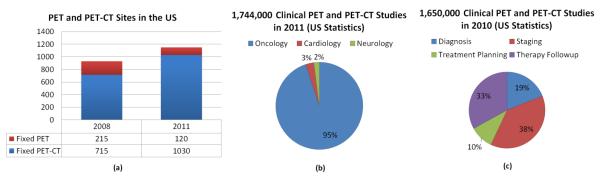
A summary of PET technology used in the U.S is shown in (a) [10]. (b) gives the breakdown of clinical PET and PET-CT studies in 2011 by the branch of medicine. (c) demonstrates 2010 PET technology used in the U.S. for oncology applications, in which PET has been used for mostly staging and follow-up therapy.
In pre-clinical and clinical applications, physicians and researchers use PET imaging to determine functional characterization of the tissues. Owing to this, clinical trials are now placing a greater reliance on imaging to provide objective measures in before, during, and after treatment processes. The functional morphology (the area, volume, geometry, texture, etc.) as well as activity measures–such as standardized uptake value (SUV) of the tissues–are of particular interest in these processes. Accurately determining quantitative measures enables physicians to assess changes in lesion biology during and after treatment; hence, it allows physicians to better evaluate tumor perfusion, permeability, blood volume, and response to therapy. Among these measures, functional volume (i.e., the volume of high uptake regions) has been proven useful for the definition of target volumes [11]. Therefore, an accurate image segmentation method, other than the conventional region of interest (ROI) analysis, is often needed for diagnostic or prognostic assessment. This functional characterization has a higher potential for proper assessment due to recent advances in PET imaging. Indeed, this higher potential has renewed interest in developing much more accurate (even globally optimal) segmentation methods to turn hybrid imaging systems into diagnostic tools [11]. Specifically, after the adoption of multi-modal imaging systems (i.e., PET-CT, MRI-PET), optimal approaches for precise segmentation and quantification of metabolic activities were crucial.
For the literature search, we used Pubmed™, IEEEXplore™, Google Scholar™, and ScienceDirect™and listed all the relevant articles from 1983 to March 2013. Our search also included the methods specifically developed for MRI and CT for comparison (Figure 2). The number of publications for PET image segmentation is further separated by publication type (conference, journal, and total) in Figure 2 (a). As a reflection of the improvements in multi-modality imaging technology (PET-CT and MRI-PET), there was a dramatic increase in the number of publications in 2008 and 2011. For a comparison, Figure 2 (b) shows how the number of publications in PET image segmentation methods compare to the number of CT and MRI based segmentation methods in the literature. Notably, the number of PET image segmentation publications has always been lower than both CT and MRI and was significantly lower before 2007. Figure 2 (c) gives the breakdown on the number of publications for segmentation techniques for PET images from 1984 to 2013. We also noted that only 2% of the articles were review papers and almost half of the total articles are journal papers (42% journal publications and 54% conference publications). For the last 6 years, Figure 2 (d) shows a snapshot of publication types from 2007 to 2013, during which the dramatic increase of PET image segmentation publications was observed. It appears that the growing interest in PET and hybrid imaging will further accelerate the methods for segmentation and quantification of lesions.
Figure 2.

Analysis of publications pertaining to PET image segmentation methods and their applications is shown (from 1983-2012). Journal and conference publications are shown in (a). A comparison of modality dependent image segmentation methods published for MRI, CT, and PET are shown in (b). Further categorization on the published papers has been conducted in (c) and (d) from 1984 to 2012 and from 2007 to 2012, respectively.
In this work, we systematically review state-of-the-art image segmentation methods for PET scans of body images, as well as the recent advances in PET image segmentation techniques. In order to have a complete review on the topic, the necessary knowledge of the physical principles of PET imaging are also given, along with the source of the challenges for segmentation inherent to PET images in Section 2. The state-of-the-art segmentation methods for PET images, their comparison, and recently developed advanced PET image segmentation methods are extensively analyzed in later sections, and the methods are divided into the following groups for clarity: manual segmentation and ground truth reconstruction (Section 3), thresholding-based (Section 4), stochastic and learning-based (Section 5), region-based (Section 6), boundary-based (Section 7), and multi-modality methods (Section 8). These categories are shown in Figure 3. Due to the large number of segmentation methods, we have categorized the state-of-the-art methods into intuitive groups for easier comprehension and better contrasting of the methods. Finally, discussions are made in Section 9, followed by conclusions in Section 10.
Figure 3.

An overview of the categories of PET segmentation methods: Manual segmentation, Thresholding-based, Region-based, Stochastic and Learning-based, Boundary Based, and Joint segmentation methods.
2. Background on PET Imaging and Segmentation
Radiotracers
The basic concept of PET is to label a radio-pharmaceutical compound with a biologically active ligand to form a radiotracer and inject it intravenously into a patient. The PET scanner then measures the distribution and concentration of the radiotracer accumulation throughout the patient’s body as a function of time [12]. To do this, PET utilizes positron emitting radioisotopes as molecular probes so the biochemical process can be measured through imaging in vivo [13]. There have been many radiotracers developed and among them F DG (18F combined with deoxyglucose) is considered the radiotracer of choice in most studies [14]. Metabolically active lesions have up regulation of glucose metabolism. For example, the rapid cell division in cancer cases and the immune response in infectious diseases require high levels of glucose. Therefore, labeling glucose with 18F renders these lesions detectable using PET imaging because the FDG accumulates in these areas [14]. Meanwhile, a large number of new compounds are also becoming prospects for PET imaging which have some advantages over FDG such as tracers that do not accumulate in the heart/kidney. However, FDG still remains the most commonly used radiotracer in the clinical routine for body imaging [15]. At the time of this writing, there is no reported study in the literature mimicking the differences of segmentation accuracy caused by using different radiotracers in PET imaging. Therefore, in this manuscript, an evaluation of image segmentation methods are assumed to be independent of the choice of radiotracer.
Quantitative Evaluation of Radiotracer Uptake in PET Images
A quantitative assessment of changes in FDG uptake in PET images is required for accurate diagnosis and assessment of treatment response, whereas a qualitative assessment of PET images is usually sufficient for the detection of lesions [16]. Qualitative assessments using PET images are often conducted visually by expert radiologists and nuclear medicine physicians [17], while various semi-quantitative and quantitative methods such as SUV, tumor-to-background ratio (TBR), nonlinear regression techniques, total lesion evaluation (TLE), and the Patlak-derived methods are currently undergoing extensive exploration [3]. Among these metrics, SUV is the most widely used quantification index for PET imaging because it gives a physiologically relevant measurement of cellular metabolism [13, 16]. SUV standardizes the intensities of the PET images, and it is simply defined as the tissue concentration of a tracer measured by the PET image intensity at any point of time, followed by a normalization with the injected dose, the patient’s size, and a decay factor which depends on the particular radiotracer type used during the imaging [18, 13]. The explicit formulation of the SUV computation is
| (1) |
where χ is either body weight (χ = BW (in g or kg)) or lean body mass (χ = LBM), depending on the type of SUV being computed [19]. D is the amount of injected dose (Bq) and C(t) is the total radioactivity concentration in a given tissue at time t, and it can be directly computed from a ROI. Exploration of SUV and its alternative measures are outside the scope of this review; however, readers are encouraged to refer to a comprehensive review on this subject [20].
What affects SUV measurements?
There are physiological, physical, and procedural factors affecting the SUV computation. Table 1 briefly explains factors affecting SUV calculation, their effects, and methods proposed to balance these effects. Physiological factors include body composition (fat, weight), blood glucose concentration, and kidney function. Among these, SUV is quite sensitive to body weight, especially for obese patients. High blood glucose concentration can also be problematic with diabetic patients when measuring SUV. Therefore, many techniques were developed to reduce uncertainties in the SUV measurements.
Table 1.
Methods for Correcting Physical and Physiological Factors Influencing SUV Computation
| Physiological Factors | Effects | Corrective Measure | References |
|---|---|---|---|
| Body Composition |
SUV in obese patients overesti- mates FDG |
Use of lean body mass (SUVLBM) or body surface area (SUVBSA) |
[19, 21, 22] |
| Blood Glucose Concen- tration |
Reduced FDG uptake in tissues with increasing glucose levels |
Control blood glucose levels before administering FDG |
[23, 24, 25] |
| Uptake Period | Increase of SUV over time in ma- lignant tissues |
Standardize the time of image acquisition |
[26, 27, 28] |
| Physical Factors | Effects | Corrective Measure | References |
| Respiratory Motion | Reduction of SUVmax up to 7 – 159% |
Respiratory gating or 4D re- construction |
[29, 30, 31] |
| Attenuation correction and reconstruction methods |
Underestimation of SUV with highly smoothed reconstruction by roughly 20% |
Standardize reconstruction algorithm |
[32, 33] |
| PVE | Underestimates SUV in lesions with diameters less than 2-3 times spatial resolution of scan- ner |
Adopt an optimal PVE factor | [34, 35] |
Physical factors consist of the partial volume effect (PVE), reconstruction and smoothing of the images, and respiratory motion (or organ/lesion motion) artifacts. PVE and respiratory motion artifacts lead to an underestimation of SUV for smaller lesions. Various methods have been developed for correcting PVEs; some of these are reported in Table 1. The literature has shown that repeated SUV measurements of the same patient may differ by up to 30% simply from measuring and analyzing variables that influence SUV computation [18, 36].
It is worth noting that the computation of SUVmax can be improved by removing statistical outliers by defining SUVmax differently [37, 38]; however, redefining SUV based on post-processing steps such as a parabolic fit around the maximum intensity may only correct the SUV marginally. So, instead of fitting the data to a predefined curve, averaging the most intense (“hottest”) voxels, which have the highest concentration of photons, together with SUVmax reduces the influence of a noisy outlier [36, 39, 40, 41, 42]. In [39], the repeatability of SUVmax, SUVmean and several ways of averaging the hottest voxels together were investigated and showed a reduced variability by a factor of 2.7 when the top 10 hottest voxels were averaged together to form an alternative way of computing SUVmax.
In addition to these factors, an ROI is needed for SUV computation, and the methodologies used for defining the ROI around a lesion can significantly affect the SUV based metrics. Therefore, in order to extract morphological and functional information from PET images, the ROI needs to be identified “precisely”. In other words, a precise segmentation is needed because even small errors in segmentation can distort the calculation of the SUV measurements by altering the region’s margins. Furthermore, inter- and intra-operator variability can be considerably high in defining these ROIs, affecting quantitation and possibly diagnostic decisions.
Challenges in Segmentation of PET Images
Without loss of generality, image segmentation can be thought of as two related tasks: recognition and delineation [43]. Recognition is the process of determining “where” the object is and to distinguish it from other object-like entities in the image, and delineation is the act of defining the spatial extent of the object region in the image [44]. In the recognition process, high uptake regions are observed and identified by clinicians. These rough areas of where the objects are located in the image are considered as ROIs, though this process can be automated as well [45]. In delineation, the second step of segmentation, the aim is precise separation of uptake regions from the background and non-significant uptakes [43, 46, 47]. Some of the intrinsic and extrinsic factors that significantly affect PET image segmentation are as follows:
resolution related issues,
large variability in the shape, texture, and location of pathologies,
noise.
These factors increase the difficulty of segmentation in multiple ways. For example, the low resolution and high smoothing decreases the contrast between objects in the image, and boundaries between nearby objects often become unclear. Several additional factors can be counted under resolution related issues. For instance, patients are sometimes unable to hold their breath during an entire scan, and motion artifacts may occur. These artifacts from breathing blur the images severely [48]. Second, the large variability in shape or texture of the pathologies makes the segmentation problem even more challenging due to difficulty in generalizing the available PET segmentation methods for those cases. Last, noise in PET images is inherently high, leading to further difficulties in image segmentation methods that tune parameters based on the value of the SUVmax as well as methods that use the intensity of an initial “seed” location. As demonstrated in [49], noise affects the segmentation of PET images and is regarded as the most significant contributing factor for not having a reproducible SUV measurement.However, some standards and guidelines have been enacted to ensure more reproducible analyses between scans and centers [50, 51].
Given the difficulties defined above and the unique challenges pertaining to PET images, there have been considerable improvements in PET image segmentation methods. These improvements are primarily due to the need of accurate and robust quantification tools that have the capability of analyzing multi-modal images in real time. An explosive growth in the use of PET-CT and more recently MRI-PET in clinics facilitates this need.
3. Manual Segmentation: Ground Truth Construction and Segmentation Evaluation
Ground Truth Construction
An overview of the categories that PET image segmentation methods are classified into is given in Figure 3. Before introducing the various PET image segmentation methods as summarized in Figure 3, it is useful and necessary to know the standard ways of evaluating the accuracy of segmentation for proper comparison. In order to evaluate an image segmentation algorithm, the true boundary of the object of interest should be identified. Unfortunately, there is no ground truth available if histopathologic samples are not available. This is the main challenge for all medical image delineation algorithms. Instead, surrogate truths (or reference standards) are used for measuring the quality of a segmentation algorithm. Using phantom images is one way to create a surrogate truth for measuring the performance of an algorithm. Phantoms have the benefit of knowing the exact dimensions of the object in the image. Additionally, a digital phantom, i.e. a synthetic image, can be constructed where the true boundary is known and imaging characteristics of a specific PET scanner can then be added [52]. However, the human anatomy is far too complex to be accurately represented via phantoms; hence, the use of phantoms is limited in terms of identifying the extent and true performance of the segmentation algorithms.
Another way, the most common one, is to use manually segmented structures and compare those structures with algorithm-generated segmentations in terms of overlap or boundary differences [53]. This strategy is currently the state-of-the-art segmentation method for the evaluation and development of medical image segmentation problems. Although it is important to incorporate as many manual segmentations as possible into the evaluation framework in order to reduce sampling error occurred due to the inherent high variations and inter-observer differences, it is often necessary to statically combine all these segmentations together to form a single ground truth for evaluation. The widely used Simultaneous Truth and Performance Level Estimation (STAPLE) method deals with this problem [54]. STAPLE estimates the ground truth segmentation by weighing each expert observer segmentation depending on an estimated performance level while also incorporating a prior model for the spatial distribution of objects being segmented [54].
Segmentation Evaluation
After creating a surrogate truth, there are three main categories of approaches for this task: quantifying volumetric differences, using estimators derived from the confusion matrix, shape based similarity measures, and regression based statistical methods. The volumetric difference is usually determined by simply computing the absolute percent difference in total volume between two segmentations. Since it is such an intuitive and simple metric, the percent volume difference is commonly used in the clinical literature, but this metric alone does not convey enough information to determine the similarity between two segmentations. For instance, it is highly possible for a segmentation method to produce the same volume as the volume of the ground truth, but the segmentation may still be unsatisfactory (i.e., segmentation leaks into non-object territory with some amount of volume, but still the same volume of ground truth can be obtained). Indeed, more quantitative metrics must be used along side for proper evaluation.
There are several estimators that are derived from the confusion matrix that are commonly used for segmentation evaluation. First, the dice similarity coefficient (DSC) is one of the most widely used quantitative metrics to evaluate segmentation accuracy, and this index allows for the false positives and false negatives to be combined into a single value for easy comparison [55, 56]. DSC simply measures spatial overlap (in percentage) between a segmented lesion and the surrogate truth where higher DSC values indicate the goodness of an image segmentation. Given that the segmented volume is denoted by V1 and the surrogate truth is shown by V2, the DSC is computed as follows:
| (2) |
where the overlap of two volumes (V1 ⋂ V2) indicates the True Positive Volume Fraction (TPVF) (also called sensitivity). The amount of false positive volume segmentation is measured in the False Positive Volume Fraction (FPVF) such that 100-FPVF is the specificity [47, 57].
For evaluating the segmentation of complex shaped lesions, boundary-based measures should be used in addition to region based metrics to quantify the shape dissimilarity between the delineated lesion and the ground truth [45, 57]. Geometric metrics such as the Hausdorff distance (HD) measure how far two boundaries are from each other [58]. Thus, an accuracte segmentation result would achieve a high DSC value (high regional overlap) and a low HD value (high shape similarity). The DSC and HD are commonly reported together in the literature for a more thorough evaluation.
Regression based statistical methods (i.e., Spearman and/or Pearson correlation coefficients) and the simple mean volume difference or relative volume ratio for the evaluation of segmentation methods are much more common than DSC based evaluations in clinical literature. However, readers should be aware that without having the TPVF (Sensitivity) and 100-FPVF (Specificity) pair or the DSC value, comparing statistics on the absolute volume difference does not provide complete information on segmentation accuracy. In addition to sensitivity and specificity, receiver operating characteristic (ROC) curves may be used to evaluate the performance of a delineation method by combining sensitivity and specificity of the PET segmentation algorithms for a given uncertainty level [59, 60].
In summary, a precise evaluation for a segmentation algorithm should be based on sensitivity and specificity measures (or DSC) and not solely on the absolute volume based statistical evaluations. Unless otherwise specified, we assume that all research papers listed in this review completed sensitivity and specificity comparisons for the proposed segmentation methods, even though some of those studies reported only volume based evaluations. It is also worth noting that DSC or sensitivity/specificity measures are region-based evaluation criteria. For a brief review on segmentation evaluation metrics, readers are encouraged to refer to [47, 55].
Difficulties in Manual Segmentation
Manually drawing a boundary around an object on the image is perhaps the most intuitive and easily implemented way of obtaining ROIs for a given image which makes it the most common method of obtaining surrogate truths, as described previously. However, it suffers from many drawbacks. Manual segmentation is highly subjective and intra- and inter-operator agreement rates are often presented in the literature to indicate the reliability of the obtained surrogate truths and the level of difficulty of the segmentation problem [61, 62, 63, 64, 65, 66].
The major drawbacks of manual segmentation are that it is time consuming, labor intensive, and operator-dependent. The high intra- and inter-operator variability of the resulting delineations make the delineation process less precise and unlikely reproducible. In a recent study [72], which involved 18 physicians from 4 different departments, the agreement, defined as a volume overlap of ≥ 70%, was found only in 21.8% of radiation oncologists and 30.4% of haematologic oncologists. It appears that a partial explanation for this high intra-observer variability for manual segmentation may be attributed to the size of the lesion because smaller lesions (i.e., < 4cm3) suffer much greater from the partial volume effect [73]. This causes the boundaries of objects to be blurred and unclear, making manual segmentation problematic. Table 2 exemplifies this high variation over a few studies reported in the literature. For seven studies, either the inter- and intra-observer variance is reported or the reliability coefficient is reported. The reliability coefficient is very similar to observer agreement rates, and it quantifies the consistency among multiple measurements on a scale from 0 to 1 [74]. Higher reliability means lower inter- and intra-variability. However, it should be noted that reliability does not imply validity. The reliability coefficient can be defined as the proportion of the total variance of interest that represents the true information being sought. More information about reliability coefficient can be found in [75]. Even among these recent highly cited studies, there is no consensus on how variable manual segmentation is as well as the experience level of the experts conducting the manual delineation.
Table 2.
Manual segmentation variability by expert radiologists - the gold standard: Intra- and Interobserver percent variability is the average percent variation in the segmentation volume. The reliability coefficient is used to quantifies the consistency among multiple measurements on a scale from 0 to 1, where 1 indicates most reliable, and 0 shows unreliable.
4. Thresholding-based Methods
Thresholding is a simple, intuitive, and popular image segmentation technique that converts a gray-level image into a binary image by defining all voxels greater than some value to be foreground and all other voxels are considered as background [76]. The thresholding-based PET image segmentation methods utilize the probability of intensities, usually by using the histogram of the image. An intuitive view on this process is that the objects of interest in the PET image, usually referred to as the highest uptake region, are much smaller than the background areas. A smaller area equates to a smaller probability of appearing on the image. Additionally, since the intensity of PET images has some physical meaning, the intensities are somewhat unique for the different tissue types and grouping specific ranges of the intensities for different objects is usually enough for a good segmentation. How to group these intensities together is the challenge, and thresholding is one approach to solve grouping problems.
Due to the nature of PET images (i.e., low resolution with high contrast), thresholding-based methods are suitable because the local or global intensity histogram usually provides a sufficient level of information for separating the foreground (object of interest) from the background. However, there is some uncertainty that cannot be avoided when using thresholding-based methods. Because of the large variability of pathologies, low resolution, inherent noise, and high uncertainties in fuzzy object boundaries, there is no general consensus on the selection of a thresholding level (especially automatic threshold selection). Therefore, an optimal threshold determination remains a challenging task. Despite all these difficulties, thresholding-based methods are still under development for improving the segmentation mechanism towards the optimal boundary extraction. Hence, it is common to see these methods both in pre-clinical and clinical studies. Here, we will review state-of-the-art thresholding-based segmentation methods for PET images and their comparisons using clinical data. Thresholding techniques can be further divided into several groups: Fixed Thresholding, Adaptive Thresholding, and Iterative Thresholding Method. Also, we describe the challenges and drawbacks specifically pertaining to thresholding segmentation as well as the effects of the partial volume effect and the effects of different reconstruction algorithms.
4.1. Fixed thresholding
In fixed thresholding, as its name implies, all pixels above an intensity level are assigned to a group, and everything else is considered to be background. This level may be given as an input by an expert, learned in a training set of images of the same type, or derived by analytic expression using realistic phantoms. The object boundary in any PET image is going to contain some amount of fuzziness due to the PVE, resolution related issues, and motion artifacts [76]. Thus, many thresholding methods incorporate some amount of class uncertainty, entropy criteria, between-class variance, and many other types of criterion in order to account for this fuzzy object nature [76]. In many clinical studies, a value such as a SUV of 2.5 is set as a pre-defined threshold level to differentiate malignant lesions from benign [48]. Similarly, SUVmax can also be used to separate object information from the background by using a specific percentage of SUVmax, which has the advantage of being normalized between patients. The most common thresholding value chosen in the clinical setting is 40 – 43% of the SUVmax, but this may not always work well and may need to be adjusted considerably for different PET images, depending on the image properties, scanner type, reconstruction, image noise, etc. For example, several studies evaluated the commonly accepted thresholding value of 40 – 43% for segmenting lesions and found that this value was suitable in a broad sense. The authors suggested other thresholding values to obtain the correct boundaries such as 45% [77] and 78% [78, 79]. Another drawback of this fixed thresholding approach is the tendency to overestimate the lesion boundaries, particularly for small lesions. Therefore, an adaptation of thresholding with further information or user guidance is often necessary in order to provide a clinically sound delineation. Table 3 shows some of the notable studies in the literature that used a fixed thresholding method for segmenting lesions from various body regions. It lists the thresholding value chosen, anatomical area (or disease type), sample size, and the accuracy reported in the study. As can be seen from Table 3, since there is no consensus on a fixed thresholding method for segmenting PET images, variable results were reported even for similar lesion types.
Table 3.
Example studies using fixed-threshold based PET segmentation
| Segmentation Method |
Anatomical Area | Sample Size | Accuracy | References |
|---|---|---|---|---|
| T 42% | Static phantom | 3 elliptical spheres 4 SBR |
Mean volume deviation (%): 8.4% |
[80] |
| T 34% | Moving phantom | 3 Spheres 3 Motions |
Difference from ideal ranged from 3 to 94 cm3 for motion volumes of 1.2 to 243 cm3 |
[81] |
| T 34% | Moving lollipop phantom |
1 Sphere with 3 longitudinal movements |
Volume deviation from ground truth (%): 1.4 ± 8.1% |
[82] |
| T 50% | Intact squamous cell carcinoma |
40 Patients | Volume deviation from CT (%): 54.5% |
[83] |
| T 50% | NSCLC | 101 Patients | Volume deviation from CT (%): 27 ± 3% |
[84] |
|
T42% : < 3cm T24% : 3 – 5cm T15% : > 5cm |
NSCLC | 20 Patients | Determined threshold values such that the volumes were exactly the ground truth |
[85] |
| T40%, SUV2.5 | NSCLC | 19 Patients | Median volume deviation from CT (%): −140%, −20% |
[86] |
| Manual, T40%, T50%, TSBR |
Oral cavity, oropharynx, hypopharynx, larynx |
78 Lesions | Mean overlap fraction (CT): 0.61, 0.55, 0.39, 0.43 |
[77] |
| Manual, SUV2.5 T40%, TSBR |
NSCLC | 25 Lesions | Mean GTV (cm3): 157.7, 164.6, 53.6, 94.7 Mean Radius (cm): 3.03, 3.05, 2.18, 2.52 |
[79] |
| T43%, SUV2.5 | Rectal and anal Cancer |
18 patients | 55.4 ± 18.3, 36.7 ± 38.4 Vol- ume difference compared to manual delineation |
[87] |
|
TSUVmax, TIterative, TBgd, FIT |
Nonspherical simulated tumors inserted into real patient PET scans |
41 Lesions | Mean error volume (%): −50% ± 10%, −40% ± 40%, 4% ± 10%, 24% ± 20% |
[88] |
| TSBR | NSCLC | 23 Tumors | Compared to Histopathol- ogy: Sensitivity: 66.7% and Specificity: 95.0% Compared to Manual Seg- mentation: Sensitivity: 55.6% Specificity: 88.3% |
[89] |
| T42%, T50%, FCM | Sphere phantoms with diameters 13 - 37 (mm) |
6 Spheres using 4 scanners |
Classification error (%): 42.6 ± 51.6, 20.3 ± 18.5, 27.8 ± 25.6 |
[67] |
| Manual, TSBR, T40%, T50%, SUV2.5 |
High-grade gliomas | 18 patients | Mean Overlap Fraction (PET): 0.61, 0.62, 0.57, 0.67, 0.67 Mean Overlap Fraction (MRI): 0.45, 0.44, 0.54, 0.36, 0.14 |
[78] |
| Manual, TBgd20% ,TBgd40%, SUV2.5, T40% |
Esophageal Carcinoma |
96 Tumors | Mean length of tumors (cm): 6.30 ± 2.69, 5.55 ± 2.48, 6.80 ± 2.92, 6.65 ± 2.66, 4.88 ± 1.99, 5.90 ± 2.38 |
[90] |
| Gradient Based, TSBR, T40%, T40% |
Stage I-II NSCLC | 10 Patients | DSC: 66%, 64%, 62%, 65% | [91] |
Patients had various number of tumors
TBgd: = ∊*T70% + mean background intensity
TBgdα = SUVBgd + α(%) * (SUVmax - SUVBgd)
4.2. Adaptive thresholding
Many fixed thresholding-based segmentation methods use digital or physical phantoms to construct and quantify the relationship between the true lesion volume and the estimated lesion volume, with respect to various image quality metrics to “adapt” the thresholding value for a particular image of interest. The source-to-background ratio (SBR or S/B), mean background intensity, estimated mean lesion intensity, and full width half maximum (FWHM) of the scanner can be used as potential image quality metrics for this purpose.
In addition to adapting the thresholding value based on image quality metrics, it is also possible to adapt the thresholding value based on the motion artifacts of the PET image. As described previously, it lowers the contrast and mean intensity difference between the object and the background. For instance, some phantom based studies characterized the thresholding level of oscillating spheres instead to static spheres in order to mimic breathing and cardiac motions in [93]. Although adapting the threshold level to accommodate breathing and cardiac motion may have important applications for segmenting lung cancers or inflammation in the lungs when respiratory gating is unavailable, the method presented in [93] suffers from serious shortcomings such as the requirement of a prior estimation of lesion volume from structural imaging [38]. When a prior estimation of the lesion volume does not exist (possibly due to a lack of a corresponding CT or MRI image), success rates of the delineations are restricted to lesions larger than 4 cm3. For small lesions, even with prior anatomical knowledge, the success rate is under the desired clinical accuracy.
Table 4 lists some of the state-of-the-art adaptive thresholding equations in the literature, which were validated using various phantoms. The studies in Table 4 are organized based on the same year of publication, with the earliest year at the top and the most recent year at the bottom. Studies in same year are in no particular order. Notably, the analytic expressions grow increasingly complex as the years advance with earlier studies only considering the estimated lesion volume while later studies also take into consideration the resolution of the scanner and various image quality metrics. The volume difference between the segmentation found using the analytic expression and the ground truth is reported. This volume difference is divided between the volume difference when the method is applied to phantom images or patient images for a better comparison, if reported in the study.
Table 4.
Examples of adaptive thresholding equations used in segmenting lesions from PET images
| Analytic Expressions | Notes | Volume Difference1 |
References |
|---|---|---|---|
| T(%) = A*e−C*VmL | Parameters A,C are coefficients computed for each SBR. First to use the SBR to estimate the thresholding level. |
8.4%, NA | [80] |
| SUVCutOff = 0.307* SUVmean + 0.588 | Iteratively selected the mean tar- get SUV |
21%, 67% | [94] |
| T(%) = 0.15* Imean + SUVBgdmean |
Imean is approximation of mean intensity of tumor. Bgdmean is mean intensity in relevant back- ground structure. |
NA, 60.1% | [79] |
| T(%) = 59.1 − 18.5*log(V) | Fitted a logarithmic regression curve to threshold values in PET that resulted in the same volume from CT |
NA | [85]2 |
|
T(%) = SBR* (SUVmax − SUVBgdmean) + SUVBgdmean |
Considered influence of differ- ence between target and back- ground intensities |
47.3%, NA | [95] |
|
T(%) = SUVBgdmean + (Threl)*(SUVmax − SUVBgdmean) |
Threl = Relative threshold cor- responding to the physical diam- eter of the source. Used Threl to approximate the image trans- fer function at the interface be- tween lesion and background. |
Spheres > 15mm accurate to ≤ ±1mm |
[96] |
| Initialization for an iterative thresholding method |
10%, 16.6% | [37] | |
|
T(%) = 90.787*e(−0.0025*Area) T(%) = 0.00154*Area + 28.77 |
Area < 448mm2 Area ≥ 448mm2 |
13.8%, NA | [97] |
| Diameter > 30 mm a = 0.50, b = 0.50 Diameter ≤ 30 mm a = 0.67, b = 0.60 |
4.7%, 7.5% | [98] | |
|
|
Sphere inner diameter ≤ 10mm Sphere inner diameter > 10mm Considered scan duration and initial injected activity in model. |
NA | [99]2 |
| An iterative technique based on Monte Carlo simulation studies |
5.1%, 11.1% | [100] | |
| T(%) is normalized to back- ground. x is Volume in cm3, y is the motion in mm, z is the SBR Considered how motion in moving lung tumors affects the thresholding |
Withing 2 mm of CT volume |
[101] | |
|
|
Cross sectional area ≤ 133mm2 Cross sectional area > 133mm2 Considered the resolution of the scanner for small objects where the PVE has a significant effect by including the full width half maximum (FWHM) of the point spread function of the scanner |
NA, 6.62% | [102] |
Volume difference is the difference between the volume found from the adaptive thresholding segmentation and the ground truth. Left is the volume difference when method is applied to phantom images while Right is the volume difference when the method is applied to patient scans.
These studies used spherical phantoms to determine the thresholding level that gives the true volume and then fitted these values to a curve without testing against test images.
Overall, the major limitation in analytic expression based thresholding methods is that it is difficult to reproduce the same/similar segmentation results in different scanners or different patients [38]. This is because analytic expressions require precise tuning for a specific scanner, the reconstruction type, and even the patient size. Another drawback is that these expressions normally fail for lesions with a complex shape, due to an invalid analytic model for those cases (e.g. the partial volume would affect complex-shaped lesions differently then the spherical-shaped lesions). Also, it is very important to note that because of the limitations of representing anatomical structures and metabolic activities realistically, the construction and calibration of analytic expressions introduce uncertainty to the task of finding an optimal thresholding level; therefore, none of the studies listed in Table 4 are general enough to be used in clinical applications, particularly in radiotherapy planning and surgery.
4.3. Iterative thresholding method (ITM)
Commonly used adaptive thresholding methods in PET segmentation require a priori estimation of the lesion volume from anatomic images such as CT or analytic expression based on phantom geometry; however the iterative threshold method (ITM), proposed by Jentzen et al [37] estimates the PET volumes without anatomic prior knowledge. The ITM iteratively converges to the optimum threshold to be applied to the PET image. The method is based on calibrated threshold-volume curves at varying S/B ratio acquired by phantom measurements using spheres of known volumes. The measured S/B ratios of the lesions are then estimated from PET images, and their volumes are iteratively calculated using the calibrated S/B-threshold-volume curves [97, 103]. The resulting PET volumes are then compared with the known sphere volume and CT volumes of tumors that served as gold standards.
This process is illustrated in Figure 5. The ITM begins by obtaining several curves that are observed at typical S/B ratios from the PET images. The calibrated S/B-threshold-volume curve that best fits the measured S/B ratio is then used. For the selected S/B-threshold-volume curve, there is a fixed-threshold value T1 (fixed-threshold region) for large volumes that is applied to the PET image and an initial estimation of the volume (V1) is made using the ellipsoid model. The volume V1 is used further to determine the second threshold value T2. If the value T2 is significantly larger than T1, then the threshold value T2 is applied again to the gray scale of the PET image and a second volume V2 can be calculated. If the threshold values T2 and T3 are not significantly different, the iteration stops at step 3 with an estimated volume V3, the iteration ends at step n with an estimated volume Vn if the threshold value Tn does not deviate significantly from Tn+1. An example delineation process is given in Figure 6 where optimal threshold was found in 4 iterations.
Figure 5.

Iterative thresholding method for finding optimal thresholding value.
Figure 6.
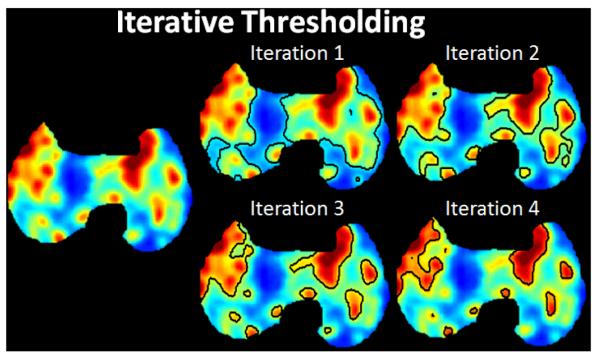
The segmentation result at each iteration using the ITM is shown.
Unlike most adaptive thresholding methods, ITM does not require any prior information of the volume of interest. It only requires (a) the S/B ratio of the lesion easily taken from the PET image and (b) the S/B-threshold-volume curve to be determined once for the specific camera, reconstruction algorithm, and the radiotracer. However, it is important to note here that S/B-threshold-volume curve depends on the type of reconstruction algorithm used, especially for the small structures. Also the S/B-threshold-volume curve strongly depends on the spatial resolution of the imaging device. The ITM is further limited by the spatial resolution, implicit activity distribution, edge detection, and volume model of the lesion. For lesions with an effective diameter close to the spatial resolution of the scanner, the ITM method cannot be applied due to the PVE. Also, the ITM estimates the volume reliably only if the imaged activity distribution is homogeneous. The asymmetric activity distribution results in an underestimated volume. Additionally, the measurement of the S/B-threshold-volume curves assumed spherical lesions, and the clinical PET and CT volume calculations were performed using an ellipsoid model. Therefore, these suppositions are only an approximation of the irregularly shaped tumors. As a consequence, the clinical volume estimation may be less than accurate.
4.4. Optimal choice of thresholding, partial volume and reconstruction effects on thresholding
From the conclusions reported in [103, 104, 105], the conditions to obtain an accurate (i.e., exact or very close) delineation of objects in PET images using thresholding are very strict. Considering an object whose largest diameter is less than ten times the image resolution, given as the FWHM of the point spread function (PSF), there exists a single threshold value that allows the true contours of the object to be accurately recovered if and only if
the object is spherical,
the uptake is uniform inside and outside the object, and
the PSF is isotropic and constant over the whole field of view.
For all other conditions, where non-spherical uptake occur or uptake is non-uniform, the choice of an optimal threshold selection is ill-posed problem; therefore, theoretical justification is not always possible [106].
Thresholding methods do not perform well with tumors that are less than 2 - 3 times the spatial resolution of the scanner [34, 35, 79, 80, 97, 99, 102, 107, 108]. This is because the scanner’s PSF introduces the PVE. PVE comes from two sources: finite spatial resolution of imaging system and the discrete nature of PET images. Since PET is of low spatial resolution compared to CT or MRI, this factor is significant for PET imaging and most methods aim at this problem. New techniques such as digital photon counting (Philips Vereos PET/CT) is being explored to promote the resolution [109]. Furthermore, the continuous distribution of radiotracer is sampled to discrete voxels of PET images. Therefore, most voxels contains more than one tissue and the uptake value is the average of the response from all tissues within the voxel. This rule applies to all digital imaging modalities regardless of their spatial resolution. PVE is a major source of bias for PET quantification and several techniques have been proposed for PVE correction. During the reconstruction phase, spatial resolution can be enhanced by incorporating PSF information; anatomical information from CT or MRI can further be utilized as priors for better reconstruction. Deconvolution can also be applied for the purpose of resolution enhancement after reconstruction. To model the mutual influence between regions within image domain, Recovery Coefficient (single region) and Geometric Transfer Matrix (multiple regions) can be pre-calculated according to the approximate size and shape of the target regions. Such corrections are simple but limited to mean value correction only and the assumptions of homogeneity and shape. More sophisticated methods targeting voxel level correction often make use of co-registered high resolution anatomical information from CT or MRI to define the structures and boundaries between regions. The PVE factors can subsequently be obtained by modeling the interaction between regions.
In practice, for smaller tumors, a 5% thresholding change can cause the measured volume to change by a factor of two [79, 80, 102, 108]. It is explained in [99] that the near optimal thresholding value for small volumes depends largely on the size or diameter, due to the PVE being more influential while the optimal threshold value of larger objects has more functional dependence on the SBR. This is why many analytic thresholding expressions are piecewise linear and based on the estimated area or diameter of the lesion. Since SUVmax is the least affected by the PVE [34, 89], there are many equations that use a percentage of the SUVmax to determine a reasonable threshold level (see Table 3, relative thresholding). For an in-depth review on PVE in PET imaging, a survey paper is referred [34].
Reconstruction methods also affect thresholding based segmentation algorithms. As a whole, reconstruction methods used for PET images vary on the amount of smoothing done, especially when attempting to compensate for the high noise of PET images. In addition, greater smoothing increases the difficulty of thresholding because an image with significant smoothing has a smaller absolute range of intensity values, such that a higher thresholding value is required to compensate for the decrease in contrast [102, 108, 110]. In addition, this in turn lowers the range of thresholding values that can be chosen to achieve an acceptable segmentation which makes it more probable that a non-optimal thresholding value is chosen. In [110], five different segmentation algorithms were compared with respect to various reconstruction algorithms, and it was found that SUVmax and SUVmean-based fixed thresholding segmentation methods resulted in much larger volumes when high smoothing methods were used in the reconstruction process. Ideally, the method for threshold selection would compensate for the effect of reconstruction smoothing, though currently this is not considered. For detailed results on the effects of smoothing with reconstruction algorithms and threshold levels, reader may find useful information in [38, 108].
Thresholding methods have proven to be simplest yet computationally the most efficient segmentation method. Their sensitivity to noise and incapability to handle intensity variations make them less than an ideal candidate for complex segmentation tasks in medical image analysis. Furthermore, with the exponential increase in the computational capabilities of hardware onboard medical devices over the past decade, the algorithmic simplicity of thresholding-based methods is becoming less attractive.
5. Stochastic and Learning-based Methods
Stochastic methods exploit differences between uptake regions and surrounding tissues statistically. Learning-based methods, similarly, use pattern recognition techniques to statistically estimate dependencies in the data. Since there are strong similarities between learning-based methods and stochastic methods, in this section we introduce the core concepts of the both groups together (Figure 7).
Figure 7.
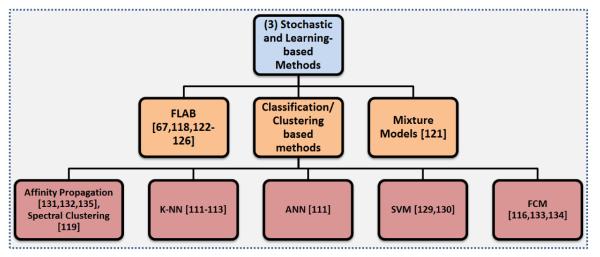
An overview of the Stochastic and learning-based segmentation methods.
5.1. Mixture models
The intensity distribution of objects within PET images are commonly considered to be approximately Gaussian in shape, and this prior knowledge can be useful for segmentation. Gaussian Mixture Models (GMM) assume any distribution of intensities on the PET image can be approximated by a summation of Gaussian densities with the goal of identifying and separating these densities using an optimization technique such as the Expectation Maximization (EM) algorithm. There are currently several state-of-the-art GMMs in the literature that we will highlight here [118, 121]. A GMM-based segmentation technique was created in [121], and three tissue classifications were considered: background, uncertain regions, and the target. A user defined ROI was required to initiate the algorithm, and the EM method was used to estimate the underlying Gaussians. Then, the voxels were assigned to one of the three classes. From these regions, the segmentation was constructed. The algorithm was evaluated on PET images of tumors from non-small cell lung cancer patients and performed favorably compared to 40% SUVmax and to the adaptive thresholding method.
5.2. Fuzzy locally adaptive Bayesian (FLAB) method
Another approach that uses Gaussian mixtures of the objects is a locally adaptive PET segmentation method based on Bayesian statistics [118]. This method is known as fuzzy locally adaptive Bayesian (FLAB) segmentation. FLAB is an unsupervised statistical method that considers the image as having two hard tissue classes and a finite level of “fuzzy levels” that includes mixtures of the hard tissue classes. Due to the fuzzy properties of the model, FLAB allows the co-existence of voxels to belong to one of two hard classes, where voxels belonging to a “fuzzy level” depend on its membership to the two hard classes. A ROI identification step is necessary to perform FLAB (like most of the other PET segmentation methods); therefore, it is not fully automated. Although FLAB has been shown to be quite robust and reproducible [118, 67] for tumor volume assessments, ROI identification may be difficult when heterogeneous or high uptake regions occur [122]. Since heterogeneous or high uptake regions could be close to the object of interest, placing the ROI with these restrictions can in some cases be difficult. Moreover, a significant number of background voxels are necessary for accurate statistical modeling of tissue classes, so the number of background voxels should be small enough to avoid nearby uptake regions to be involved in model computation, other than the lesion of interest. In addition, the use of FLAB for the segmentation of heterogeneous lesions is limited to only two classes (background and foreground); therefore, FLAB may fall short when dealing with more than two classes.
Fortunately, an improved version of FLAB was recently published to deal with heterogenous uptakes by allowing up to three tumor classes instead of just the two hard classes of the initial version of FLAB [123]. The improved version, named 3-FLAB, had a higher accuracy and robustness as compared with adaptive threshold and FCM with a mean classification error of less than 9% ± 8%. Additionally, the accuracy [124], robustness [67], and reproducibility [125], as well as its clinical impact have been demonstrated in numerous papers [126, 127, 128, 129].
5.3. Clustering/Classification of PET image intensities
Classification methods seek to partition a feature space derived from the image by using data with known labels [130]. Due to the requirement of training data for labeling the data, classifiers are known as supervised methods. The most common feature is image intensity itself. Classifiers can transfer the labels of the training data to new data as long as the feature space sufficiently distinguishes each label as well [130]. However, a disadvantage of supervised methods is that they generally do not incorporate spatial information into the decision of labeling, and the requirement of manual interaction to obtain training data is very labor intensive and time consuming. This eventually increases the computational complexity.
Similar to the classification methods, clustering methods can utilize the spatial information contained within the PET images but without the use of training data [131]. Since these methods do not need training data, they are termed unsupervised methods. Compared to supervised methods, clustering methods have less computational complexity; however, they are sensitive to noise and cannot integrate spatial information well due to inherent uncertainty of the data.
Examples of supervised and unsupervised methods used in PET segmentation include k-nearest neighbor (k-NN) [111, 112, 113], support vector machine (SVM) [132, 133], Fuzzy C - Means (FCM) [116], artificial neural network (ANN) [111], and more recently Affinity Propagation (AP) [134, 135] and spectral clustering [119]. Clustering methods aim at gathering items with similar properties (i.e., intensity values, spatial location, etc) into local groups. Similar to some advanced thresholding methods, clustering can also entail hard and soft boundaries or “fuzzy” objects [11]. These methods usually take similarities between data points as inputs and outputs a set of data points that best represent the data with corresponding labels (i.e., foreground, background). Clustering is very useful particularly when the shapes of the uptakes regions are non-convex with a heterogeneous background. Non-convex regions are quite common for different diseases, in particular pulmonary infections; hence, there is a growing interest in the use of clustering based methods to segment complex shaped uptake regions [134, 135].
The spectral clustering method has been shown to have the potential to accurately delineate tumors containing inhomogeneous activities in the presence of a heterogeneous background in [119]. However, the number of tumors segmented in the study was limited, and there was no clear consensus on the choice of similarity parameters, which might not be optimal when only intensity values are used as similarity parameters. Another common clustering method, FCM, was used in PET segmentation context first in [136], and it has been used mainly for PET brain lesion segmentation since [136, 137]. The FCM algorithm classifies voxels into one of two groups, based on “fuzzy” levels where, due to the low resolution and the PVE, a particular voxel is allowed to included a mixture of multiple tissue types. FCM then decides which tissue type the voxel is most likely to belong to (i.e., it has more of one particular tissue type in the voxel over any of the other possible tissue types). Finally, the algorithm cuts the clusters into a foreground and background using a graph-based approach and converges to the global optima iteratively.
Most PET segmentation techniques are suited well for the determination of focal uptake, but generally give poor segmentation results for diffuse and multi-focal radiotracer uptake patterns such as those seen in infectious lung disease (Figure 8). However, a recent study proposes a PET segmentation framework uniquely suited for the segmentation of these difficult uptake patterns [134, 135]. This method utilized a novel similarity function that estimates the “similarity” (or affinity) of the data points on the histogram on the image(s) within the AP platform [138]. AP then uses these similarities to select the optimal thresholds to separate the image into multiple regions. In particular, [134] demonstrates the usability for quantification of small animal infectious disease models such as rabbits with tuberculosis or Ferrets with H1N1 (swine flu).
Figure 8.

Left: A representative slice (segmented to remove non-lung regions) showing focal radiotracer uptake in a small animal model while Right: demonstrates multi-focal/diffuse uptake patterns in a rabbit model infected with tuberculosis (5 weeks). Most PET segmentation techniques focus on segmenting the focal uptakes while ignoring the diffuse uptakes that occur in infectious pulmonary disease.
Table 5 lists some landmark studies that utilize clustering methods for PET image segmentation. The classification method used along with the other PET image segmentation methods are listed in the first column of Table 5. Also, the sample size and the types of images used in the studies (such the type of phantom used or the type of disease if the studies used patient images) are listed in the second column. The quantitative results, as reported in the studies, are listed in the third column.
Table 5.
Examples of the performace of classification algorithms in PET segmentation
| Classification Method | Sample Size | Results | References |
|---|---|---|---|
|
k-NN, ANN, Adaptive Thresh- olding |
6 Phantom spheres | Absolute relative error(%)* 6.83, 0.28, 7.61 |
[111] |
| k-NN | Monte Carlo simu- lation using Zubal whole-body phan- tom as prior |
Dice similarity: ~ 80% - 85% | [112] |
| k-NN, SUV2.5, T50%, TSBR | 10 Head and neck cancer patients |
Sensitivity, Specificity: 0.90, 0.95 - 0.93, 0.84 - 0.48, 0.98 - 0.68, 0.96 |
[113] |
| k-Means, MRF, Multiscale MRF | 4 Lesions | Volume difference (%): 9.09, 6.97, 5.09 |
[114] |
| k-Means, MRF, Multiscale MRF | 6 spheres using the NIRMPA phantom |
Volume difference (%): 42.86, 32.59, 15.36 |
[115] |
| FCM, FCM-SW* | Simulated lesions from the NCAT Phantom 21 NSCLC and 7 LSCC patients |
Classification error (%): −10.8 ± 23.1 , 0.9 ± 14.4 Classification error (%): 21.7 ± 22.0, 8.6 ± 28.3 |
[116] |
| Standard GMM, SVFMM, CA- SVFMM, ICM, MEANF, Dirich- let Gaussian mixture model |
PET Image of dog lung and spherical phantoms |
Misclassification ratio(%): 32.15, 12.43, 11.85, 3.52, 1.19, 0.67 |
[117] |
| FLAB, FHMC, FCM, T42% | 10 Spherical Phan- toms |
Classification errors (%): 25.2, 31.2, 51.6, 55.8 |
[118] |
| Spectral Clustering, Adaptive Thresholding |
30 Simulated lesions | Dice Similarity: ~ 95%, 92% | [119] |
Integrated a trous wavelet transform and spatial information by first smoothing with a nonlinear anisotropic diffusion filter [120]
6. Region-based segmentation methods
Another distinct type of PET segmentation technique is region-based segmentation methods where the homogeneity of the image is the main consideration for determining object boundaries. While it is true that the region-based segmentation methods also utilize the intensities of the image, they are much more concerned about the local distribution (homogeneity) of the intensities on the image. The region-based methods are mainly divided into two subgroups when considering PET images: Region Growing in Subsection 6.1 and Graph Cut methods in Subsection 6.2. Figure 9 shows further subgroups of these region-based segmentation methods.
Figure 9.
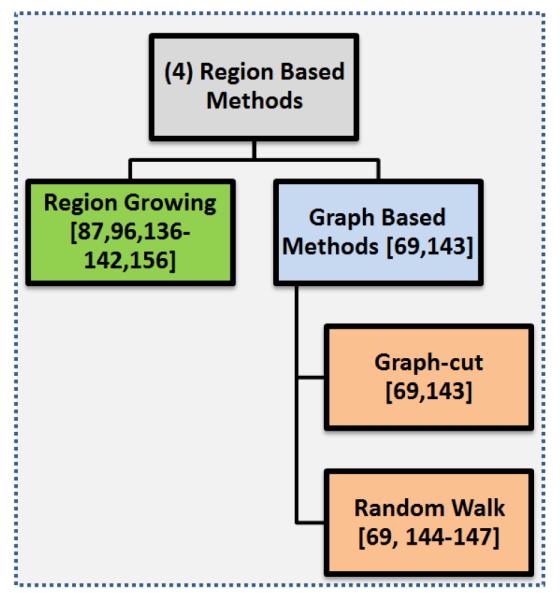
An overview of the region-based segmentation methods.
6.1. Region Growing
The fundamental drawback of histogram based segmentation, methods such as thresholding, is that histograms provide no spatial information which is extremely valuable information not being considered. One such method that incorporates spatial information in the image along with the intensity information is Region Growing, as first presented in [139]. The algorithm starts at a user defined seed and based on the mean and standard deviation of the intensities within the local seed region, connected pixels are either included or excluded in the segmentation results. A second input, a homogeneity metric, is used to decide how different a new pixel can be from the statistics of the region already selected and can still be included in the segmentation [87]. This process is repeated until the entire region of interest has been dissected or the segmented region does not change.
Region growing is a widely applied technique for different segmentation purposes [87, 139, 140, 141, 142, 143]. The main assumption in region growing is that regions of the object of interest have nearly constant or slowly varying intensity values to satisfy the homogeneity requirement. In region growing, it is expected that different homogeneity criterion and initial seed locations could easily affect the final segmentation results. Despite these difficulties, PET images tend to be sufficiently homogeneous in general, so region growing usually gives satisfactory results. For example, when compared to fixed thresholding techniques such as SUV2.5 and SUV43%, the region growing algorithm was shown to be much more accurate with a smaller standard deviation of the segmentation accuracy [87]. Furthermore, segmentation results obtained from the region growing method are highly reproducible, but, again, are strongly depend on the initialization of the segmentation. See Figure 10 for an example of the delineation process with regard to different initializations of the seeds and homogeneity parameters. Although region growing methods have been shown to work well in homogeneous regions with appropriately set intensity homogeneity parameters, segmentation of heterogeneous structures has not been satisfactory (Figure 10 (a,b)). Region growing may fail even for sufficiently homogeneous uptake regions when the homogeneity parameter of the region growing algorithm is not appropriately set (Figure 10 (c)). Moreover, region growing methods reported in the literature for PET segmentation are not able to handle multiple object segmentation (Figure 10 (d)). Thus, homogeneity parameters for multiple lesion cases have yet to be assessed.
Figure 10.
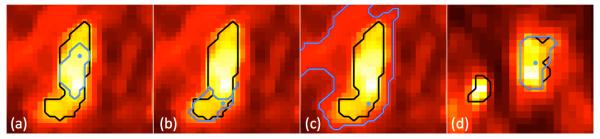
The homogeneity metric for (a), (b) = 0.1 and (c), (d) = 0.3. The black outline in the images is the gold standard while the blue line is found from the region grown algorithm. The blue dot represents the location of the user defined seed.
The main challenge in the region growing algorithm is “leakage”, that often occurs in PET images due to the high PVE, low resolution, and motion artifacts. Leakage can usually be limited using shape information [144], or be removed during an additional step after segmentation [145]. There has also been some methods proposed in the literature that discuss how to prevent or limit the leakage of region growing segmentation on PET images. Here, we highlight a few state-of-the-art methods that aim to “constrain” region growing from leaking into the background or nearby objects. In [146], a region growing algorithm that avoids false-positive segmentation though user incorporated input was introduced. This has been done simply by ROI definition to limit the possible areas where region growing could leak into. Initially, the voxel with the highest intensity in the ROI was chosen as the starting seed. Then, an adaptive version of the conventional region growing algorithm determined the boundaries of a lesion by assessing whether there has been a sharp volume increase between iterations. After the final step, a dual-front active contour based method was applied to the segmented region using the ROI to refine the segmentation and to further reduce any background leakage that may have occurred. Similar to the final step in the previous algorithm, another region growing based method attempted to constrain the algorithm by integrating a threshold based segmentation with region growing to fine-tune an absolute thresholding level after the background signal was subtracted from the PET signals [96]. This improved the robustness of thresholding segmentation against noise by considering the homogeneity and connectedness of the segmented area of the image; however, the selection of stopping criteria and inclusion of non-target structures within the segmented areas are some of the drawbacks [96].
The last approach that we will describe is using the condensed connected region growing (CCRG) method, which is an iterative algorithm utilizing the statistics from a user defined tumor region for segmentation. After defining the ROI, the voxel with the highest intensity is found, and the region growing begins at this location. Iteratively, the mean and standard deviation of this region is calculated, and a value derived by a formula that containing both of these metrics, is used to determine whether or not to include nearby voxels [87]. The CCRG gave significantly better segmentation results compared to thresholding-based methods; however, high false positive rates remains a challenging problem.
6.2. Graph-based methods
Graph-based approaches have a big advantage over other PET segmentation methods by incorporating efficient recognition into the segmentation process by using foreground and background seeds, specified by the user (or automatically) to locate the objects in the image [69]. These seed points act as hard constraints and combine global information with local pairwise pixel similarities [147] for optimal segmentation results. The two most common graph based methods used for PET segmentation are Graph Cut and Random Walk. We describe them in the following subsections in detail.
6.2.1. Graph-cut
Initially, graph-cut constructs a graph where the nodes are the voxels on the image and the edges represent the strength of similarity between the nodes. Once the graph is constructed, the edges are cut using energy functions to minimize the cost of all possible cuts. Graph-cut optimizes these partitions with respect to the energy function. Notably, graph-cut has been shown to optimally segment images using local pairwise pixel similarities [147]. However, graph-cut is not very robust and fails to give optimal results for noisy images [69].
6.2.2. Random walk
The random walk (RW) algorithm first appeared for computer vision applications in [148], and was used later for image segmentation in [69, 149, 150, 151]. RW is robust against noise and weak boundaries, a necessary trait due to the low resolution and high noise characteristics of PET images. It was first proposed for PET image segmentation in [69]. The study compared RW with two well-known threshold based segmentation methods (described previously in this review), FLAB and FCM, and outperformed them. Authors found that RW was superior to these commonly used methods in terms of accuracy, robustness, repeatability, and computational efficiency. RW has also been used in multi-modality segmentation, as described later in Section 8. One drawback of RW is that it may not properly handle multi-focal uptake regions when distributed in large areas of the body region. Although an automated seeding process was proposed recently in [58] for this purpose, human incorporation may still be necessary for some extreme cases.
7. Boundary-based methods
Instead of using the statistics of the entire image or the homogeneity of the image for segmentation, boundary-based segmentation methods were designed to locate and identify the boundaries of the objects in PET images. However, locating the boundaries of the objects in PET images is challenging due to the low resolution and noise of the PET images. The boundary-based methods can be categorized into two subgroups, Level Set/Active Contours and Gradient Based methods, as shown in Figure 11.
Figure 11.

An overview of the boundary-based segmentation methods.
7.1. Level Set and Active Contours
The concept of active contours, also called snakes, was first proposed in [152], where an initial contour around the object of interest deforms and moves towards the desired object’s edges. The deformation of the contour is handled by what is termed as the energy function. The energy function consists of two set of terms: internal and external energies. The internal energy guarantees the smoothness of the contour, whereas the external term forces the contour to move to the desired features (gradient, texture, edge information, etc.) of the image. Classical active contour methods rely on the gradient information and their performance is highly dependent on the location of the initial contour, i.e., the initial contour must be as close to the object of interest as possible so that the external energy is strong enough to move contour towards the target object boundaries. Moreover, the classical model cannot handle the topological changes of the curve. Geometric active contours capable of handling these curves were later introduced by Caselles et al. [153]. Their model utilizes the gradient information to define an edge; whereas the energy functional minimization procedure is carried out using the level set formulation.
As applied to PET images, a number of active contour-based segmentation techniques have been adapted in the literature. For instance, Hsu et al. [154] applied the classical active contour model to segment liver PET images. In their approach they estimated the external energy by solving a Poisson partial differential equation (PDE) and the algorithm was initialized by a Canny edge detection. Geometric active contours combined with an iterative deblurring algorithm were applied to PET images in [66] in the delineation of non-small cell lung cancer. Li et al. [146] used region growing as a pre-processing step to improve the active contour robustness for PET tumor delineation. Recently Abdoli et al. [155] combined geometric active contours with anisotropic diffusion filtering as a preprocessing step for smoothing, followed by a multi-resolution contourlet transform to segment tumors. The purpose of using the contourlet transform is to make the energy functional more effective in directing the evolving contour towards the target object.
The level set (LS) method was proposed in [156] for a way of modeling active contours by tracing interfaces between different phases of fluid flows. It has proven to be a very powerful tool for tracking moving interfaces over time and intensity. LS has been adopted in many applications involving movement of interfaces, including their widespread use in different imaging problems such as image segmentation and image registration [157, 158]. Basically, LS attempts to exploit the intensity gradient information based on the concept of evolving level sets by iteratively solving Euler-Lagrange partial differential equation
| (3) |
where φ is an implicit function (e.g., distance) that monitors the evolving level set and V is the velocity function for controlling the expansion and shrinkage of level set that is directly proportional to the curvature κ and inversely proportional to the image intensity gradient. The spatial regularization imposed by LS-based methods encourages the segmentation to have a smooth boundary; therefore, the resulting segmentations have a more regular shape than obtained by other methods.
Several techniques have been proposed in the literature that employ LS with pre- or post-processing techniques to segment images in different imaging modalities including PET. As a representative method, [159] recently developed a technique that utilizes both spatial and temporal information in dynamic PET data based on a multi-phase level set. The authors explained that in a PET scan, activity contrast between organs varies from frame-to-frame because of changes in tracer distribution over time. The method defines different weighting of absolute difference in the data term to each image frame and considers the noise level and activity difference. The authors validated their segmentation method using both phantom and real mice data [159]. The method was compared with the k-means algorithm and shown to have a higher accuracy accordingly.
As described in the region growing methods, an adaptive region-growing method [143] was used as a preprocessing step, and then the LS method was used to further refine the segmentation result. The method was shown to outperform iterative threshold methods on phantom and real images. Further, a PSF-based deconvolution method was used in [160] as a preprocessing step with LS for co-registered PET/CT in order to segment lung tumors in a semi-automated way. Both methods were tested on phantom as well as clinical data and showed that it produced accurate results with high reproducibility.
LS methods have proven to be an elegant tool for tracking moving interfaces. By implicitly including curve parametrization and geometric property estimation, these methods are able to handle topological changes much better than other boundary and region-based methods. Also LS works well at segmenting multi-objects if initialization of LS has been done properly. However, depending on the energy function, the method can be computationally complex and is highly dependent on the initial condition.
7.2. Gradient-based methods
In general, the edges of an image usually have a sharp change in intensity values to signify the boundary of an object. To locate where these local changes of intensity occur, the gradient of the image is usually calculated between a voxel and the neighboring voxels. However, simply analyzing the abrupt changes in the PET intensity values does not often give optimal segmentation results due to several challenges that make the segmentation process less robust or not very accurate. The most significant of these challenges is the low resolution of the PET images and high PVE, which cause the boundaries to be smoothed and sometimes disconnected. PET images have also considerable noise, and this is amplified on gradient-based methods, which may result in a sub-optimal solution as well [161].
Despite all of the challenges that PET images pose for gradient-based segmentation methods, there were some attempts for compensating all of these difficulties. In [162], the images were first iteratively processed using an edge preserving filter and an iterative deconvolution algorithm to enhance the edges and reduce the effects of partial volume and smoothing that results from the reconstruction process. The deconvolution kernel involves the PSF of the PET scanner and the PSF must be estimated or known prior. Next, the watershed transform [161], which determines the edges using the gradient of an image, and hierarchical cluster analysis were applied to the PET images. The hierarchical clustering algorithm (Wards algorithm) clustered the small patches found from the watershed transform together to construct the segmentation. When this method was compared to the ground truth volumes of the phantoms, a slight underestimation of approximately 10 – 20% was observed, and a slight radius underestimation around 0.5–1.1 mm was reported [162]. The proposed method was also evaluated on PET images of non-small cell lung cancer and compared to volumes derived from CT, other PET image threshold-based techniques, as well as histopathology slices of surgical specimens that were inated with gelatin, frozen, and then sliced [91]. The segmentation method was shown to have a high accuracy with respect to 3D tumor volumes derived from histopathology and had the best estimation of true tumor volume as compared to the various PET segmentation methods.
Another gradient based PET image segmentation method has been developed named GRADIENT (MIM Software, Cleveland, OH) and was validated in several studies demonstrating higher performance than manual and constant threshold methods in a phantom study [52, 163]. GRADIENT requires a user defined initial starting point and a user defined ellipse which is then used for the initial bounding region for gradient detection [52]. In addition, another method, [164], used the watershed algorithm for segmenting noisy PET transmission images by utilizing a multi-resolution approach to deal with the PVE and the excessive noise in the data. However, the amount of smoothing used in the preprocessing and post-processing steps to fuse the over-segmented regions together, and the noise in PET images are some of the unsolved issues in PET image segmentation problems.
8. Joint Segmentation Methods
Image fusion involves combining two or more images of differing modalities to create a composite that contains complementary information from the inputs. Before PET-CT and MRI-PET hybrid scanners were developed, image registration techniques were being used to align images. It is evident that fused images are more suitable for visual perception, particularly for radiologists as analyzing fused images reduces uncertainty and minimizes redundancy in the output while maximizing relevant information rather than analyzing the images alone. In parallel to the developments of multi-modal scanners (PET-CT and MRI-PET), there have been recent attempts in the literature to bring the usefulness of integrating anatomical information (from CT and MRI) with functional data (from PET) for joint delineation of tumors [45, 165, 166, 167, 168]. Figure 12 shows an example segmentation that incorporates information from PET and CT images where the individual segmentations from PET and CT are shown in white and pink, respectively, and the resulting joint-segmentation (i.e., co-segmentation) is in black. There are multiple-benefits of using a co-segmentation algorithm other than the conventional advantages of image fusion. First, co-segmentation algorithms bring increased robustness into the lesion delineation process due to unified information. Second, they provide wider spatial and temporal coverage of the tissues. Third, there is less uncertainty and more reliability in results of co-segmentation algorithms. All these benefits are due to the fact that co-segmentation algorithms try to mimic human visual image recognition performance which depends on the amount of informative features such as corners, texture, edges, and lines available in the images [169]. Co-segmentation algorithms optimize the number of these details by unifying two or more images into the same platform.
Figure 12.

Here is an example of a segmentation that incorporates anatomical and functional information from multi-modalities (PET and CT). The original images are shown on the left while a zoom in view showing the segmentation (using the information only from the respective image) is provided on the right. The resulting co-segmentation is in the middle image on the right in white.
Currently, there are four main ideas on how to incorporate anatomical and PET information into the same space. First, a multi-valued LS deformable model was developed in [167] for integrating individual segmentations from PET and CT together to incorporate the information from both. The individual segmentations were combined together using the multi-valued LS method. Second, textural features from CT images were used to distinguish cancerous tissue types, and PET information was incorporated into this knowledge [165, 168]. However, these efforts have some drawbacks when utilizing PET and CT information simultaneously such as potentially unrealistic assumption of one-to-one correspondences between anatomical and functional images of lesions and lack of standard for combining feature sets from different imaging modalities, as well as long execution times and sub-optimal solutions to individual segmentation problems. As a possible solution, third, a joint PET-CT image segmentation method was proposed in [166] and extended in [170], where a MRF algorithm was formulated on a graph. The approach formulates the segmentation problem as a minimization problem of a Markov random field model, which encodes the information from both modalities. Furthermore, the optimization task of the MRF minimization is solved using a graph-cut based method. Two sub-graphs are constructed for the segmentation of the PET and the CT images, respectively. Later, authors extended their method in [170] to achieve consistent results in two modalities by adding an adaptive context cost between the two sub-graphs. Although an optimal solution can be obtained by solving a single maximum flow problem, which leads to simultaneous segmentation of the tumor volumes in both modalities, the method itself requires user interaction, and it was only used with images from the head-neck with large tumors. Its performance in small uptake regions was not assessed. Another shortcoming of the proposed approach was due to the potentially unrealistic assumption that there is a one-to-one correspondence between PET and CT delineations. However, it is the first attempt in the literature showing full interaction between anatomical and functional information, and it has been successfully applied for simultaneous segmentation of head and neck tumors from PET-CT images. Furthermore, authors showed that graph-based PET-CT co-segmentation algorithm concurrently segment tumor from both modalities, achieving globally optimal solutions in low-order polynomial time.
Forth, the assumption of one-to-one-correspondence was recently relaxed in [45], where a fully automated co-segmentation method was driven by the uptake regions from PET, and then the correct anatomical boundaries were found in the corresponding CT images. The proposed method was based on the random walk image co-segmentation, and more importantly, it did not have the assumption of one-to-one correspondence between PET and CT images or PET and MR (i.e., the lesions may have had a smaller or larger uptake region on PET compared to the anatomical abnormality in the CT or MR image). Therefore, this method is more realistic for clinical and pre-clinical applications, where relative differences may occur in structural and functional regions. Recently, the method from [45] was applied to quantify lesions from PET, PET-CT, PET-MRI, and MRI-PET-CT images in [58]. For an example of their findings, when considering only the information from the PET image, the co-segmentation method had a DSC of 83.23 ± 1.87%. But when considering the information from CT and the information from PET, the DSC increased statistically significantly to 91.44 ± 1.71%. The authors also compared their method with the state-of-the-art co-segmentation method [166] (described above) and it outperformed that method which has a high DSC of 89.34 ± 1.95%. In both studies, evaluation of the algorithms are based on the ground-truth annotations manually obtained from multiple observers.
Radiologists visually judge spatial relationships between images better when images are fused. Appropriately and jointly displaying the PET-CT and MRI-PET images is important in many diagnostic tasks. For example, it has been shown that fusion of abdominal images from different modalities can improve diagnosis and monitoring of disease progression [171]. Indeed, hybrid imaging techniques have proven useful for the evaluation of patients with cancer including diagnosis, staging, treatment planning, and monitoring the response to therapy including disease progression [172]. Although it was widely accepted that the process of combining relevant information from two or more images into a single image carries more information than the single image alone, segmentation of the lesions was being conducted in single images until the co-segmentation algorithms came into play. Similar to the fusion process that radiologists use for qualitative evaluation of the lesions, the co-segmentation process combines the strength of multi-modal images to facilitate a globally optimal lesion boundary.
Future research into the co-segmentation of functional and anatomical images will strive towards improving the efficiency of the methods so that they can be used in clinical routine readily. Although available methods are shown to be efficient enough, real time processing of images will require several post-processing and interactive methods to be conducted prior to the delineation process. Therefore, computational efficiency and even the use of the co-segmentation algorithms within the hardware (i.e., scanner) will be the potential directions.
9. Discussion
This review gives an overview of the current image segmentation techniques for PET images. The similarities, main ideas, assumptions, and quantitative comparisons between the many PET segmentation methods have been outlined to give researchers and clinicians an idea of which method is applicable for most situations. When choosing which method is appropriate for a specific quantification application, it should be noted that there are some important details outside the scope of this manuscript. For instance, application specific algorithms for particular radiotracers or diseases were not included in this manuscript. Different radiotracers can also have impact on the performance of individual segmentation algorithms. Specifically, both location and degree of concentration will change using different radiotracers. Therefore, for basic threshold-based methods, it will lead to considerable change in the appropriate thresholds. On the other hand, for more advanced methods using region information and edge information, it will influence less on the final segmentation result. Furthermore, the use of contrast media and metallic implants have been associated with focal radiotracer uptake, which may affect the accuracy of the image segmentation [173, 174, 175].
Segmentation methods developed for dynamic PET imaging were not included in this review either. Dynamic PET images are primarily used in research and drug development applications, and the long imaging times makes dynamic PET imaging extremely impractical for use in routine clinics. Interested readers should refer to [176, 177, 178, 179, 180, 181, 182] for examples of current research on this topic.
To the best of our knowledge, there is currently no study in the literature that directly compares the computational time of the PET image segmentation methods utilizing standardized images and hardware. Nevertheless, most of the PET segmentation algorithms can be considered efficient enough to be used in clinics due to the advancement of parallel computing and powerful workstations. However, we should also note that the magnitude of user interaction varies significantly depending on the pre-clinical/clinical applications and this may greatly affect the time for obtaining the segmentation results. For instance, supervised clustering methods require time-consuming training and labeling of the data while region-based methods often require a single seed location within the object of interest.
From the relevant publications that we reviewed in this work, it appears that methods for PET image segmentation are advancing towards fully automatic approaches that are clinically more feasible: (a) in the efficiency sense, and (b) the decrease in the variability from the lack of required input. Regarding the research direction (b), the choice of segmentation method for the particular application can be very specific. For instance, the AP-based segmentation method [135] was shown to be superior to other methods when uptake are diffuse and multi-focal; therefore, clustering based algorithms are preferred to other algorithms when uptake has non-spherical shapes and is multi-focal, as common in infectious lung diseases. In tumor segmentation, for another example, if manual ROI definition is not time consuming, then preferably FLAB method [135] or other fuzzy clustering methods [135] can be used to delineate tumors succesfully. When there are multiple lesions and it is difficult to define individual ROIs for every lesion, then graph-cut, random walk, and region growing type algorithms are preferred due to the fast convergence, accurate results, and more automated nature. In particular, the random walk algorithm is preferred when noise is a concern, and the region growing algorithm is less preferred due to lack of a leakage control system. Last, but not least, when lesions are spherical or near-spherical, thresholding methods, in particular ITM or adaptive thresholding, are satisfactory enough and the segmentation results are not statistically significantly different from each other [135].
Research in the PET image segmentation area will continue, perhaps indefinitely, as there is no single general optimal solution framework for all clinical problems in terms of accuracy, precision, and efficiency. Indeed, it is important to note that image segmentation has an infinite dimensional solution space which encourages researchers to distinguish image segmentation methods based on the application domain specific solution starting from general solution frameworks. In this way, even though the solution space is constrained to certain methods and the methods developed for specific clinical application will only have subtle differences in their accuracy measurements, there will still be improvements in terms of efficiency of the methods. Improving the efficiency of the image segmentation methods pertaining to application specific domains in PET imaging will shed new light on how to deal with a large number of data in a shorter time interval.
From reviewing a vast amount of research in PET segmentation methods, it is clear to the authors that one of the future directions of this community is an immediate need for standardization between the many different segmentation methods such as a publicly available database of PET images for evaluating new and old methods against. This database should consist of phantom images (such as the excellent PET simulation images from the Monte Carlo-based Geant4 application for emission tomography (GATE) software [183]) as well as small animal and human PET images with multiple manual delineations. Currently, beyond taking the time for implementing and conducting research on the optimal parameters for a new segmentation method against a common image database, there is no way to fairly and throughly evaluate one segmentation algorithm or framework versus another. In this review, the accuracy of the many methods that was reported in the respect studies was given, but when comparing and considering these methods using the reported accuracy there should be a reasonable amount of skepticism. It is apparent that some studies may have done more extensive and through testing versus another and without a common database of images and standardized testing these numbers are less significant. There are similar databases in the computer vision, machine learning, and many other fields of image processing research and this common database would aid in advancing the PET segmentation community significantly. Notably, there is an ongoing study proposing a protocol for evaluation of current and future segmentation methods based on a general framework, which will be expanded and adapted to PET imaging [184, 185]. With the completion of that study, a benchmark database for validation and comparison of segmentation methods will be available and very beneficial for PET imaging and image processing applications.
10. Conclusions
PET imaging provides quantitative functional information on diseases, and image segmentation is of great importance for extracting this information. In this paper, we presented the state-of-the-art image segmentation methods that are commonly used for PET imaging, as well as the recent advances in techniques applicable to PET, PET-CT, and MRI-PET images. We investigated different segmentation methods in detail; results were listed and compared throughout this review. Given the vast number and wide variety of methods for approaching the segmentation task, this review compares and contrasts the state-of-the-art methods and provides researchers and clinicians with detailed segmentation methods that are well suited for any particular application. We noted that although there is no PET image segmentation method that is optimal for all applications or can compensate for all of the difficulties inherent to PET images, development of trending image segmentation techniques which combine anatomical information and metabolic activities in the same hybrid frameworks (PET-CT, PET-CT, and MRI-PET-CT) is encouraging and open to further investigations. Continued refinements of PET image segmentation methods in parallel to these advances in imaging instrumentation will provide basis for improved evaluation of prognosis.
Figure 4.

An overview of intensity-based segmentation methods for PET images.
Acknowledgments
This research is supported by the Center for Infectious Disease Imaging (CIDI), the Intramural Program of the National Institutes of Allergy and Infectious Diseases (NIAID), and the National Institutes of Bio-imaging and Bioengineering (NIBIB) at the National Institutes of Health (NIH). We thank Dr. Sanjay Jain for kindly providing the rabbit TB images.
Footnotes
Publisher's Disclaimer: This is a PDF file of an unedited manuscript that has been accepted for publication. As a service to our customers we are providing this early version of the manuscript. The manuscript will undergo copyediting, typesetting, and review of the resulting proof before it is published in its final citable form. Please note that during the production process errors may be discovered which could affect the content, and all legal disclaimers that apply to the journal pertain.
References
- [1].Seute T, Leffers P, ten Velde G, Twijnstra A. Detection of brain metastases from small cell lung cancer. Cancer. 2008;112(8):1827–1834. doi: 10.1002/cncr.23361. [DOI] [PubMed] [Google Scholar]
- [2].MacManus M, Nestle U, Rosenzweig K, Carrio I, Messa C, Belohlavek O, Danna M, Inoue T, Deniaud-Alexandre E, Schipani S, et al. Use of pet and pet/ct for radiation therapy planning: Iaea expert report 2006–2007. Radiotherapy and oncology. 2009;91(1):85–94. doi: 10.1016/j.radonc.2008.11.008. [DOI] [PubMed] [Google Scholar]
- [3].Basu S, Kwee T, Surti S, Akin E, Yoo D, Alavi A. Fundamentals of pet and pet/ct imaging. Annals of the New York Academy of Sciences. 2011;1228(1):1–18. doi: 10.1111/j.1749-6632.2011.06077.x. [DOI] [PubMed] [Google Scholar]
- [4].Lardinois D, Weder W, Hany T, Kamel E, Korom S, Seifert B, von Schulthess G, Steinert H. Staging of non–small-cell lung cancer with integrated positron-emission tomography and computed tomography. New England Journal of Medicine. 2003;348(25):2500–2507. doi: 10.1056/NEJMoa022136. [DOI] [PubMed] [Google Scholar]
- [5].Kostakoglu L, Agress H, Jr, Goldsmith S. Clinical role of fdg pet in evaluation of cancer patients. Radiographics. 2003;23(2):315–340. doi: 10.1148/rg.232025705. [DOI] [PubMed] [Google Scholar]
- [6].Judenhofer M. Simultaneous pet-mri: a new approach for functional and morphological imaging. Nature Medicine. 2008;14(4):459–465. doi: 10.1038/nm1700. [DOI] [PubMed] [Google Scholar]
- [7].Evanko D. Two pictures are better than one. Nature Methods. 2008;5(5):377. [Google Scholar]
- [8].Kaufmann P, Camici P. Myocardial blood flow measurement by pet: technical aspects and clinical applications. Journal of Nuclear Medicine. 2005;46(1):75–88. [PubMed] [Google Scholar]
- [9].Zhao B. LS, Schwartz LH. Imaging surrogates of tumor response to therapy: Anatomic and functional biomarkers. Journal of Nuclear Medicine. 2009;50(2):239–249. doi: 10.2967/jnumed.108.056655. [DOI] [PubMed] [Google Scholar]
- [10].Division IMI. Pet market summary report. Tech. rep. 2011 [Google Scholar]
- [11].Gregoire V, Haustermans K, Geets X, Roels S, Lonneux M. Pet based treatment planning in radiotherapy: a new standard? Journal of Nuclear Medicine. 2007;48:68S–77S. [PubMed] [Google Scholar]
- [12].Votaw J. The aapm/rsna physics tutorial for residents. physics of pet. Radiographics. 1995;15(5):1179–1190. doi: 10.1148/radiographics.15.5.7501858. [DOI] [PubMed] [Google Scholar]
- [13].Basu S, Zaidi H, Holm S, Alavi A. Quantitative techniques in pet-ct imaging. Current Medical Imaging Reviews. 2011;7(3):216–233. [Google Scholar]
- [14].Evelina M, Gian S, Federica T, Angelo Z, Filippo D, Giulia P, Luigi R, Federica Z, Silverio T. Positron emission tomography (pet) radiotracers in oncology–utility of 18f-fluoro-deoxy-glucose (fdg)-pet in the management of patients with non-small-cell lung cancer (nsclc) Journal of Experimental & Clinical Cancer Research. 2008;27:52. doi: 10.1186/1756-9966-27-52. [DOI] [PMC free article] [PubMed] [Google Scholar]
- [15].Kramer-Marek G, Bernardo M, Kiesewetter D, Bagci U, Kuban M, Omer A, Zielinski R, Seidel J, Choyke P, Capala J. Pet of her2-positive pulmonary metastases with 18f-zher2: 342 affibody in a murine model of breast cancer: Comparison with 18f-fdg. Journal of Nuclear Medicine. 2012;53(6):939–946. doi: 10.2967/jnumed.111.100354. [DOI] [PMC free article] [PubMed] [Google Scholar]
- [16].Wahl R, Jacene H, Kasamon Y, Lodge M. From recist to percist: evolving considerations for pet response criteria in solid tumors. Journal of Nuclear Medicine. 2009;50(Suppl 1):122S–150S. doi: 10.2967/jnumed.108.057307. [DOI] [PMC free article] [PubMed] [Google Scholar]
- [17].Lowe V, Hoffman J, DeLong D, Patz E, Coleman R, et al. Semiquantitative and visual analysis of fdg-pet images in pulmonary abnormalities. Journal of nuclear medicine. 1994;35(11):1771–1776. [PubMed] [Google Scholar]
- [18].Lodge M, Chaudhry M, Wahl R. Noise considerations for pet quantification using maximum and peak standardized uptake value. Journal of Nuclear Medicine. 2012;53(7):1041–1047. doi: 10.2967/jnumed.111.101733. [DOI] [PMC free article] [PubMed] [Google Scholar]
- [19].Kim C, Gupta N, Chandramouli B, Alavi A. Standardized uptake values of fdg: body surface area correction is preferable to body weight correction. Journal of nuclear medicine. 1994;35(1):164–167. [PubMed] [Google Scholar]
- [20].Kelly M. Suv: Advancing comparability and accuracy. White Paper Siemens.
- [21].Zasadny K, Wahl R. Standardized uptake values of normal tissues at pet with 2-[fluorine-18]-fluoro-2-deoxy-d-glucose: variations with body weight and a method for correction. Radiology. 1993;189(3):847–850. doi: 10.1148/radiology.189.3.8234714. [DOI] [PubMed] [Google Scholar]
- [22].Sugawara Y, Zasadny K, Neuhoff A, Wahl R. Re-evaluation of the standardized uptake value for fdg: variations with body weight and methods for correction. Radiology. 1999;213(2):521–525. doi: 10.1148/radiology.213.2.r99nv37521. [DOI] [PubMed] [Google Scholar]
- [23].Lindholm P, Minn H, Leskinen-Kallio S, Bergman J, Ruotsalainen U, Joensuu H, et al. Influence of the blood glucose concentration on fdg uptake in cancer–a pet study. Journal of nuclear medicine. 1993;34(1):1–6. [PubMed] [Google Scholar]
- [24].Crippa F, Gavazzi C, Bozzetti F, Chiesa C, Pascali C, Bogni A, De Sanctis V, Decise D, Schiavini M, Cucchetti G, Bombardieri E. The influence of blood glucose levels on [18f] fluorodeoxyglucose (fdg) uptake in cancer: a pet study in liver metastases from colorectal carcinomas. Tumori. 1997;83(4):748–752. doi: 10.1177/030089169708300407. [DOI] [PubMed] [Google Scholar]
- [25].Shankar L, Hoffman J, Bacharach S, Graham M, Karp J, Lammertsma A, Larson S, Mankoff D, Siegel B, Van den Abbeele A, et al. Consensus recommendations for the use of 18f-fdg pet as an indicator of therapeutic response in patients in national cancer institute trials. Journal of Nuclear Medicine. 2006;47(6):1059–1066. [PubMed] [Google Scholar]
- [26].Lodge M, Lucas J, Marsden P, Cronin B, ODoherty M, Smith M. A pet study of 18 fdg uptake in soft tissue masses. European Journal of Nuclear Medicine and Molecular Imaging. 1999;26(1):22–30. doi: 10.1007/s002590050355. [DOI] [PubMed] [Google Scholar]
- [27].Keyes J., Jr Suv: Standard uptake or silly useless value? Journal of Nuclear Medicine. 1995;36(10):1836–9. [PubMed] [Google Scholar]
- [28].Beaulieu S, Kinahan P, Tseng J, Dunnwald L, Schubert E, Pham P, Lewellen B, Mankoff D. Suv varies with time after injection in 18f-fdg pet of breast cancer: characterization and method to adjust for time differences. Journal of Nuclear Medicine. 2003;44(7):1044–1050. [PubMed] [Google Scholar]
- [29].Nehmeh SA, Erdi YE, Ling CC, Rosenzweig KE, Schoder H, Larson SM, Macapinlac HA, Squire OD, Humm JL. Effect of respiratory gating on quantifying pet images of lung cancer. Journal of nuclear medicine. 2002;43(7):876–881. [PubMed] [Google Scholar]
- [30].Nehmeh S, Erdi Y, Pan T, Pevsner A, Rosenzweig K, Yorke E, Mageras G, Schoder H, Vernon P, Squire O, et al. Four-dimensional (4d) pet/ct imaging of the thorax. Medical physics. 2004;31:3179–3186. doi: 10.1118/1.1809778. [DOI] [PubMed] [Google Scholar]
- [31].Erdi Y, Nehmeh S, Pan T, Pevsner A, Rosenzweig K, Mageras G, Yorke E, Schoder H, Hsiao W, Squire O, et al. The ct motion quantitation of lung lesions and its impact on pet-measured suvs. Journal of Nuclear Medicine. 2004;45(8):1287–1292. [PubMed] [Google Scholar]
- [32].Pan T, Mawlawi O, Nehmeh S, Erdi Y, Luo D, Liu H, Castillo R, Mohan R, Liao Z, Macapinlac H. Attenuation correction of pet images with respiration-averaged ct images in pet/ct. Journal of Nuclear Medicine. 2005;46(9):1481–1487. [PubMed] [Google Scholar]
- [33].Ramos C, Erdi Y, Gonen M, Riedel E, Yeung H, Macapinlac H, Chisin R, Larson S. Fdg-pet standardized uptake values in normal anatomical structures using iterative reconstruction segmented attenuation correction and filtered back-projection. European Journal of Nuclear Medicine and Molecular Imaging. 2001;28(2):155–164. doi: 10.1007/s002590000421. [DOI] [PubMed] [Google Scholar]
- [34].Soret M, Bacharach S, Buvat I. Partial-volume effect in pet tumor imaging. Journal of Nuclear Medicine. 2007;48(6):932–945. doi: 10.2967/jnumed.106.035774. [DOI] [PubMed] [Google Scholar]
- [35].Srinivas S, Dhurairaj T, Basu S, Bural G, Surti S, Alavi A. A recovery coefficient method for partial volume correction of pet images. Annals of nuclear medicine. 2009;23(4):341–348. doi: 10.1007/s12149-009-0241-9. [DOI] [PubMed] [Google Scholar]
- [36].Fahey F, Kinahan P, Doot R, Kocak M, Thurston H, Poussaint T. Variability in pet quantitation within a multicenter consortium. Medical physics. 2010;37(7):3660–3666. doi: 10.1118/1.3455705. [DOI] [PMC free article] [PubMed] [Google Scholar]
- [37].Jentzen W, Freudenberg L, Eising E, Heinze M, Brandau W, Bockisch A. Segmentation of pet volumes by iterative image thresholding. Journal of Nuclear Medicine. 2007;48(1):108–114. [PubMed] [Google Scholar]
- [38].Daisne J, Sibomana M, Bol A, Doumont T, Lonneux M, Grégoire V. Tri-dimensional automatic segmentation of pet volumes based on measured source-to-background ratios: influence of reconstruction algorithms. Radiotherapy and Oncology. 2003;69(3):247–250. doi: 10.1016/s0167-8140(03)00270-6. [DOI] [PubMed] [Google Scholar]
- [39].Burger I, Huser D, Burger C, von Schulthess G, Buck A. Repeatability of FDG quantification in tumor imaging: averaged SUVs are superior to SUV (max) Nuclear medicine and biology. 2012;39(5):666–670. doi: 10.1016/j.nucmedbio.2011.11.002. [DOI] [PubMed] [Google Scholar]
- [40].Nakamoto Y, Zasadny K, Minn H, Wahl R. Reproducibility of common semi-quantitative parameters for evaluating lung cancer glucose metabolism with positron emission tomography using 2-deoxy-2-[18f] fluoro-d-glucose. Molecular Imaging & Biology. 2002;4(2):171–178. doi: 10.1016/s1536-1632(01)00004-x. [DOI] [PubMed] [Google Scholar]
- [41].Velasquez L, Boellaard R, Kollia G, Hayes W, Hoekstra O, Lammertsma A, Galbraith S. Repeatability of 18f-fdg pet in a multicenter phase i study of patients with advanced gastrointestinal malignancies. Journal of Nuclear Medicine. 2009;50(10):1646–1654. doi: 10.2967/jnumed.109.063347. [DOI] [PubMed] [Google Scholar]
- [42].Krak N, Boellaard R, Hoekstra O, Twisk J, Hoekstra C, Lammertsma A. Effects of roi definition and reconstruction method on quantitative outcome and applicability in a response monitoring trial. European journal of nuclear medicine and molecular imaging. 2005;32(3):294–301. doi: 10.1007/s00259-004-1566-1. [DOI] [PubMed] [Google Scholar]
- [43].Bagci U, Chen X, Udupa J. Hierarchical scale-based multi-object recognition of 3d anatomical structures. IEEE Transactions on Medical Imaging. 2012;31(3):777–789. doi: 10.1109/TMI.2011.2180920. [DOI] [PubMed] [Google Scholar]
- [44].Saha P, Udupa J. Scale-based diffusive image filtering preserving boundary sharpness and fine structures. IEEE Transactions on Medical Imaging. 2001;20(11):1140–1155. doi: 10.1109/42.963817. [DOI] [PubMed] [Google Scholar]
- [45].Bagci U, Udupa JK, Yao J, Mollura DJ. Medical Image Computing and Computer-Assisted Intervention–MICCAI 2012. Springer; 2012. Co-segmentation of functional and anatomical images; pp. 459–467. [DOI] [PMC free article] [PubMed] [Google Scholar]
- [46].Bagci U, Bray M, Caban J, Yao J, Mollura D. Computer-assisted detection of infectious lung diseases: A review. Computerized Medical Imaging and Graphics. 2012;36(1):72–84. doi: 10.1016/j.compmedimag.2011.06.002. [DOI] [PMC free article] [PubMed] [Google Scholar]
- [47].Udupa J, Leblanc V, Zhuge Y, Imielinska C, Schmidt H, Currie L, Hirsch B, Woodburn J. A framework for evaluating image segmentation algorithms. Computerized Medical Imaging and Graphics. 2006;30(2):75–87. doi: 10.1016/j.compmedimag.2005.12.001. [DOI] [PubMed] [Google Scholar]
- [48].Nestle U, Kremp S, Grosu A. Practical integration of 18f-fdg-pet and pet-ct in the planning of radiotherapy for non-small cell lung cancer (nsclc): The technical basis, icru-target volumes, problems, perspectives. Radiotherapy and oncology. 2006;81(2):209–225. doi: 10.1016/j.radonc.2006.09.011. [DOI] [PubMed] [Google Scholar]
- [49].Boellaard R, Krak N, Hoekstra O, Lammertsma A. Effects of noise, image resolution, and roi definition on the accuracy of standard uptake values: a simulation study. Journal of Nuclear Medicine. 2004;45(9):1519–1527. [PubMed] [Google Scholar]
- [50].Delbeke D, Coleman RE, Guiberteau MJ, Brown ML, Royal HD, Siegel BA, Townsend DW, Berland LL, Parker JA, Hubner K, et al. Procedure guideline for tumor imaging with 18f-fdg pet/ct 1.0. Journal of nuclear Medicine. 2006;47(5):885–895. [PubMed] [Google Scholar]
- [51].Boellaard R. Standards for pet image acquisition and quantitative data analysis. Journal of nuclear medicine. 2009;50(Suppl 1):11S–20S. doi: 10.2967/jnumed.108.057182. [DOI] [PubMed] [Google Scholar]
- [52].Werner-Wasik M, Nelson AD, Choi W, Arai Y, Faulhaber PF, Kang P, Almeida FD, Xiao Y, Ohri N, Brockway KD, et al. What is the best way to contour lung tumors on pet scans? multiobserver validation of a gradient-based method using a nsclc digital pet phantom. International Journal of Radiation Oncology* Biology* Physics. 2012;82(3):1164–1171. doi: 10.1016/j.ijrobp.2010.12.055. [DOI] [PMC free article] [PubMed] [Google Scholar]
- [53].Bagci U, Foster B, Miller-Jaster K, Luna B, Dey B, Bishai WR, Jonsson CB, Jain S, Mollura DJ. A computational pipeline for quantification of pulmonary infections in small animal models using serial pet-ct imaging. EJNMMI research. 2013;3(1):1–20. doi: 10.1186/2191-219X-3-55. [DOI] [PMC free article] [PubMed] [Google Scholar]
- [54].Warfield SK, Zou KH, Wells WM. Simultaneous truth and performance level estimation (staple): an algorithm for the validation of image segmentation. Medical Imaging, IEEE Transactions on. 2004;23(7):903–921. doi: 10.1109/TMI.2004.828354. [DOI] [PMC free article] [PubMed] [Google Scholar]
- [55].Dogra D, Majumdar A, Sural S. Evaluation of segmentation techniques using region area and boundary matching information. Journal of Visual Communication and Image Representation. 2012;23:150–160. [Google Scholar]
- [56].Lee JA. Segmentation of positron emission tomography images: some recommendations for target delineation in radiation oncology. Radiotherapy and Oncology. 2010;96(3):302–307. doi: 10.1016/j.radonc.2010.07.003. [DOI] [PubMed] [Google Scholar]
- [57].Bagci U, Yao J, Miller-Jaster K, Chen X, Mollura D. Predicting future morphological changes of lesions from radiotracer uptake in 18f-fdg-pet images. Plos One. 2013;8(2):e57105. doi: 10.1371/journal.pone.0057105. [DOI] [PMC free article] [PubMed] [Google Scholar]
- [58].Bagci U, Udupa J, Mendhiratta N, Foster B, Xu Z, Yao J, Chen X, Mollura DJ. Joint segmentation of functional and anatomical images: Applications in quantification of lesions from pet, pet-ct, mri-pet, and mri-pet-ct images. Medical Image Analysis. 2013;17(8):929–945. doi: 10.1016/j.media.2013.05.004. [DOI] [PMC free article] [PubMed] [Google Scholar]
- [59].Lin C, Itti E, Haioun C, Petegnief Y, Luciani A, Dupuis J, Paone G, Talbot J-N, Rahmouni A, Meignan M. Early 18f-fdg pet for prediction of prognosis in patients with diffuse large b-cell lymphoma: Suv-based assessment versus visual analysis. Journal of Nuclear Medicine. 2007;48(10):1626–1632. doi: 10.2967/jnumed.107.042093. [DOI] [PubMed] [Google Scholar]
- [60].Hellwig D, Graeter T, Ukena D, Groeschel A, Sybrecht G, Schaefers H, Kirsch C. 18f-fdg pet for mediastinal staging of lung cancer: which suv threshold makes sense? Journal of Nuclear Medicine. 2007;48(11):1761–1766. doi: 10.2967/jnumed.107.044362. [DOI] [PubMed] [Google Scholar]
- [61].Fox J, Rengan R, O’Meara W, Yorke E, Erdi Y, Nehmeh S, Leibel S, Rosenzweig K. Does registration of pet and planning ct images decrease interobserver and intraobserver variation in delineating tumor volumes for non-small-cell lung cancer? International Journal of Radiation Oncology, Biology, Physics. 2005;62(1):70–75. doi: 10.1016/j.ijrobp.2004.09.020. [DOI] [PubMed] [Google Scholar]
- [62].Caldwell C, Mah K, Ung Y, Danjoux C, Balogh J, Ganguli S, Ehrlich L. Observer variation in contouring gross tumor volume in patients with poorly defined non-small-cell lung tumors on ct: the impact of 18fdg-hybrid pet fusion. International Journal of Radiation Oncology, Biology, Physics. 2001;51(4):923–931. doi: 10.1016/s0360-3016(01)01722-9. [DOI] [PubMed] [Google Scholar]
- [63].Steenbakkers R, Duppen J, Fitton I, Deurloo K, Zijp L, Comans E, Uitterhoeve A, Rodrigus P, Kramer G, Bussink J, et al. Reduction of observer variation using matched ct-pet for lung cancer delineation: a three-dimensional analysis. International Journal of Radiation Oncology, Biology, Physics. 2006;64(2):435–448. doi: 10.1016/j.ijrobp.2005.06.034. [DOI] [PubMed] [Google Scholar]
- [64].Fiorino C, Reni M, Bolognesi A, Cattaneo G, Calandrino R. Intra-and inter-observer variability in contouring prostate and seminal vesicles: implications for conformal treatment planning. Radiotherapy and oncology. 1998;47(3):285–292. doi: 10.1016/s0167-8140(98)00021-8. [DOI] [PubMed] [Google Scholar]
- [65].Giraud P, Elles S, Helfre S, De Rycke Y, Servois V, Carette M, Alzieu C, Bondiau P, Dubray B, Touboul E, et al. Conformal radiotherapy for lung cancer: different delineation of the gross tumor volume (gtv) by radiologists and radiation oncologists. Radiotherapy and oncology. 2002;62(1):27–36. doi: 10.1016/s0167-8140(01)00444-3. [DOI] [PubMed] [Google Scholar]
- [66].I EN, J B, J D, K B, R L, D L. Improved analysis of pet images for radiation therapy, International Conference on the Use of Computers in Radiation Therapy. Seoul Korea [Google Scholar]
- [67].Hatt M, Cheze Le Rest C, Albarghach N, Pradier O, Visvikis D. Pet functional volume delineation: a robustness and repeatability study. European Journal of Nuclear Medicine and Molecular Imaging. 2011;38(4):663–672. doi: 10.1007/s00259-010-1688-6. [DOI] [PubMed] [Google Scholar]
- [68].Erasmus J, Gladish G, Broemeling L, Sabloff B, Truong M, Herbst R, Munden R. Inter-observer and intraobserver variability in measurement of non–small-cell carcinoma lung lesions: implications for assessment of tumor response. Journal of Clinical Oncology. 2003;21(13):2574–2582. doi: 10.1200/JCO.2003.01.144. [DOI] [PubMed] [Google Scholar]
- [69].Bagci U, Yao J, Caban J, Turkbey E, Aras O, Mollura D. A graph-theoretic approach for segmentation of pet images, in: Engineering in Medicine and Biology Society, EMBC, 2011 Annual International Conference of the IEEE; 2011; pp. 8479–8482. [DOI] [PMC free article] [PubMed] [Google Scholar]
- [70].Breen S, Publicover J, De Silva S, Pond G, Brock K, O’Sullivan B, Cummings B, Dawson L, Keller A, Kim J, et al. Intraobserver and interobserver variability in gtv delineation on fdg-pet-ct images of head and neck cancers. International Journal of Radiation Oncology, Biology, Physics. 2007;68(3):763–770. doi: 10.1016/j.ijrobp.2006.12.039. [DOI] [PubMed] [Google Scholar]
- [71].Beckers C, Ribbens C, André B, Marcelis S, Kaye O, Mathy L, Kaiser M, Hustinx R, Foidart J, Malaise M. Assessment of disease activity in rheumatoid arthritis with 18f-fdg pet. Journal of Nuclear Medicine. 2004;45(6):956–964. [PubMed] [Google Scholar]
- [72].Vorwerk H, Beckmann G, Bremer M, Degen M, Dietl B, Fietkau R, Gsanger T, Hermann R, Alfred Herrmann M, Höller U, et al. The delineation of target volumes for radiotherapy of lung cancer patients. Radiotherapy and Oncology. 2009;91(3):455–460. doi: 10.1016/j.radonc.2009.03.014. [DOI] [PubMed] [Google Scholar]
- [73].Shah B, Srivastava N, Hirsch A, Mercier G, Subramaniam R. Intra-reader reliability of fdg pet volumetric tumor parameters: effects of primary tumor size and segmentation methods. Annals of Nuclear Medicine. 2012;26(9):707–714. doi: 10.1007/s12149-012-0630-3. [DOI] [PubMed] [Google Scholar]
- [74].Webb N, Shavelson R, Haertel E. Reliability coefficients and generalizability theory. Handbook of statistics. 2006;26:81–124. [Google Scholar]
- [75].Zou KH, Warfield SK, Bharatha A, Tempany C, Kaus MR, Haker SJ, Wells WM, III, Jolesz FA, Kikinis R. Statistical validation of image segmentation quality based on a spatial overlap index¡ sup¿ 1¡/sup¿: scientific reports. Academic radiology. 2004;11(2):178–189. doi: 10.1016/S1076-6332(03)00671-8. [DOI] [PMC free article] [PubMed] [Google Scholar]
- [76].Saha P, Udupa J. Optimum image thresholding via class uncertainty and region homogeneity. IEEE Transactions on Pattern Analysis and Machine Intelligence. 2001;12(7):689–706. [Google Scholar]
- [77].Schinagl D, Vogel W, Hoffmann A, van Dalen J, Oyen W, Kaanders J. Comparison of five segmentation tools for 18f-fluoro-deoxy-glucose–positron emission tomography–based target volume definition in head and neck cancer. International Journal of Radiation Oncology, Biology, Physics. 2007;69(4):1282–1289. doi: 10.1016/j.ijrobp.2007.07.2333. [DOI] [PubMed] [Google Scholar]
- [78].Vees H, Senthamizhchelvan S, Miralbell R, Weber D, Ratib O, Zaidi H. Assessment of various strategies for 18 f-fet pet-guided delineation of target volumes in high-grade glioma patients. European journal of nuclear medicine and molecular imaging. 2009;36(2):182–193. doi: 10.1007/s00259-008-0943-6. [DOI] [PubMed] [Google Scholar]
- [79].Nestle U, Kremp S, Schaefer-Schuler A, Sebastian-Welsch C, Hellwig D, Rübe C, Kirsch C. Comparison of different methods for delineation of 18f-fdg pet–positive tissue for target volume definition in radiotherapy of patients with non–small cell lung cancer. Journal of Nuclear Medicine. 2005;46(8):1342–1348. [PubMed] [Google Scholar]
- [80].Erdi Y, Mawlawi O, Larson S, Imbriaco M, Yeung H, Finn R, Humm J. Segmentation of lung lesion volume by adaptive positron emission tomography image thresholding. Cancer. 1997;80(S12):2505–2509. doi: 10.1002/(sici)1097-0142(19971215)80:12+<2505::aid-cncr24>3.3.co;2-b. [DOI] [PubMed] [Google Scholar]
- [81].Caldwell C, Mah K, Skinner M, Danjoux C. Can pet provide the 3d extent of tumor motion for individualized internal target volumes? a phantom study of the limitations of ct and the promise of pet. International Journal of Radiation Oncology, Biology, Physics. 2003;55(5):1381–1393. doi: 10.1016/s0360-3016(02)04609-6. [DOI] [PubMed] [Google Scholar]
- [82].Nagel C, Bosmans G, Dekker A, Ollers M, De Ruysscher D, Lambin P, Minken A, Lang N, Schafers K. Phased attenuation correction in respiration correlated computed tomography/positron emitted tomography. Medical physics. 2006;33(6):1840–1847. doi: 10.1118/1.2198170. [DOI] [PubMed] [Google Scholar]
- [83].Paulino A, Koshy M, Howell R, Schuster D, Davis L. Comparison of ct-and fdg-pet-defined gross tumor volume in intensity-modulated radiotherapy for head-and-neck cancer. International Journal of Radiation Oncology, Biology, Physics. 2005;61(5):1385–1392. doi: 10.1016/j.ijrobp.2004.08.037. [DOI] [PubMed] [Google Scholar]
- [84].Deniaud-Alexandre E, Touboul E, Lerouge D, Grahek D, Foulquier J, Petegnief Y, GrËs B, El Balaa H, Keraudy K, Kerrou K, et al. Impact of computed tomography and 18f-deoxyglucose coincidence detection emission tomography image fusion for optimization of conformal radiotherapy in non-small-cell lung cancer. International Journal of Radiation Oncology, Biology, Physics. 2005;63(5):1432–1441. doi: 10.1016/j.ijrobp.2005.05.016. [DOI] [PubMed] [Google Scholar]
- [85].Biehl K, Kong F, Dehdashti F, Jin J, Mutic S, El Naqa I, Siegel B, Bradley J. 18f-fdg pet definition of gross tumor volume for radiotherapy of non–small cell lung cancer: Is a single standardized uptake value threshold approach appropriate? Journal of Nuclear Medicine. 2006;47(11):1808–1812. [PubMed] [Google Scholar]
- [86].Hong R, Halama J, Bova D, Sethi A, Emami B. Correlation of pet standard uptake value and ct window-level thresholds for target delineation in ct-based radiation treatment planning. International Journal of Radiation Oncology, Biology, Physics. 2007;67(3):720–726. doi: 10.1016/j.ijrobp.2006.09.039. [DOI] [PubMed] [Google Scholar]
- [87].Day E, Betler J, Parda D, Reitz B, Kirichenko A, Mohammadi S, Miften M. A region growing method for tumor volume segmentation on pet images for rectal and anal cancer patients. Medical physics. 2009;36(10):4349–4358. doi: 10.1118/1.3213099. [DOI] [PubMed] [Google Scholar]
- [88].Tylski P, Stute S, Grotus N, Doyeux K, Hapdey S, Gardin I, Vanderlinden B, Buvat I. Comparative assessment of methods for estimating tumor volume and standardized uptake value in 18f-fdg pet. Journal of Nuclear Medicine. 2010;51(2):268–276. doi: 10.2967/jnumed.109.066241. [DOI] [PubMed] [Google Scholar]
- [89].Van Baardwijk A, Bosmans G, Boersma L, Buijsen J, Wanders S, Hochstenbag M, Van Suylen R, Dekker A, Dehing-Oberije C, Houben R, et al. Pet-ct–based auto-contouring in non–small-cell lung cancer correlates with pathology and reduces interobserver variability in the delineation of the primary tumor and involved nodal volumes. International Journal of Radiation Oncology, Biology, Physics. 2007;68(3):771–778. doi: 10.1016/j.ijrobp.2006.12.067. [DOI] [PubMed] [Google Scholar]
- [90].Yu W, Fu X, Zhang Y, Xiang J, Shen L, Jiang G, Chang J. Gtv spatial conformity between different delineation methods by 18fdg pet/ct and pathology in esophageal cancer. Radiotherapy and Oncology. 2009;93(3):441–446. doi: 10.1016/j.radonc.2009.07.003. [DOI] [PubMed] [Google Scholar]
- [91].Wanet M, Lee JA, Weynand B, De Bast M, Poncelet A, Lacroix V, Coche E, Grégoire V, Geets X. Gradient-based delineation of the primary gtv on fdg-pet in non-small cell lung cancer: a comparison with threshold-based approaches. ct and surgical specimens, Radiotherapy and Oncology. 2011;98(1):117–125. doi: 10.1016/j.radonc.2010.10.006. [DOI] [PubMed] [Google Scholar]
- [92].Chen C, Muzic R, Jr, Nelson A, Adler L. Simultaneous recovery of size and radioactivity concentration of small spheroids with pet data. Journal of Nuclear Medicine. 1999;40(1):118–130. [PubMed] [Google Scholar]
- [93].Yaremko B, Riauka T, Robinson D, Murray B, Alexander A, McEwan A, Roa W. Thresholding in pet images of static and moving targets. Physics in medicine and biology. 2005;50(24):5969–5982. doi: 10.1088/0031-9155/50/24/014. [DOI] [PubMed] [Google Scholar]
- [94].Black Q, Grills I, Kestin L, Wong C, Wong J, Martinez A, Yan D. Defining a radiotherapy target with positron emission tomography. International Journal of Radiation Oncology, Biology, Physics. 2004;60(4):1272–1282. doi: 10.1016/j.ijrobp.2004.06.254. [DOI] [PubMed] [Google Scholar]
- [95].Drever L, Robinson D, McEwan A, Roa W. A local contrast based approach to threshold segmentation for pet target volume delineation. Medical physics. 2006;33(6):1583–1594. doi: 10.1118/1.2198308. [DOI] [PubMed] [Google Scholar]
- [96].Davis J, Reiner B, Huser M, Burger C, Szekely G, Ciernik I. Assessment of 18f pet signals for automatic target volume definition in radiotherapy treatment planning. Radiotherapy and Oncology. 2006;80:43–50. doi: 10.1016/j.radonc.2006.07.006. [DOI] [PubMed] [Google Scholar]
- [97].Drever L, Roa W, McEwan A, Robinson D. Iterative threshold segmentation for pet target volume delineation. Medical physics. 2007;34(4):1253–1265. doi: 10.1118/1.2712043. [DOI] [PubMed] [Google Scholar]
- [98].Schaefer A, Kremp S, Hellwig D, Rübe C, Kirsch C, Nestle U. A contrast-oriented algorithm for fdg-pet-based delineation of tumour volumes for the radiotherapy of lung cancer: derivation from phantom measurements and validation in patient data. European Journal of Nuclear Medicine and Molecular Imaging. 2008;35(11):1989–1999. doi: 10.1007/s00259-008-0875-1. [DOI] [PubMed] [Google Scholar]
- [99].Brambilla M, Matheoud R, Secco C, Loi G, Krengli M, Inglese E. Threshold segmentation for pet target volume delineation in radiation treatment planning: the role of target-to-background ratio and target size. Medical physics. 2008;35(4):1207–1213. doi: 10.1118/1.2870215. [DOI] [PubMed] [Google Scholar]
- [100].Nehmeh S, El-Zeftawy H, Greco C, Schwartz J, Erdi Y, Kirov A, Schmidtlein C, Gyau A, Larson S, Humm J. An iterative technique to segment pet lesions using a monte carlo based mathematical model. Medical physics. 2009;36(10):4803–4809. doi: 10.1118/1.3222732. [DOI] [PubMed] [Google Scholar]
- [101].Riegel A, Bucci M, Mawlawi O, Johnson V, Ahmad M, Sun X, Luo D, Chandler A, Pan T. Target definition of moving lung tumors in positron emission tomography: correlation of optimal activity concentration thresholds with object size, motion extent, and source-to-background ratio. Medical physics. 2010;37(4):1742–1752. doi: 10.1118/1.3315369. [DOI] [PMC free article] [PubMed] [Google Scholar]
- [102].Matheoud R, Della Monica P, Secco C, Loi G, Krengli M, Inglese E, Brambilla M. Influence of different contributions of scatter and attenuation on the threshold values in contrast-based algorithms for volume segmentation. Physica Medica. 2011;27(1):44–51. doi: 10.1016/j.ejmp.2010.02.003. [DOI] [PubMed] [Google Scholar]
- [103].van Dalen J, Hoffmann A, Dicken V, Vogel W, Wiering B, Ruers T, Karssemeijer N, Oyen W. A novel iterative method for lesion delineation and volumetric quantification with fdg pet. Nuclear medicine communications. 2007;28(6):485–293. doi: 10.1097/MNM.0b013e328155d154. [DOI] [PubMed] [Google Scholar]
- [104].King M, Long D, Brill A. Spect volume quantitation: influence of spatial resolution, source size and shape, and voxel size. Medical Physics. 1997;18(5):1016–1024. doi: 10.1118/1.596737. [DOI] [PubMed] [Google Scholar]
- [105].Hofheinz F, Dittrich S, Potzsch C, van den Hoff J. Effects of cold sphere walls in pet phantom measurements on the volume reproducing threshold. Physics in Medicine and Biology. 2010;55(4):1099–1113. doi: 10.1088/0031-9155/55/4/013. [DOI] [PubMed] [Google Scholar]
- [106].Lee J. Segmentation of positron emission tomography images: Some recommendations for target delineation in radiation oncology. Radiotherapy and Oncology. 2010;96(3):302–307. doi: 10.1016/j.radonc.2010.07.003. [DOI] [PubMed] [Google Scholar]
- [107].Geworski L, Knoop B, de Cabrejas M, Knapp W, Munz D. Recovery correction for quantitation in emission tomography: a feasibility study. European Journal of Nuclear Medicine and Molecular Imaging. 2000;27(2):161–169. doi: 10.1007/s002590050022. [DOI] [PubMed] [Google Scholar]
- [108].Ford E, Kinahan P, Hanlon L, Alessio A, Rajendran J, Schwartz D, Phillips M. Tumor delineation using pet in head and neck cancers: threshold contouring and lesion volumes. Medical physics. 2006;33:4280–4288. doi: 10.1118/1.2361076. [DOI] [PubMed] [Google Scholar]
- [109]. [accessed 19-December-2013];Philips, Vereos pet/ct. 2013 www.healthcare.philips.com/us_en/clinicalspecialities/radiology/solutions/vereos.
- [110].Ballangan C, Chan C, Wang X, Feng D. The impact of reconstruction algorithms on semi-automatic small lesion segmentation for pet: A phantom study. Engineering in Medicine and Biology Society, EMBC, 2011 Annual International Conference of the IEEE; 2011; pp. 8483–8436. [DOI] [PubMed] [Google Scholar]
- [111].Mhd Saeed S, Maysam A, Abbes A, Habib Z. Artificial neural network-based system for pet volume segmentation. International Journal of Biomedical Imaging. 2010 doi: 10.1155/2010/105610. [DOI] [PMC free article] [PubMed] [Google Scholar]
- [112].Kim J, Wen L, Eberl S, Fulton R, Feng D. Use of anatomical priors in the segmentation of pet lung tumor images. Nuclear Science Symposium Conference Record, 2007. NSS’07. IEEE; 2007.pp. 4242–4245. [Google Scholar]
- [113].Yu H, Caldwell C, Mah K, Poon I, Balogh J, MacKenzie R, Khaouam N, Tirona R. Automated radiation targeting in head-and-neck cancer using region-based texture analysis of pet and ct images. International Journal of Radiation Oncology, Biology, Physics. 2009;75(2):618–625. doi: 10.1016/j.ijrobp.2009.04.043. [DOI] [PubMed] [Google Scholar]
- [114].Montgomery D, Amira A, Zaidi H. Fully automated segmentation of oncological pet volumes using a combined multiscale and statistical model. Medical physics. 2007;34(2):722–736. doi: 10.1118/1.2432404. [DOI] [PubMed] [Google Scholar]
- [115].Amira A, Chandrasekaran S, Montgomery D, Servan Uzun I. A segmentation concept for positron emission tomography imaging using multiresolution analysis. Neurocomputing. 2008;71(10):1954–1965. [Google Scholar]
- [116].Belhassen S, Zaidi H. A novel fuzzy c-means algorithm for unsupervised heterogeneous tumor quantification in pet. Medical Physics. 2010;37(3):1309–1324. doi: 10.1118/1.3301610. [DOI] [PubMed] [Google Scholar]
- [117].Nguyen T, Wu J. Dirichlet gaussian mixture model: Application to image segmentation. Image and Vision Computing. 2011;29(12):818–828. [Google Scholar]
- [118].Hatt M, Cheze le Rest C, Turzo A, Roux C, Visvikis D. A fuzzy locally adaptive bayesian segmentation approach for volume determination in pet. IEEE Transactions on Medical Imaging. 2009;28(6):881–893. doi: 10.1109/TMI.2008.2012036. [DOI] [PMC free article] [PubMed] [Google Scholar]
- [119].Yang F, Grigsby P. Delineation of fdg-pet tumors from heterogeneous background using spectral clustering. European Journal of Radiology. 2012;81(11):3535–3541. doi: 10.1016/j.ejrad.2012.01.001. [DOI] [PMC free article] [PubMed] [Google Scholar]
- [120].Perona P, Malik J. Scale-space and edge detection using anisotropic diffusion. IEEE Transactions on Pattern Analysis and Machine Intelligence. 1990;12(7):629–639. [Google Scholar]
- [121].Aristophanous M, Penney BC, Martel MK, Pelizzari CA. A gaussian mixture model for definition of lung tumor volumes in positron emission tomography. Medical physics. 2007;34:4223–4235. doi: 10.1118/1.2791035. [DOI] [PubMed] [Google Scholar]
- [122].Hofheinz F, Langner J, Petr J, Beuthien-Baumann B, Steinbach J, Kotzerke J, van den Hoff J. An automatic method for accurate volume delineation of heterogeneous tumors in pet. Medical Physics. 40(8) doi: 10.1118/1.4812892. [DOI] [PubMed] [Google Scholar]
- [123].Hatt M, Cheze le Rest C, Descourt P, Dekker A, De Ruysscher D, Oellers M, Lambin P, Pradier O, Visvikis D. Accurate automatic delineation of heterogeneous functional volumes in positron emission tomography for oncology applications. International Journal of Radiation Oncology* Biology* Physics. 2010;77(1):301–308. doi: 10.1016/j.ijrobp.2009.08.018. [DOI] [PubMed] [Google Scholar]
- [124].Hatt M, Cheze-le Rest C, Van Baardwijk A, Lambin P, Pradier O, Visvikis D. Impact of tumor size and tracer uptake heterogeneity in 18f-fdg pet and ct non–small cell lung cancer tumor delineation. Journal of Nuclear Medicine. 2011;52(11):1690–1697. doi: 10.2967/jnumed.111.092767. [DOI] [PMC free article] [PubMed] [Google Scholar]
- [125].Hatt M, Cheze-Le Rest C, Aboagye EO, Kenny LM, Rosso L, Turkheimer FE, Albarghach NM, Metges J-P, Pradier O, Visvikis D. Reproducibility of 18f-fdg and 3-deoxy-3-18f-fluorothymidine pet tumor volume measurements. Journal of Nuclear Medicine. 2010;51(9):1368–1376. doi: 10.2967/jnumed.110.078501. [DOI] [PubMed] [Google Scholar]
- [126].Le Maitre A, Hatt M, Pradier O, Cheze-le Rest C, Visvikis D. Impact of the accuracy of automatic tumour functional volume delineation on radiotherapy treatment planning. Physics in Medicine and Biology. 2012;57(17):5381. doi: 10.1088/0031-9155/57/17/5381. [DOI] [PubMed] [Google Scholar]
- [127].de Figueiredo BH, Merlin T, de Clermont-Gallerande H, Hatt M, Vimont D, Fernandez P, Lamare F. Potential of [18f]-fluoromisonidazole positron-emission tomography for radiotherapy planning in head and neck squamous cell carcinomas. Strahlentherapie und Onkologie. 2013;189(12):1015–1019. doi: 10.1007/s00066-013-0454-7. [DOI] [PubMed] [Google Scholar]
- [128].Hofheinz F, Ptzsch C, Oehme L, Beuthien-Baumann B, Steinbach J, Kotzerke J, van den Hoff J. Automatic volume delineation in oncological pet. evaluation of a dedicated software tool and comparison with manual delineation in clinical data sets. Nuklearmedizin. 2012;51(1):9–16. doi: 10.3413/Nukmed-0419-11-07. [DOI] [PubMed] [Google Scholar]
- [129].Torigian D, R.F. L, Alapati S, Bodapati G, Hofheinz F, van den Hoff J, Saboury B, Alavi A. Feasibility and performance of novel software to quantify metabolically active volumes and 3d partial volume corrected suv and metabolic volumetric products of spinal bone marrow metastases on 18f-fdg-pet/ct. Hell J Nucl Med. 2011;14(1):8–14. [PubMed] [Google Scholar]
- [130].Pham DL, Xu C, Prince JL. Current methods in medical image segmentation 1. Annual review of biomedical engineering. 2000;2(1):315–337. doi: 10.1146/annurev.bioeng.2.1.315. [DOI] [PubMed] [Google Scholar]
- [131].Ma Z, Tavares J, Jorge R. Segmentation of structures in medical images: review and a new computational framework. Proceedings of 8th International Symposium on Computer Methods in Biomechanics and Biomedical Engineering; 2008. [Google Scholar]
- [132].Kerhet A, Small C, Quon H, Riauka T, Greiner R, McEwan A, Roa W. Segmentation of lung tumours in positron emission tomography scans: A machine learning approach. Artificial Intelligence in Medicine. 2009:146–155. [Google Scholar]
- [133].Yoshida E, Kitamura K, Kimura Y, Nishikido F, Shibuya K, Yamaya T, Murayama H. Inter-crystal scatter identification for a depth-sensitive detector using support vector machine for small animal positron emission tomography. Nuclear Instruments and Methods in Physics Research Section A: Accelerators, Spectrometers, Detectors and Associated Equipment. 2007;571(1):243–246. [Google Scholar]
- [134].Foster B, Bagci U, Luna B, Dey B, Bishai W, Jain S, Xu Z, Mollura DJ. Robust segmentation and accurate target definition for positron emission tomography images using affinity propagation. ISBI. 2013:1461–1464. [Google Scholar]
- [135].Foster B, Bagci U, Xu Z, Luna B, Bishai W, Jain S, Mollura DJ. Robust segmentation and accurate target definition for positron emission tomography images using affinity propagation. IEEE Transactions on Biomedical Engineering. 2014;61(3):711–724. doi: 10.1109/TBME.2013.2288258. [DOI] [PMC free article] [PubMed] [Google Scholar]
- [136].Zhu W, Jiang T. Automation segmentation of pet image for brain tumors. Nuclear Science Symposium Conference Record, 2003 IEEE; 2003.pp. 2627–2629. [Google Scholar]
- [137].Boudraa A, Champier J, Cinotti L, Bordet J, Lavenne F, Mallet J. Delineation and quantitation of brain lesions by fuzzy clustering in positron emission tomography. Computerized medical imaging and graphics. 1996;20(1):31–41. doi: 10.1016/0895-6111(96)00025-0. [DOI] [PubMed] [Google Scholar]
- [138].Frey B, Dueck D. Clustering by passing messages between data points. science. 2007;315(5814):972–976. doi: 10.1126/science.1136800. [DOI] [PubMed] [Google Scholar]
- [139].Adams R, Bischof L. Seeded region growing. IEEE Transactions on Pattern Analysis and Machine Intelligence. 1994;16(6):641–647. [Google Scholar]
- [140].Xu Z, Gao Z, Hoffman E, Saha P. Tensor scale-based anisotr pic region growing for segmentation of elongated biological structures. Biomedical Imaging (ISBI), 2012 9th IEEE International Symposium on; 2012.pp. 1032–1035. [Google Scholar]
- [141].Xu Z, Bagci U, Kubler A, Luna B, Jain S, Bishai WR, Mollura DJ. Computer-aided detection and quantification of cavitary tuberculosis from ct scans. Medical Physics. 40(11) doi: 10.1118/1.4824979. [DOI] [PMC free article] [PubMed] [Google Scholar]
- [142].Xu Z, Bagci U, Foster B, Mollura DJ. A hybrid multi-scale approach to automatic airway tree segmentation from ct scans. Biomedical Imaging (ISBI), 2013 IEEE 10th International Symposium on; 2013.pp. 1308–1311. [Google Scholar]
- [143].Li H, Thorstad WL, Biehl KJ, Laforest R, Su Y, Shoghi KI, Donnelly ED, Low DA, Lu W. A novel pet tumor delineation method based on adaptive region-growing and dual-front active contours. Medical Physics. 2008;35(8):3711–3721. doi: 10.1118/1.2956713. [DOI] [PMC free article] [PubMed] [Google Scholar]
- [144].Xu Z, Saha PK, Dasgupta S. Tensor scale: An analytic approach with efficient computation and applications. Computer Vision and Image Understanding. 2012;116(10):1060–1075. doi: 10.1016/j.cviu.2012.05.006. [DOI] [PMC free article] [PubMed] [Google Scholar]
- [145].Xu Z, Zhao F, Bhagalia R, Das B. Generic rebooting scheme and model-based probabilistic pruning algorithm for tree-like structure tracking. Biomedical Imaging (ISBI), 2012 9th IEEE International Symposium on; 2012.pp. 796–799. [Google Scholar]
- [146].Li H, Thorstad W, Biehl K, Laforest R, Su Y, Shoghi K, Donnelly E, Low D, Lu W. A novel pet tumor delineation method based on adaptive region-growing and dual-front active contours. Medical physics. 2008;35(8):3711–3721. doi: 10.1118/1.2956713. [DOI] [PMC free article] [PubMed] [Google Scholar]
- [147].Boykov Y, Veksler O, Zabih R. Fast approximate energy minimization via graph cuts. IEEE Transactions on Pattern Analysis and Machine Intelligence. 2001;23(11):1222–1239. [Google Scholar]
- [148].Wechsler H, Kidode M. A random walk procedure for texture discrimination. IEEE Transactions on Pattern Analysis and Machine Intelligence PAMI-1. 1979;(3):272–280. doi: 10.1109/tpami.1979.4766923. [DOI] [PubMed] [Google Scholar]
- [149].Andrews S, Hamarneh G, Saad A. Fast random walker with priors using precomputation for interactive medical image segmentation. Medical Image Computing and Computer-Assisted Intervention–MICCAI; 2010; pp. 9–16. [DOI] [PubMed] [Google Scholar]
- [150].Grady L. Random walks for image segmentation. IEEE Transactions on Pattern Analysis and Machine Intelligence. 2006;28(11):1768–1783. doi: 10.1109/TPAMI.2006.233. [DOI] [PubMed] [Google Scholar]
- [151].Xu Z, Bagci U, Foster B, Mansoor A, Mollura DJ. Medical Image Computing and Computer-Assisted Intervention MICCAI 2013, Vol. 8150 of Lecture Notes in Computer Science. Springer Berlin Heidelberg: 2013. Spatially constrained random walk approach for accurate estimation of airway wall surfaces; pp. 559–566. [DOI] [PMC free article] [PubMed] [Google Scholar]
- [152].Kass M, Witkin A, Terzopoulos D. Snakes: Active contour models. International journal of computer vision. 1988;1(4):321–331. [Google Scholar]
- [153].Caselles V, Catté F, Coll T, Dibos F. A geometric model for active contours in image processing. Numerische mathematik. 1993;66(1):1–31. [Google Scholar]
- [154].Hsu C-Y, Liu C-Y, Chen C-M. Automatic segmentation of liver pet images. Computerized Medical Imaging and Graphics. 2008;32(7):601–610. doi: 10.1016/j.compmedimag.2008.07.001. [DOI] [PubMed] [Google Scholar]
- [155].Abdoli M, Dierckx R, Zaidi H. Contourlet-based active contour model for pet image segmentation. Medical physics. 2013;40(8):082507. doi: 10.1118/1.4816296. [DOI] [PubMed] [Google Scholar]
- [156].Sethian JA. Level set methods and fast marching methods: evolving interfaces in computational geometry, fluid mechanics, computer vision, and materials science. Vol. 3. Cambridge university press; 1999. [Google Scholar]
- [157].Vemuri B, Ye J, Chen Y, Leonard C. A level-set based approach to image registration. IEEE Workshop on Mathematical Methods in Biomedical Image Analysis; 2000.pp. 86–93. [Google Scholar]
- [158].Vemuri BC, Ye J, Chen Y, Leonard C, et al. Image registration via level-set motion: Applications to atlas-based segmentation. Medical image analysis. 2003;7(1):1–20. doi: 10.1016/s1361-8415(02)00063-4. [DOI] [PubMed] [Google Scholar]
- [159].Qi J. Ph.D. thesis. University of Toronto; 2011. Pet image segmentation and reconstruction using level set method. [Google Scholar]
- [160].El Naqa I, Bradley J, Deasy J, Biehl K, Laforest R, Low D. Improved analysis of pet images for radiation therapy. Proceedings of the 14th International Conference on the Use of Computers in Radiation Therapy; 2004.pp. 361–363. [Google Scholar]
- [161].Lin YC, Tsai YP, Hung YP, Shih ZC. Comparison between immersion-based and toboggan-based watershed image segmentation. IEEE Transactions on Image Processing. 2006;15(3):632–640. doi: 10.1109/tip.2005.860996. [DOI] [PubMed] [Google Scholar]
- [162].Geets X, Lee JA, Bol A, Lonneux M, Grégoire V. A gradient-based method for segmenting fdg-pet images: methodology and validation. European journal of nuclear medicine and molecular imaging. 2007;34(9):1427–1438. doi: 10.1007/s00259-006-0363-4. [DOI] [PubMed] [Google Scholar]
- [163].Liao S, Penney BC, Zhang H, Suzuki K, Pu Y. Prognostic value of the quantitative metabolic volumetric measurement on 18f-fdg pet/ct in stage iv nonsurgical small-cell lung cancer. Academic radiology. 2012;19(1):69–77. doi: 10.1016/j.acra.2011.08.020. [DOI] [PubMed] [Google Scholar]
- [164].Riddell C, Brigger P, Carson R, Bacharach S. The watershed algorithm: a method to segment noisy pet transmission images. IEEE Transactions on Nuclear Science. 1999;46(3):713–719. [Google Scholar]
- [165].Yu H, Caldwell C, Mah K, Mozeg D. Coregistered fdg pet/ct-based textural characterization of head and neck cancer for radiation treatment planning. IEEE Transactions on Medical Imaging. 2009;28(3):374–383. doi: 10.1109/TMI.2008.2004425. [DOI] [PubMed] [Google Scholar]
- [166].Han D, Bayouth J, Song Q, Taurani A, Sonka M, Buatti J, Wu X. Globally optimal tumor segmentation in pet-ct images: A graph-based co-segmentation method. Information Processing in Medical Imaging; 2011; pp. 245–256. [DOI] [PMC free article] [PubMed] [Google Scholar]
- [167].El Naqa I, Yang D, Apte A, Khullar D, Mutic S, Zheng J, Bradley J, Grigsby P, Deasy J. Concurrent multimodality image segmentation by active contours for radiotherapy treatment planning. Medical physics. 2007;34(12):4738–4749. doi: 10.1118/1.2799886. [DOI] [PubMed] [Google Scholar]
- [168].Markel D, Caldwell C, Alasti H, Soliman H, Ung Y, Lee J, Sun A. Automatic segmentation of lung carcinoma using 3d texture features in 18-fdg pet/ct. International Journal of Molecular Imaging. doi: 10.1155/2013/980769. [DOI] [PMC free article] [PubMed] [Google Scholar]
- [169].Toet A, M.A. H, Nikolov S, Lewis J, Dixon T, Bull D, Canagarajah C. Towards cognitive image fusion. Information Fusion. 2010;11(2):95–103. [Google Scholar]
- [170].Song Q, Bai J, Han D, Bhatia S, Sun W, Rockey W, Bayouth J, Buatti J, Wu X. Optimal co-segmentation of tumor in pet-ct images with context information. IEEE Transactions on Medical Imaging. 2013;32:1685–1697. doi: 10.1109/TMI.2013.2263388. [DOI] [PMC free article] [PubMed] [Google Scholar]
- [171].Giesel F, Mehndiratta A, Locklin J, McAuliffe M, White S, Choyke P, Knopp M, Wood B, Haberkorn U, von Tengg-Kobligk H. Image fusion using ct. mri and pet for treatment planning, navigation and follow up in percutaneous rfa, Exp. Oncol. 2009;31(2):106–114. [PMC free article] [PubMed] [Google Scholar]
- [172].Israel O, Keidar Z, Iosilevsky G, Bettman L, Sachs J, Frenkel A. Review the fusion of anatomic and physiologic imaging in the management of patients with cancer. Semin Nucl Med. 2001;31(3):191–205. doi: 10.1053/snuc.2001.23525. [DOI] [PubMed] [Google Scholar]
- [173].Bockisch A, Beyer T, Antoch G, Freudenberg LS, Kühl H, Debatin JF, Müller SP. Positron emission tomography/computed tomography–imaging protocols. artifacts, and pitfalls, Molecular Imaging & Biology. 2004;6(4):188–199. doi: 10.1016/j.mibio.2004.04.006. [DOI] [PubMed] [Google Scholar]
- [174].Sureshbabu W, Mawlawi O. Pet/ct imaging artifacts. Journal of nuclear medicine technology. 2005;33(3):156–161. [PubMed] [Google Scholar]
- [175].Keereman V, Holen R, Mollet P, Vandenberghe S. The effect of errors in segmented attenuation maps on pet quantification. Medical Physics. 2011;38(11):6010–6019. doi: 10.1118/1.3651640. [DOI] [PubMed] [Google Scholar]
- [176].Kim J, Cai W, Feng D, Eberl S. Segmentation of voi from multidimensional dynamic pet images by integrating spatial and temporal features. IEEE Transactions on Information Technology in Biomedicine. 2006;10(4):637–646. doi: 10.1109/titb.2006.874192. [DOI] [PubMed] [Google Scholar]
- [177].Turkheimer F, Edison P, Pavese N, Roncaroli F, Anderson A, Hammers A, Gerhard A, Hinz R, Tai Y, Brooks D. Reference and target region modeling of [11c]-(r)-pk11195 brain studies. Journal of Nuclear Medicine. 2007;48(1):158–167. [PubMed] [Google Scholar]
- [178].Kimura Y, Senda M, Alpert N. Fast formation of statistically reliable fdg parametric images based on clustering and principal components. Physics in medicine and biology. 2002;47(3):455–468. doi: 10.1088/0031-9155/47/3/307. [DOI] [PubMed] [Google Scholar]
- [179].Maroy R, Boisgard R, Comtat C, Frouin V, Cathier P, Duchesnay E, Dollé F, Nielsen P, Trébossen R, Tavitian B. Segmentation of rodent whole-body dynamic pet images: an unsupervised method based on voxel dynamics. IEEE Transactions on Medical Imaging. 2008;27(3):342–354. doi: 10.1109/TMI.2007.905106. [DOI] [PubMed] [Google Scholar]
- [180].Guo H, Renaut R, Chen K, Reiman E. Clustering huge data sets for parametric pet imaging. Biosystems. 2003;71(1):81–92. doi: 10.1016/s0303-2647(03)00112-6. [DOI] [PubMed] [Google Scholar]
- [181].Wong K, Feng D, Meikle S, Fulham M. Segmentation of dynamic pet images using cluster analysis. IEEE Transactions on Nuclear Science. 2002;49(1):200–207. [Google Scholar]
- [182].Shepherd T, Owenius R. Gaussian process models of dynamic pet for functional volume definition in radiation oncology. IEEE Transactions on Medical Imaging. 2012;31(8):1542–1546. doi: 10.1109/TMI.2012.2193896. [DOI] [PubMed] [Google Scholar]
- [183].Jan S, Santin G, Strul D, Staelens S, Assie K, Autret D, Avner S, Barbier R, Bardies M, Bloomfield P, et al. Gate: a simulation toolkit for pet and spect. Physics in medicine and biology. 2004;49(19):4543. doi: 10.1088/0031-9155/49/19/007. [DOI] [PMC free article] [PubMed] [Google Scholar]
- [184].Shepherd T, Berthon B, Galavis P, Spezi E, Apte A, Lee J, Visvikis D, Hatt M, de Bernardi E, Das S, Naqa IE, Nestle U, Schmidtlein C, Zaidi H, Kirov A. Design of a benchmark platform for evaluating pet-based contouring accuracy in oncology applications. European association for nuclear medicine annual meeting; 2012. [Google Scholar]
- [185].Berthon B, Spezi E, Schmidtlein C, Apte A, Galavis P, Zaidi H, Bernardi ED, Lee J, Kirov A. Development of a software platform for evaluating automatic pet segmentation methods. European Society for Radiotherapy and Oncology Meeting; 2013. [Google Scholar]