

Abstract
A major focus of our pediatric cancer research is the discovery of chemical probes to further our understanding of the biology of leukemia harboring fusion proteins arising from chromosomal rearrangements, and to develop novel specifically targeted therapies. The NUP98-NSD1 fusion protein occurs in a highly aggressive subtype of acute myeloid leukemia after rearrangement of the genes NUP98 and NSD1. The methyltransferase activity of NSD1 is retained in the fusion, and it gives rise to abnormally high levels of methylation at lysine 36 on histone 3, enforcing oncogene activation. Therefore, inhibition of the methyltransferase activity of NUP98-NSD1 may be considered a viable therapeutic strategy. Here, we report the development and validation of a highly sensitive and robust luminescence-based assay for NSD1 and other methyltransferases that use S-adenosylmethionine (SAM) as a methyl donor. The assay quantifies S-adenosylhomocysteine (SAH), which is produced during methyl transfer from SAM. SAH is converted enzymatically to adenosine monophosphate (AMP); in the process, adenosine triphosphate (ATP) is consumed and the amount of ATP remaining is measured using a luminescent assay kit. The assay was validated by pilot high-throughput screening (HTS), dose-response confirmation of hits, and elimination of artifacts through counterscreening against SAH detection in the absence of NSD1. The known methyltransferase inhibitor suramin was identified, and profiled for selectivity against the histone methyltransferases EZH2, SETD7, and PRMT1. HTS using the luminescent NSD1 assay described here has the potential to deliver selective NSD1 inhibitors that may serve as leads in the development of targeted therapies for NUP98-NSD1-driven leukemias.
Introduction
As a part of the Nemours Center for Childhood Cancer Research, the High-Throughput Screening (HTS) and Drug Discovery Lab is focused on the discovery of novel chemical probes to explore ways in which the biology of pediatric cancer differs from that of adult malignancy, and to exploit these differences to develop targeted therapeutics for these devastating diseases. There have been dramatic advances in the treatment of pediatric leukemia over the past 50 years, but there remain subsets of patients who respond poorly to treatment. Many of the high-risk cases of childhood leukemia with the poorest prognosis have been found to harbor specific genetic signatures, often resulting from chromosomal rearrangements.1 A major focus of our pediatric cancer research is the discovery of chemical probes to further understanding of the biology of leukemia harboring fusion proteins arising from chromosomal rearrangements, and to develop novel specifically targeted therapies.
The NUP98-NSD1 fusion protein (Fig. 1) occurs in a subtype of acute myeloid leukemia (AML) after rearrangement of the genes NUP98 (nucleoporin, 98-kDa component of nuclear pore complex) and NSD1 (nuclear receptor-binding SET domain protein 1). Since the first case was identified 13 years ago,2 it has become clear that the NUP98-NSD1 is associated with a very poor prognosis. A recent comprehensive study found NUP98-NSD1 in 4%–5% of pediatric AML, associated with a grim 4-year event-free survival rate of <10%.3 NSD1 is a histone methyltransferase that regulates gene transcription through methylation of lysine 36 in histone 3 (H3K36).4,5 The methyltransferase activity of NSD1 is retained in the NUP98-NSD1 fusion, and it gives rise to abnormally high levels of H3K36 methylation, enforcing activation of transcription of oncogenes such as HOXA9. Elevated expression of HOXA9 in AML harboring NUP98-NSD1 blocks differentiation of blood cell progenitors, leading them to acquire the capacity for unlimited self-renewal and malignant transformation.6 Abolition of the methyltransferase activity of NUP98-NSD1 by point mutation demonstrated its essential role; the level of H3K36 methylation at the HoxA9 locus was reduced, and mouse progenitor cells harboring NUP98-NSD1 underwent normal differentiation.6 Therefore, inhibition of the methyltransferase activity of NUP98-NSD1 may be considered a viable therapeutic strategy. To date, no compounds directed at this fusion have been reported; therefore, we sought to develop an HTS-compatible assay to discover inhibitors of NSD1 to explore their effect on leukemia harboring NUP98-NSD1.
Fig. 1.
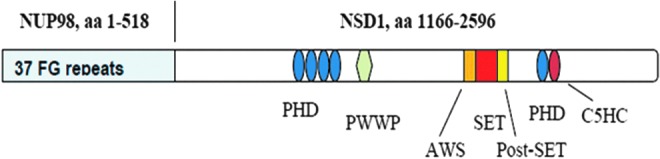
NUP98-NSD1 fusion protein. Chromosomal rearrangement leads to fusion of the C-terminal half of NSD1 to amino acids 1–518 of NUP98. The SET domain of the NSD1 portion comprises the catalytic domain responsible for methylating lysine 36 in histone 3. The SET-associated cysteine-rich AWS domain activates NSD1 through binding to DNA.
In biochemical assays, NSD1 is inactive toward peptide and histone substrates, and it displays very low turnover using histone octamers or nucleosomes, requiring highly sensitive detection of as little as 10 nM of product.7,8 Our preference was for a homogeneous assay format that is capable of accommodating complex methyl-acceptor substrates and adaptable for use with other methyltransferases in addition to NSD1. All histone methyltransferases employ S-adenosylmethionine (SAM, Fig. 2) as a methyl donor, so we focused our attention on detection of S-adenosylhomocysteine (SAH, Fig. 2), the product of methyl transfer from SAM. Fluorescence polarization assays to detect SAH have been reported using an anti-SAH antibody,9 and using enzyme-coupled conversion of SAH to adenosine monophosphate (AMP) followed by detection of AMP using an anti-AMP antibody.10 Fluorescence intensity assays have been developed in which SAH is enzymatically converted to homocysteine or urate and hydrogen peroxide, detectable via a thiol-reactive fluorophore11,12 or resorufin,13 respectively. Despite these literature reports, we decided to develop a novel assay based on the extremely high sensitivity of a luminescent readout. There have been 2 publications reporting essentially the same enzyme-coupled luminescence-based assay in each case,14,15 but this method required expression and purification of 3 coupling enzymes, none of which are commercially available. We aimed to design an assay employing readily available enzymes to shorten assay development time and to ensure consistent lot-to-lot variability.
Fig. 2.

Structures of assay reagents and pilot screening hits. Structures are shown for SAM, the methyl donor in enzyme-catalyzed histone methylation; SAH, the resulting product after methyl transfer; and sinefungin, a competitive inhibitor of histone methyltransferases and SAHH that closely resembles both SAM and SAH. Compounds 1–12 represent the NSD1 hits listed in Table 2. SAH, S-adenosylhomocysteine; SAHH, S-adenosylhomocysteine hydrolase; SAM, S-adenosylmethionine.
Here, we report the development and validation of a highly sensitive and robust luminescence-based assay for NSD1 and other methyltransferases that use SAM as a methyl donor. HTS assay readiness was demonstrated by screening NSD1 against 1,716 pharmacologically active drugs and natural products from the MicroSource Spectrum library. Hits were confirmed by dose response, and artifacts were identified and eliminated through counterscreening against SAH detection in the absence of NSD1.
Materials and Methods
Reagents
Recombinant histone octamer was purchased from Xtal BioStructures (Natick, MA). SAM was purchased from New England Biolabs (Ipswich, MA) and purified in the Nemours Cell Science Core Lab using reverse-phase HPLC to remove contaminating SAH. Human NSD1, amino acids 1849–2094, was expressed and purified by BPS Biosciences (San Diego, CA). NSD1 construct encompassing amino acids 1538–2696 was obtained from Reaction Biology (Malvern, PA). Double-stranded DNA, 41 bp (sequence CTC TCT TTG AGG ACA CCA ACC TGG CGG CCA TCC ACG CCA AG) was purchased from Integrated DNA Technologies (Coralville, IA). Human full-length S-adenosylhomocysteine hydrolase (SAHH) was purchased from Abcam (Cambridge, MA). Human adenosine kinase (AK) was from NovoCIB (Lyon, France). Kinase-Glo was from Promega (Madison, WI). Catalase, adenosine triphosphate (ATP), and methyltransferase inhibitor sinefungin were from Sigma (St. Louis, MO). White 384-well low-volume non-binding assay plates (Item No. 784904) were from Greiner Bio-One (Monroe, NC). In addition, the following were purchased for the histone methyltransferase selectivity panel. Enzymes EZH2 complex (with AEBP2, EED, RbAp48, and SUZ12), SETD7, and PRMT1 were from Reaction Biology, Cayman Chemical (Ann Arbor, MI), and BPS Bioscience, respectively. Histone H3.3 and histone H4 were from Reaction Biology and New England Biolabs, respectively.
Compound Libraries
The Spectrum Collection compound library containing 2,000 FDA-approved drugs and bioactive natural products at 10 mM concentration in DMSO was obtained from MicroSource, Inc (Gaylordsville, CT).16 The library was reformatted into polypropylene V-bottom 384-well microplates obtained from Greiner Bio-One (Catalog No. 781280) at 4 mM in DMSO.
Assay Development and Optimization
Assay development experiments were performed at room temperature in white low-volume, non-binding 384-well plates in an assay volume of 10 μL. All assay reagents except Kinase-Glo were incubated to enable NSD1-catalyzed generation of SAH and enzyme-coupled conversion of SAH to AMP with concomitant depletion of ATP. After a fixed time, 10 μL of Kinase-Glo was added, and luminescence was determined after a further 15 min on a Perkin Elmer EnVision plate reader. The Kinase-Glo reagent was supplemented with 400 mM NaCl to inhibit NSD1 activity and prevent further SAH generation. NSD1 activity corresponded to a decrease in luminescence counts per second (CPS) over time. CPS values were converted to ATP depletion using a linear standard plot of CPS vs. ATP concentration. The amount of ATP depleted, in turn, corresponds to the amount of SAH generated by NSD1. Details of specific experiments are given next.
NSD1 enzyme titration and timecourse
The effect of pH on NSD1 activity was determined in assay buffer (50 mM HEPES, 5 mM MgCl2, 1 mM dithiothreitol (DTT), 0.01% Tween-20) adjusted to pH 8.0, 8.5, or 9.0. The initial linear portion of the timecourse of NSD1-catalyzed SAH production was determined in the presence of 200 nM ATP, 300 nM histone octamer, 300 nM DNA, 400 nM SAM, 100 nM SAHH, and 0.5 mU/mL AK. The assay was initiated by the addition of NSD1 to a final concentration of 50 nM. Timepoints were obtained at 0, 15, 30, 45, 60, 90, and 120 min. After the time indicated, Kinase-Glo was added, and luminescence was read after 15 min. The effect of NSD1 concentration on rate of SAH production was measured at pH 8.2 using the buffer composition described earlier. Timepoints were obtained from 0 to 180 min to derive the initial linear portion of the timecourse of NSD1-catalyzed SAH production at 0–150 nM NSD1.
Titration of coupling enzymes and DNA
It is important for an optimal assay that coupling enzyme concentrations are sufficient to convert SAH to AMP more rapidly than it is produced by NSD1, ensuring that NSD1-catalyzed SAH production is rate limiting. To select sufficiently high coupling enzyme concentrations, we titrated SAHH in the presence of a fixed concentration of AK, and vice versa. NSD1 was assayed for 90 min using the conditions described earlier, except that SAHH was varied from 0 to 300 nM or AK was varied from 0 to 1 mU/mL. The presence of DNA is essential for NSD1 activity using histone octamer as a substrate, so DNA was titrated at a fixed concentration of octamer. DNA ranging from 0 to 3,000 nM was added to 500 nM histone octamer, 5 μM SAM, and 50 nM NSD1, and the assay was run for 90 min as described earlier.
Substrate Km determinations
Substrate Km values were determined in the presence of 50 nM NSD1. SAM was varied from 0 to 5,000 nM in 12 dilution steps in the presence of 500 nM Octamer and 500 nM DNA. Histone octamer (and equimolar DNA) was varied from 0 to 1,000 nM in the presence of 400 nM SAM. Test concentrations of histone octamer above 1,000 nM were not attainable due to high salt concentration in the stock solution, which caused inhibition of NSD1. SAH production was quantified using 200 nM ATP, 250 nM SAHH, and 0.25 mU/mL AK. Timepoints were collected up to 180 min as described earlier, and initial linear rates of SAH production were calculated based on ATP depletion calculated from a standard curve after subtraction of background (no NSD1).
Inhibition by NaCl and sinefungin in NSD1 assay and counterscreen
Inhibition by NaCl and sinefungin (structure shown in Fig. 2) was determined against NSD1 and also against the coupling enzymes alone. Testing putative NSD1 inhibitors in a counterscreen comprising the coupling enzymes alone may be used to exclude coupling enzyme inhibitors and other assay artifacts. In both assays, serially diluted inhibitors (0.5–2,000 μM sinefungin and 0.5–500 mM NaCl) were incubated for 120 min with 50 nM NSD1, 400 nM SAM, 300 nM DNA, and ATP and coupling enzymes. In addition, the NSD1 assay contained 300 nM octamer, and the coupling enzyme counterscreen contained 100 nM SAH.
Histone Methyltransferase Selectivity Panel Assay Development
Assays for EZH2, SETD7, and PRMT1 were developed using the same enzyme-coupled SAH detection as used for NSD1, and a similar design of experiments. Enzyme concentration suitable for a 120-min assay was selected based on an enzyme titration. Km values for SAM and histone substrates were determined by varying one substrate in the presence of a fixed concentration of the other. Sinefungin was then tested in dose response against each of the 3 enzymes in the presence of substrates near their respective Km values.
Pilot Screen
Table 1 describes the step-by-step screening protocol. The MicroSource Spectrum collection was screened for inhibition of NSD1 at a single concentration (20 μM); no replicates were performed. Compounds were diluted to 4 mM in DMSO, and 50 nL was transferred using a Janus MDT Automated workstation (Perkin Elmer) fitted with a hydrophobic pintool (V & P Scientific, San Diego, CA) into assay plates containing 4 μL of water/0.01% Tween-20.
Table 1.
Histone Methyltransferase Assay Protocol
| Step | Parameter | Value | Description |
|---|---|---|---|
| 1 | Water | 4 μL | 0.01% Tween-20 |
| 2 | Test compounds | 50 nL | 4 mM in DMSO |
| 3 | Substrate mix | 3 μL | SAM, histone substrate, DNA (in NSD1 assay), and ATP in 2.33×assay buffer |
| 4 | Enzyme mix | 3 μL | Methyltransferase, SAHH, and AK in 1×assay buffer |
| 5 | Incubation time | 120 min | 25°C |
| 6 | Detection and stop reagent | 10 μL | Kinase-Glo (with 400 mM NaCl in NSD1 assay) |
| 7 | Incubation time | 15 min | 25°C |
| 8 | Assay readout | 400–700 nm | Envision plate reader, standard luminescence |
Step Notes
1. Low volume white non-binding plates.
2. Pintool transfer (wash sequence: DMSO:H2O [1:1], 3× isopropanol, 30 s air dry).
3. 384-tip transfer (tip wash sequence: H2O, 3× isopropanol, 30 s air mix and fan to dry).
4. 384-tip transfer with post-dispense mix (tip wash sequence: H2O, 3× isopropanol, 30 s air mix & fan to dry). In NSD1 assay, 667 mM NaCl included for background control wells, columns 2 and 24; in other assays, methyltransferase omitted from background control wells.
5. Final assay mix in 10 μL assay buffer (50 mM HEPES, 5 mM MgC12, 0.01% Tween-20, 1 mM DTT, pH 8.2) as follows. NSD1: 50 nM NSD1, 400 nM SAM, 300 nM histone octamer, 300 nM DNA. PRMT1: 50 nM PRMT1, 1 μM SAM, 500 nM histone H4. SETD7: 20 nM SETD7, 1 μM SAM, 500 nM histone H3.3. EZH2: 30 nM EZH2, 1 μM SAM, 500 nM histone H3.3. All assays also contain 200 nM ATP, 250 nM SAHH, 0.25 mU/mL AK. Plates covered with tape seals.
6. Reagent dispenser: 8-tip non-contact dispense.
7. Plates covered with TopSeal A adhesive sealing film.
8. 0.1 s read.
AK, adenosine kinase; ATP, adenosine triphosphate; DTT, dithiothreitol; SAHH, S-adenosylhomocysteine hydrolase; SAM, S-adenosylmethionine.
Each plate contained 32 replicates of controls (columns 1 and 23) and background (columns 2 and 24). The controls (low signal, 0% inhibition) consisted of NSD1 (BPS BioScience construct, 50 nM), SAM (400 nM), histone octamer (300 nM), DNA (300 nM), ATP and coupling enzymes in 50 mM HEPES, pH 8.2, containing 5 mM MgCl2, 1 mM DTT, and 0.01% Tween-20; the background (high signal, 100% inhibition) also contained 200 mM NaCl to inhibit NSD1. Assay plates (containing compounds) were sandwiched between quality control (QC) plates that consisted of sinefungin at 50 μM in all 320 test wells.
Compounds selected as actives in the initial screen at 20 μM were re-evaluated in dose response in triplicate. A range of concentrations (4 mM–122 nM) of each compound of interest was prepared by a 16-point 2-fold serial dilution in DMSO. Each compound dilution was added by two 50 nL pintool transfers to 3 separate plates, and the assay was performed under identical conditions to the initial pilot screen. The final concentration range for compounds in the assay was 40 μM–1.2 nM. Sinefungin serially diluted in 0.01% Tween-20 was added to each plate as a QC (final concentration 2.0 mM–61 nM). Three separate IC50 values for each compound were determined by non-linear regression analysis of dose-response data on each plate.
Counterscreen
Actives from the initial screen were also counterscreened in parallel in dose response (in triplicate). The counterscreen protocol differed from that used for NSD1 as follows: NSD1 and octamer were excluded, the concentration of SAM was reduced from 400 to 300 nM, and 100 nM of SAH was added. In addition, SAHH was excluded from background wells. Any compounds which caused a decrease in counterscreen signal were considered artifacts that interfere with enzyme-coupled ATP depletion.
Evaluation of DTT-Reactivity of Hits
Confirmed HTS hits were evaluated as DTT-reactive oxidative inactivators of NSD1 by a comparison of compound activity against NSD1 in the presence of DTT, β-mercaptoethanol (BME), or DTT and catalase. NSD1 was pre-incubated with DTT (1 mM) or BME (10 mM) for 1 h at room temperature, after which serially diluted compounds were delivered by pintool to 3 sets of 3 plates and the assay was performed as earlier. One set of plates contained DTT, one contained BME, and the third contained DTT and added catalase (100 U/mL). Within each set of plates, data were analyzed by averaging percent activity at each compound concentration across the 3 plates, and determining a single IC50 value for each compound by non-linear regression of the averaged percent activities.
Histone Methyltransferase Selectivity Panel
Suramin (6) was tested in dose response against EZH2, SETD7, and PRMT1. The enzyme and substrate concentrations were as follows: (1) 30 nM EZH2, 1 μM SAM, and 0.5 μM histone H3.3; (2) 20 nM SETD7, 1 μM SAM, and 0.5 μM histone H3.3; and (3) 50 nM PRMT1, 1 μM SAM, and 0.5 μM histone H4. The assay was performed exactly as for NSD1, except that NaCl was not added to background wells; instead, background (100% inhibition) was determined by omitting histone methyltransferase enzyme. IC50 values were determined by non-linear regression of triplicate data points at each concentration of suramin.
Data Analysis
Luminescence signals were converted to percent activity (Eq. 1) or percent inhibition (Eq. 2) by normalizing to plate controls. It should be noted that test and control CPS are subtracted from background CPS (instead of vice versa) to give positive values for these differences. Background CPS > control CPS, because the assay monitors depletion of ATP.
 |
 |
Z′-factors (Eq. 3) were determined using a previously described equation.17
 |
where μ and σ represent the mean and standard deviation, respectively.
Dose response curves and IC50s were generated using GraphPad Prism (GraphPad Software, Inc., La Jolla, CA).
Results
Development of the 384-Well Format NSD1 Assay
This study aimed to establish a high-throughput assay to screen for inhibitors of the histone methyltransferase NSD1. To this end, we designed an assay that measures production of SAH after enzyme-catalyzed transfer of a methyl group from SAM to a histone substrate. SAH is quantified via enzyme-coupled depletion of ATP, monitored by luminescence using the Kinase-Glo kit (Fig. 3). Initial studies were performed with the catalytic domain of NSD1, custom expressed and purified from Escherichia coli by BPS Biosciences. We selected amino acids 1852–2082, because this sequence was shown to have methyltransferase activity identical to that of the full-length protein.8 Subsequently we obtained an NSD1 construct encompassing amino acids 1538–2696 (Reaction Biology), which spans most of the portion of the protein found in the NUP98-NSD1 fusion.
Fig. 3.
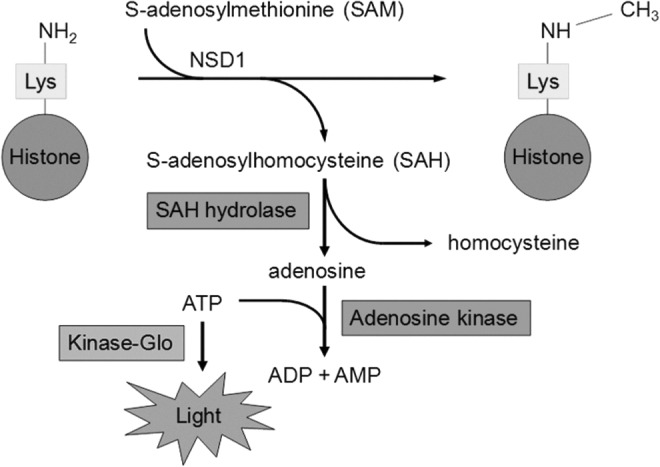
Luminescent assay for NSD1 and other histone methyltransferases. Enzyme-catalyzed transfer of a methyl group from SAM to a lysine amino group in a histone substrate results in the formation of SAH. SAH is quantified by 3 coupled steps. SAH is cleaved to adenosine by the enzyme SAHH; adenosine is converted to AMP by the enzyme adenosine kinase in the presence of ATP; and finally, the depletion of ATP during adenosine conversion is monitored by the Kinase-Glo ATP detection kit, in which light output proportional to the amount of ATP is generated by the ATP-dependent enzyme luciferase. As NSD1 generates SAH over time, ATP is depleted and light output is reduced. Inhibition of NSD1 blocks production of SAH, maintaining ATP and light output at a high level. AMP, adenosine monophosphate; ATP, adenosine triphosphate.
The Kinase-Glo kit showed a highly sensitive linear response to ATP in the 10–100 nM range, as required for the NSD1 assay. The response to SAH in the presence of the coupling enzymes SAHH and AK correlated with depletion of an equal amount of ATP (data not shown). The rate of NSD1-catalyzed generation of SAH increased with increasing pH (Fig. 4A). A pH of 8.2 was selected as being reasonably close to physiological pH, while providing sufficient NSD1 activity to generate readily detectable quantities of SAH within a 3-h timecourse. Figure 4B shows that the assay enabled sensitive detection of the initial linear rate of the enzymatic reaction at a range of concentrations of NSD1. Based on the profile of initial rate vs. enzyme concentration (Fig. 4C), 50 nM NSD1 was chosen for subsequent assay development. Titration of the coupling enzymes SAHH and AK ensured that the amounts used are sufficient to convert all the SAH produced by NSD1; in other words, the enzyme-coupled conversion of SAH is not rate limiting, and the assay provides a true measure of the rate of NSD1-catalyzed SAH generation. Based on the titration shown in Figure 5, 250 nM SAHH was selected as optimal. This enzyme is relatively expensive; our cost estimate for 100×384-well plates is $7,500 for SAHH alone. Therefore, we decided against the additional cost of a further increase in concentration above 250 nM given the minimal increase in the rate of luminescent signal generation. In the case of AK, the cost is much less ($350 for 100 plates), so we were able to select a substantial excess of 0.25 mU/mL based on an enzyme titration (data not shown). Using histone octamer as the methyl-acceptor substrate, NSD1 was found to be devoid of activity in the absence of added double-stranded DNA. Figure 6 shows that optimal activity required a DNA concentration equal to the histone octamer concentration. Interestingly, NSD1 activity dropped as the DNA:octamer ratio was increased above 1:1, and fell back to zero at ∼5:1 DNA:octamer. Figure 6 presents the effect of varying DNA concentration at one fixed concentration of octamer; similar experiments at differing octamer concentrations (not shown) confirmed that it is the DNA:octamer ratio which is important and not the absolute concentration of DNA.
Fig. 4.

NSD1 enzyme titration and timecourse. (A) Initial linear portion of timecourse of NSD1-catalyzed SAH production at various buffer pH values, determined in the presence of 200 nM ATP, 500 nM octamer, 500 nM DNA, 5 μM SAM, 100 nM SAHH, and 0.5 mU/mL AK in assay buffer comprising 50 mM HEPES, 5 mM MgCl2, and 1 mM DTT, 0.01% Tween-20. After the time indicated, Kinase-Glo and NaCl (400 mM) was added, and luminescence was read after 15 min. Signal is plotted against time. Values represent mean±SD (n=3). (B) Initial linear portion of timecourse of NSD1-catalyzed SAH production at a range of NSD1 concentrations (0–150 nM) with 300 nM octamer and DNA, and 400 nM SAM, at pH 8.2 using the buffer composition described under (A). Values represent mean±SD (n=3). (C) Profile of initial rate of NSD1 catalysis as a function of NSD1 concentration. The data from (C) are replotted as the initial rate (delta CPS/min) after subtracting background values (no NSD1). Values represent mean±SD (n=3). DTT, dithiothreitol; CPS, counts per second.
Fig. 5.
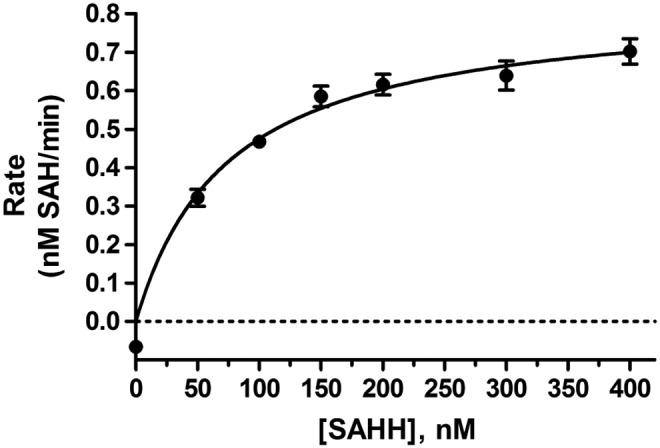
Titration of the coupling enzyme SAHH. NSD1-catalyzed production of SAH after 120 min plotted against a range of SAHH concentrations at fixed AK (0.25 mU/mL).
Fig. 6.
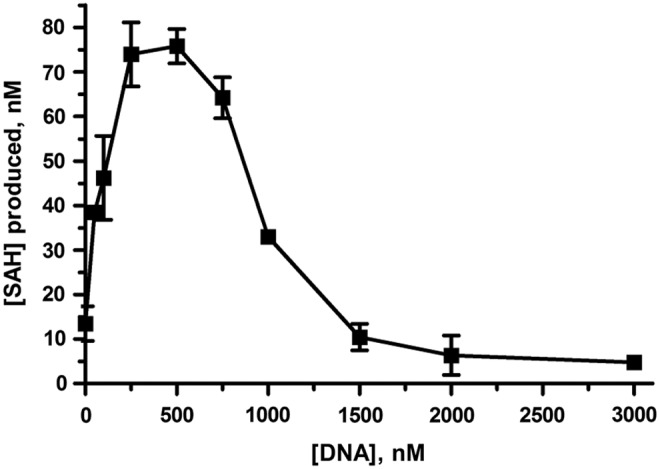
Optimization of DNA:histone octamer ratio. Data represent SAH production after 90 min catalyzed by 50 nM NSD1 in the presence of 5 μM SAM, 500 nM histone octamer, and a range of DNA concentrations as shown. Equimolar concentrations of DNA and octamer showed optimal activity. ATP depletion (equal to SAH production) was calculated from luminescence counts using an ATP standard curve after subtraction of background (no octamer). Data represent mean±SD, n=2.
Dependence of the rate of SAH generation on concentration of SAM and histone octamer was measured to determine Km values for each substrate. Figure 7 shows Km determinations of each substrate at a fixed non-saturating concentration of the other substrate. The Km of SAM was 270 nM in the presence of 500 nM each of histone octamer and DNA, and the Km of histone octamer was 1,060 nM in the presence of 400 nM SAM. To avoid confounding effects of the DNA:octamer ratio, equimolar DNA was added at each histone octamer concentration. Essentially identical Km values were obtained in separate experiments using a saturating concentration of the fixed substrate (not shown). Based on these results, the concentrations of SAM and histone octamer were fixed at 400 and 300 nM, respectively, for subsequent assay development and inhibitor screening. The SAM concentration slightly above its Km gives reasonable NSD1 activity while ensuring adequate sensitivity toward competitive, noncompetitive, or uncompetitive inhibition. The histone octamer concentration 3.5-fold below its Km conserves this expensive reagent and provides sensitivity to competitive and noncompetitive inhibition, although somewhat diminished sensitivity toward uncompetitive inhibition (in which an inhibitor preferentially binds to the enzyme-octamer complex rather than the free enzyme). Titration of DMSO demonstrated that NSD1 was unaffected by approximately 2% DMSO, and retained 90% activity at 5% DMSO (data not shown). Therefore, test compounds in 50–100 nL of DMSO may be added to a 10-μL assay without an effect on NSD1 activity due to DMSO.
Fig. 7.
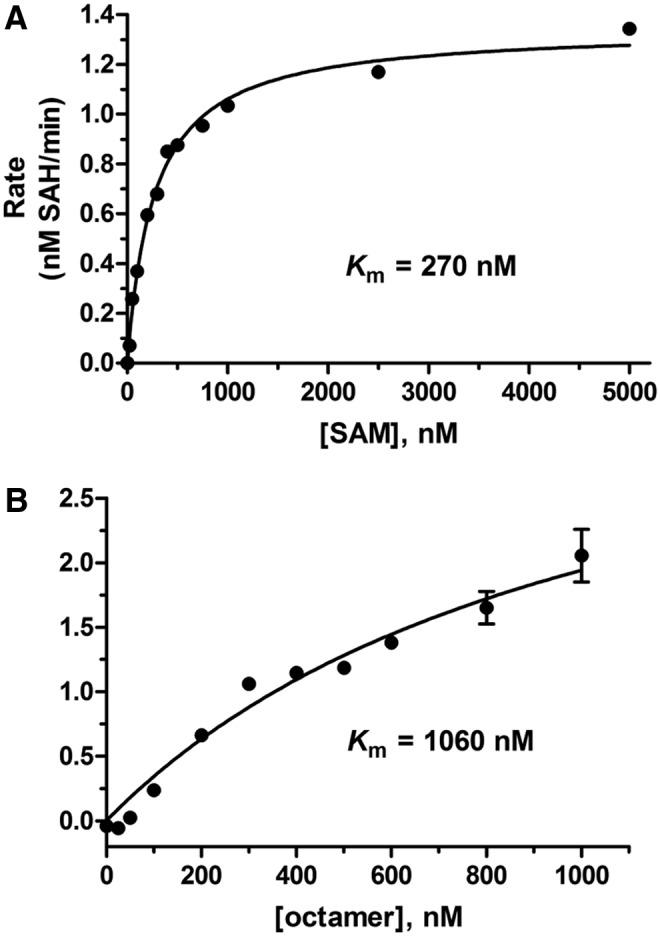
NSD1 Substrate Km determinations. In both graphs, initial linear rate (nM SAH produced per min) is plotted against concentration of the varied substrate. (A) SAM Km=270 nM (in the presence of 500 nM Octamer and 500 nM DNA). (B) Histone octamer Km=1,060 nM (in the presence of 400 nM SAM, and DNA equimolar to each concentration of octamer tested). Test concentrations of histone octamer above 1,000 nM were not attainable due to high salt concentration in the stock solution, which caused inhibition of NSD1. All test wells contained 50 nM NSD1, 200 nM ATP, 250 nM SAHH, and 0.25 mU/mL AK. Initial linear rates of SAH production were calculated based on ATP depletion calculated from a standard curve after subtraction of background (no NSD1). Data represent mean±SD, n=3.
Inhibition by Sodium Chloride and Sinefungin
Figure 8 shows results of testing sodium chloride and the known methyltransferase inhibitor sinefungin (structure shown in Fig. 2) in dose response to select a stop reagent before Kinase Glo addition, and also a positive control inhibitor to track consistency of the assay response. We found that NSD1 is completely inhibited by 200 mM NaCl, possibly due to disruption of the interaction between NSD1, histone, and DNA. Quantification of an ATP standard with Kinase-Glo revealed that addition of 200 mM NaCl increased luminescence counts by ∼50%, whereas no further change in signal was observed on increasing the NaCl concentration to 300 mM (data not shown). Nevertheless, linearity of ATP detection and signal stability over time were not affected in the presence of NaCl, and the minimal effect of NaCl on the coupling enzyme counterscreen shown in Figure 8 confirmed that the observed effect on NSD1 is not an assay artifact. Therefore, NaCl was added along with Kinase-Glo to stop NSD1 methyltransferase activity before luminescence measurement, and it was also added to background wells in compound test plates to define 100% inhibition of NSD1.
Fig. 8.
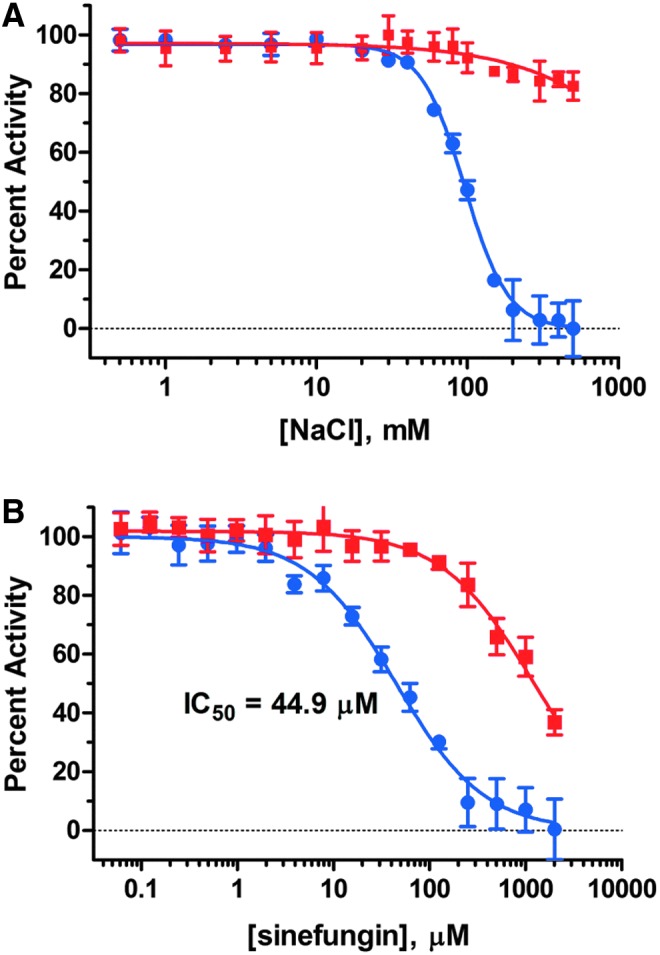
Inhibition by NaCl and sinefungin. Inhibition by NaCl (A) and sinefungin (B) was determined against NSD1 (blue) and the coupling enzymes (red). In both assays, inhibitors were incubated for 120 min with 50 nM NSD1, 400 nM SAM, 300 nM DNA, and ATP and coupling enzymes. In addition, the NSD1 assay contained 300 nM octamer, and the coupling enzyme counterscreen contained 100 nM SAH. Data represent the mean±SD, n=3 replicates.
Sinefungin proved to be a relatively weak inhibitor of NSD1, but it is highly soluble in aqueous buffer, enabling a full dose-response curve to be obtained and an IC50 of 44.9 μM to be determined. This value is in close agreement with a reported IC50 of 110 μM obtained using nucleosomes as an acceptor substrate and 3H-labeled SAM as a methyl donor.18 Sinefungin is a SAM-competitive inhibitor, so its IC50 in the previously reported assay is expected to be higher than ours because the concentration of SAM was 2.5-fold higher than we used. Sinefungin has also been reported as an inhibitor of SAHH,19 so it was not unexpected that we also observed weak inhibition of enzyme-coupled SAH detection with an IC50 of ∼1 mM. Visual inspection of the structures in Figure 2 reveals that sinefungin closely resembles both SAM and SAH, accounting for its competitive inhibition of histone methyltransferases and SAHH. Based on its reliable inhibition profile, sinefungin was subsequently used as a positive control inhibitor during pilot HTS.
Pilot Screen of the MicroSource Spectrum Collection
To validate that the NSD1 assay was suitable for HTS, a pilot screen was undertaken using an assay protocol adapted for automated liquid handling (Table 1). A portion of the MicroSource Spectrum library comprising 1,716 drugs and natural products was screened for inhibitors of NSD1 at 20 μM. To evaluate the intra-plate reproducibility of the assay response to inhibition within the screening run, QC plates were placed at the beginning and end of the test plate sequence. Each QC plate contained sinefungin delivered by pintool to give a final concentration of 50 μM in all 320 test wells. Overall, the assay performed well over the 6-plate screen, as shown in Figure 9. A column graph of raw CPS values (Fig. 9A) reveals that approximately half of the available ATP was depleted over the 2-h timecourse. All but one of the test plates gave total control percent coefficient of variation (CV) <7% (1 plate gave total control CV=12%), resulting in a median Z′-factor of 0.6 (Fig. 9B). Data representing examples of a test plate and a QC plate are shown as scatter plots in Figure 10.
Fig. 9.
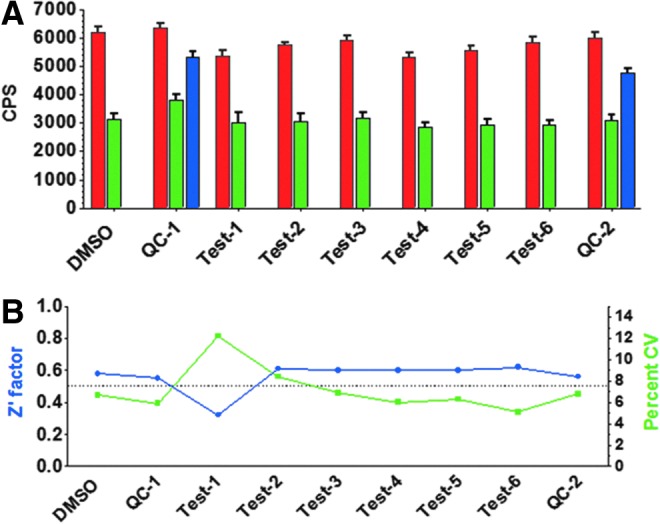
Plate control statistics for pilot screen. (A) Controls (mean±SD). Red=background controls (200 mM NaCl, n=32); Green=total controls (DMSO, n=32); Blue=Mid controls (50 μM sinefungin, n=320). (B) Assay performance statistics. Z′ factor (blue) and percent CV for total controls (green). CV, coefficient of variation.
Fig. 10.
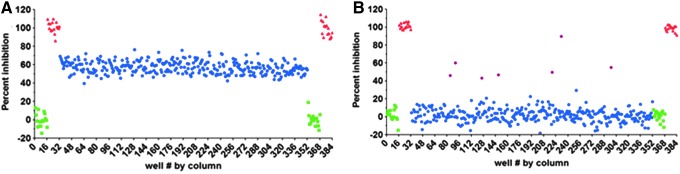
Representative Screening Plates. (A) Quality control plate containing 50 μM sinefungin as a mid-control in place of test compounds. Blue=50 μM sinefungin. (B) Screening plate showing 7 hits (violet) with >36% inhibition. A hit cutoff of 36% inhibition was selected because this was 3-fold higher than the maximum plate control CV (Fig. 8B). Blue=test compounds (20 μM). In both graphs: green=total controls (DMSO only, no test compound), red=background (200 mM NaCl added to stop NSD1 activity).
Based on the maximum total control CV of 12%, the threshold for hit selection was set at 36% inhibition. Within each test plate, inhibition values >36% were considered statistically significant, as they differed from the mean total control by >3 standard deviations. Sixty-three compounds met this threshold, representing a primary hit rate of 3.7%. These primary actives were retested for NSD1 inhibition in dose response using 2-fold serial dilutions from 40 μM down to 1.2 nM, and also tested in a parallel counterscreen in which NSD1 and histone octamer were omitted and SAH was added. Compounds active against both the NSD1 screen and the counterscreen were considered artifacts that interfered with enzyme-coupled SAH detection. Each plate included a titration of sinefungin so that its IC50 could be used for inter-plate QC. Inhibition of NSD1 by sinefungin was very consistent over the 8 plates tested: mean IC50=62.0 μM, ranging from 50.7 to 72.3 μM. We calculated a minimum significant ratio (MSR) of 1.46, indicating a highly stable assay according to the definition given by Eastwood et al.20 (One is the best possible ratio. An MSR <4 suggests an assay with high test-to-test dose-response reproducibility.) Fifty-seven compounds gave an IC50<40 μM against NSD1, representing a 90% confirmation rate from the primary single point HTS. Of these compounds, 12 showed >10-fold more potency against NSD1 than in the counterscreen (counterscreen IC50 >10×NSD1 IC50), yielding a confirmed hit rate of 0.7%. Mean compound IC50 values are listed in Table 2, and structures are shown in Figure 2. IC50 curves for the 6 most potent hits are shown in Figure 11.
Table 2.
Confirmed NSD1 Inhibitors from Pilot High-Throughput Screening
| IC50 (μM)c | ||||
|---|---|---|---|---|
| Compound No.a | MicroSource IDb | NSD1 | Counterscreen | Selectivityd |
| 1 | 01505308 | 0.317±0.03 | >40 | >126 |
| 2 | 01505751 | 0.340±0.138 | >40 | >118 |
| 3 | 01505824 | 1.37±0.42 | 33.4±5.7 | 24.3 |
| 4 | 01500500 | 1.80±0.17 | 20.8±5.5 | 11.5 |
| 5 | 01504240 | 2.02±0.20 | 22.7±2.1 | 11.3 |
| 6 | 01502032 | 2.40±0.12 | >40 | >16.7 |
| 7 | 01500521 | 2.55±0.05 | >40 | >15.7 |
| 8 | 01505825 | 3.11±0.09 | 39.0±15.4 | 12.5 |
| 9 | 01505812 | 3.47±0.13 | 35.8±11.5 | 10.3 |
| 10 | 01505883 | 4.92±0.14 | >40 | 12.7 |
| 11 | 01505129 | 5.70±0.29 | >40 | 22.6 |
| 12 | 01505584 | 5.91±0.36 | >40 | >16.5 |
aSee Figure 2.
bCompound ID used by MicroSource Discovery, supplier of the Spectrum library.
cIC50 values reported as mean±SD determined as described under Materials and Methods.
dSelectivity defined as ratio of IC50 values between counterscreen and NSD1 screen.
Fig. 11.

Dose-response data and IC50 curve fits for the 6 most potent NSD1 hits. NSD1 inhibition is shown in blue, and counterscreen data are indicated in red. Each graph shows individual data points from 3 separate plates and the corresponding curve fits giving each of 3 replicate IC50 determinations.
Exclusion of DTT-Reactive “Nuisance Compounds” Among Confirmed Hits
Cysteine-containing enzymes are prone to oxidative inactivation by certain classes of compounds that undergo redox cycling in the presence of DTT.21–23 Three observations suggested that many of the confirmed hits in Table 2 were DTT-reactive “nuisance compounds”: DTT was present in the pilot HTS assay buffer, several of the structures in Figure 2 include functionality previously found to be problematic, and NSD1 contains a cysteine-rich AWS site that accommodates DNA binding essential for activity. It has been previously shown 21–23 that substitution of DTT with less potent reducing agents such as cysteine or BME prevents oxidative enzyme inactivation. Therefore, we tested NSD1 activity in the presence of cysteine or BME in place of DTT. No activity was observed with cysteine, but a 1-h pre-incubation of NSD1 with BME gave essentially identical activity to that observed in the presence of DTT (data not shown).
Determination of IC50 values for compounds 1–12 against NSD1 pre-incubated and assayed in the presence of DTT or BME confirmed that 7 out of 12 compounds were NSD1 inactivators in the presence of DTT, as evidenced by a significant increase in IC50 on replacement of DTT by BME (Table 3). This finding was corroborated by investigating the effect of added catalase to DTT-containing assay buffer. All 7 compounds that were less active in the presence of BME than DTT showed similar loss of activity when catalase was added with DTT. This is consistent with the role of catalase as a peroxide scavenger that protects cysteine-containing enzymes from oxidative inactivation.21 A further 2 compounds, 8 and 9, showed some loss of activity when DTT was replaced with BME or supplemented with catalase, but not to a conclusive degree. Nevertheless, it is likely that these 2 compounds are oxidative inactivators of NSD1, because they have previously been reported to undergo redox cycling in the presence of DTT.24 No evidence for redox cycling was observed for compounds 1 and 2. However, these compounds showed discrepant data, not only between DTT, BME, and DTT+catalase results in Table 3, but also between IC50 values in the presence of DTT in Tables 2 and 3. Reliable IC50 determinations were not possible due to significant deviations from typical sigmoidal dose-response profiles, as shown in Figure 11. The large apparent increase in percent activity at high compound concentrations results from a sharp decrease in luminescence signal, most likely due to quenching by compounds 1 and 2, both of which are highly colored. Slight differences in IC50s of other compounds between Tables 2 and 3 are not unexpected given that the methods of determination were not the same (see Materials and Methods section). Only compound 6, suramin, gave consistent IC50 values throughout, unaffected by replacement of DTT with BME or addition of catalase.
Table 3.
Identification of DTT-Reactive Compounds Among NSD1 Hits
| IC50 (μM)c | IC50 ratio | |||||||||
|---|---|---|---|---|---|---|---|---|---|---|
| Compound No.a | PubChemCIDb | DTT | BME | DTT+Catalase | BME/DTT | (DTT+Catalase)/DTT | Redox Cyclingd | PubChem Activity Profilee | Promiscuity Indexf | Notes |
| 1 | 16717692 | 0.175 | 0.047 | 0.121 | 0.3 | 0.7 | No | 30/94 | 0.32 | g |
| 2 | 27872 | 1.37 | 3.12 | 0.084 | 2.3 | 0.1 | No | 22/91 | 0.24 | g |
| 3 | 164676 | 5.35 | 22.2 | 15.4 | 4.1 | 2.9 | Yes | 112/854 | 0.13 | |
| 4 | 6135 | 1.17 | 39.9 | 41.6 | 34.0 | 35.5 | Yes | 13/241 | 0.05 | |
| 5 | 8530 | 5.21 | >40 | 18.6 | >7.7 | 3.6 | Yes | 24/98 | 0.24 | |
| 6 | 8514 | 2.88 | 3.16 | 2.34 | 1.1 | 0.8 | No | 41/197 | 0.21 | |
| 7 | 54736625 | 3.05 | 30.9 | >40 | 10.1 | >13.1 | Yes | 95/377 | 0.25 | |
| 8 | 114917 | 7.87 | 19.2 | 14 | 2.4 | 1.8 | Inconclusive | 69/544 | 0.13 | |
| 9 | 160254 | 8.28 | 20.3 | 13.4 | 2.5 | 1.6 | Inconclusive | 83/667 | 0.12 | |
| 10 | 6852403 | 11.3 | >40 | >40 | >3.5 | >3.5 | Yes | 36/650 | 0.06 | |
| 11 | 10205 | 5.98 | >40 | 23.3 | >6.7 | 3.9 | Yes | 75/268 | 0.28 | |
| 12 | 45114171 | 9.94 | >40 | 52.8 | >4.0 | 5.3 | Yes | N/A | N/A | h |
aSee Figure 2.
bPubChem compound ID that may be used to access test data deposited at pubchem.ncbi.nlm.nih.gov/
cData are single IC50 values determined from triplicate data at each concentration as described under Materials and Methods.
dCompounds were flagged as redox cycling NSD1 inactivators if IC50 in the presence of BME was >3×IC50 in presence of DTT. In each case the BME/DTT IC50 difference was corroborated by a similar increase in IC50 on addition of catalase to DTT-containing buffer. Compounds with >2-fold increase between DTT and BME IC50s and corroborating DTT+catalase data were flagged as inconclusive. Compounds with no increase in IC50 between DTT and BME or discrepant DTT+catalase data were judged not to be redox cycling NSD1 inactivators.
eNumber of PubChem bioassays in which compound is flagged as active/total number of PubChem bioassays in which compound has been tested.
fPubChem activity profile expressed as a decimal.
gDiscrepant data (IC50 values varying between DTT, BME, and DTT+catalase without a clear trend) are most likely due to the poorly defined curve fit. Marked deviation from a typical sigmoidal dose-response profile is apparent in Figure 11.
hN/A indicates that no activity data have been reported in PubChem.
BME, β-mercaptoethanol.
Evaluation of NSD1 Inhibitor Selectivity
Structure searching in PubChem revealed that screening data have been deposited for 11 out of the 12 confirmed NSD1 hits. These results are summarized in Table 3. The PubChem activity profile indicates the frequency with which these compounds have been found to be active against other targets. The promiscuity index as defined by Schurer et al.25 ranks cross-screen activity on a scale from 0 to 1; the lower the value, the greater the selectivity of the compound for a small number of targets. Ten out of 12 of the compounds in Table 3 have a promiscuity index >0.1, indicating that they were active in >10% of the screens in which they have been tested, suggesting that they should be excluded from further studies due to lack of selectivity.
Although compound 6, suramin, is fairly promiscuous, we decided to use it as a model NSD1 inhibitor to validate a panel of histone methyltransferases to assess selectivity among this class of enzymes. With NSD1, suramin consistently gave well-defined dose-response curves and reasonably potent IC50 values in the 2–3 μM range. Assays for histone lysine methyltransferases SETD7 and EZH2 and arginine methyltransferase PRMT1 were developed based on SAH quantification using the enzyme-coupled ATP detection validated for NSD1 (see Table 1 for protocol). In each case, an enzyme concentration was selected to give a rate of substrate turnover similar to that observed in the NSD1 assay. This enabled all assays to be run for 120 min, and ensured that over this time histone methyltransferase-catalyzed SAH production rather than enzyme-coupled SAH detection was rate limiting. The key differences between each assay were the nature of the methyl acceptor substrate, and the Km values for this and the methyl donor SAM (Table 4). The assays were validated by testing sinefungin in dose response against each enzyme with its substrates close to their respective Km values. Sinefungin IC50s (Table 4) were found to be consistent with previously reported values.18,26–28 In the case of EZH2 and PRMT1, the correspondence was not exact, possibly due to differences in substrate concentrations, but the rank-order potency between the 4 enzymes tested was the same. Following assay validation using sinefungin, suramin was tested in dose response to give IC50s shown in Table 4. The IC50 values for EZH2, SETD7, and PRMT1 were in close agreement with those recently reported (NSD1 testing was not reported).27 Based on the 95% confidence intervals of our data, the differences between the IC50 against NSD1 and those against SETD7 and EZH2 appear to be statistically significant. However, neither of the differences meets the criterion of a 5-fold difference in IC50 between enzymes that we have established as a minimal starting point for optimization of a hit as a selective enzyme inhibitor. Nevertheless, the testing of suramin in a panel of several enzymes was useful as a demonstration that our luminescent enzyme-coupled assay may be used for selectivity profiling of histone methyltransferase inhibitors.
Table 4.
Substrate Km Values and Inhibitor IC50s for a Panel of Histone Methyltransferases
| Km (μM) | ||||||||
|---|---|---|---|---|---|---|---|---|
| Enzyme | Acceptor Substrate | Acceptor | SAM | Sinefungin IC50 (μM)a | Literature Values | Suramin IC50 (μM)a | 95% CI (μM)b | Literature Values27 |
| NSD1 | Histone octamer | 1.06 | 0.27 | 44.9 | 110c | 2.88 | 2.33–3.55 | ND |
| EZH2 | Histone H3 | 0.29 | 0.26 | 87.0 | 420d | 10.7 | 6.53–17.6 | 11.5 |
| SETD7 | Histone H3 | 0.70 | 0.22 | 11.3 | 9.1e | 1.37 | 1.02–1.83 | 4.94 |
| PRMT1 | Histone H4 | 0.23 | 0.47 | 1.67 | 0.24f | 4.84 | 1.24–18.8 | 7.5 |
aResults are single IC50 values determined from triplicate data at each concentration as described under Materials and Methods.
bError limits represent 95% confidence interval of suramin IC50 values in the preceding column.
cRef 18.
dRef 26.
eRef 27.
fRef 28.
Discussion
In designing an HTS-compatible assay to discover inhibitors of the histone methyltransferase NSD1, we had to consider some notable features of the behavior of this enzyme in biochemical assays. NSD1 does not methylate peptide or histone substrates; instead, it requires double-stranded DNA-bound histone octamer or nucleosome substrates for activity, and even with these substrates it exhibits a very low rate of substrate turnover.7,8 Therefore, very high assay sensitivity and a configuration that enables flexibility to use structurally complex substrates are necessary. To meet these needs, we sought to design an enzyme-coupled assay linking SAH production to depletion of ATP, which may be monitored by well-validated, highly sensitive luciferase-based methods. The method we developed, shown in Figure 3, provides the desired capability to detect enzymatic turnover of 10–100 nM of substrate. Moreover, the assay format is adaptable for screening any methyltransferase that catalyzes methyl group transfer from SAM, with concomitant generation of the product SAH. The assay is amenable to high-throughput automated HTS. All of the assay components except the Kinase-Glo ATP detection reagent are mixed at the start, requiring just 1 addition step after HTS has commenced. We are particularly interested in evaluating NSD1 inhibitors as therapeutic agents to block pediatric AML driven by NUP98-NSD1 fusion proteins.1,6 To this end, after we had initially validated the assay using the catalytic domain of NSD1, we obtained a construct that encompasses the entire portion of NSD1 present in NUP98-NSD1 fusions. Use of the longer construct for HTS will enable the possibility of inhibition of the catalytic activity of NSD1 through compound binding to a site outside the catalytic domain.
An issue to be considered in adopting the homogeneous assay format shown in Figure 3 is that the enzymes in the coupled SAH detection steps are exposed to interference from test compounds. The susceptibility of the NSD1 assay to artifacts interfering with product detection was evident from the high primary hit rate of 3.7% obtained in the pilot screen. However, with a simple counterscreen to detect SAH in the absence of NSD1, we were able to eliminate 79% (45 out of 57) of the pilot HTS hits as artifacts. Given the high cost of SAHH, we limited it to a concentration just sufficient to turn over SAH as soon as it is produced by NSD1. This limitation renders SAHH-coupled detection of SAH susceptible to compound inhibition, as observed in the case of sinefungin (Fig. 8), a known SAHH inhibitor.19 Use of a much larger excess of SAHH would most likely reduce the incidence of compounds interfering with the coupling steps. Nevertheless, we show here that it is possible to rely on the proven simplicity and effectiveness of the counterscreen to eliminate false positives that inhibit SAHH or AK.
Counterscreening identified 12 hits that were not assay-related artifacts, and therefore inhibited NSD1 activity. Nevertheless, most of these “confirmed” NSD1 hits listed in Table 2 were found to be non-specific “nuisance compounds,” also known as PAINS,29 rather than bona fide selective enzyme inhibitors. The confirmed hit rate of 0.7% was somewhat high for a biochemical enzyme assay (0.1% is typical), suggesting that the majority of the hits were inactivating NSD1 through non-specific mechanisms. Inspection of the structures in Figure 2 reveals that many of the confirmed hits comprise structural features known to generate hydrogen peroxide in the presence of DTT, thereby irreversibly inactivating cysteine-containing enzymes.21–23 The pilot HTS assay buffer contained DTT, and NSD1 possesses a cysteine-rich region adjacent to the catalytic site that activates the enzyme on binding to DNA.8 Therefore, it seemed likely that many of the hits were artifacts which interacted with the assay buffer to inactivate NSD1. This was confirmed by the loss of compound activity when DTT in the assay buffer was replaced with BME. Nine out of 12 hits appeared to be redox cycling artifacts. Of the remaining 3 hits, compounds 1 and 2 were highly colored and appeared to quench the luminescent assay signal at micromolar concentrations, making reliable dose-response analysis difficult (Fig. 11). Moreover, these compounds have been highly promiscuous in other HTS assays reported in PubChem (Table 3); therefore, it is unlikely they are specific inhibitors of NSD1.
The only compound from pilot HTS that is likely to inhibit NSD1 through active-site-directed reversible inhibition is suramin (compound 6), which differed notably from the other hits in that it gave consistent dose-response profiles against NSD1, showed no activity in the counterscreen, and gave no indication of redox cycling activity. Moreover, although suramin appears promiscuous based on its activity profile in PubChem (Table 3), many of its targets are methyltransferases, deacetylases, and related enzymes. A recent publication profiled the activity of suramin against a panel of histone methyltransferases using an assay that monitored methyl group transfer from radiolabeled SAM.27 Although suramin was not tested against NSD1, activity was reported against 3 enzymes that we had selected for our own histone methyltransferase panel, enabling us to compare our profiling data against results from an established radiochemical assay, often considered the “gold standard” for such studies. Our IC50 values, shown in Table 4, agreed closely with those previously reported, validating our luminescent assay as a reliable alternative to the use of radiolabeled SAM. Suramin is unlikely to be useful in the context of NUP98-NSD1 pediatric AML, as we observed minimal selectivity for NSD1 over other histone methyltransferases. For hits to be useful as chemical probes to explore the biology of NUP98-NSD1-driven leukemia and to be advanced as potential targeted therapeutic leads, it is important that they selectively inhibit NSD1. Nevertheless, progressing suramin through pilot HTS, counterscreening, testing for redox cycling, and selectivity profiling enabled us to validate the primary HTS assay and subsequent hit confirmation and characterization. We look forward to reporting on full HTS using the luminescent NSD1 assay described here, which promises to deliver selective NSD1 inhibitors that may serve as leads in the development of targeted therapies for NUP98-NSD1-driven leukemias.
Abbreviations Used
- AK
adenosine kinase
- AML
acute myeloid leukemia
- AMP
adenosine monophosphate
- ATP
adenosine triphosphate
- BME
β-mercaptoethanol
- CPS
counts per second
- CV
coefficient of variation
- DTT
dithiothreitol
- HOX
homeobox
- HTS
high-throughput screening
- QC
quality control
- SAH
S-adenosylhomocysteine
- SAHH
S-adenosylhomocysteine hydrolase
- SAM
S-adenosylmethionine
Acknowledgments
The authors would like to acknowledge support from Hyundai Hope on Wheels, the Leukemia Research Foundation of Delaware, and the Nemours Foundation to A.D.N., and the B+ Foundation for providing the funds to purchase the assay development and screening instrumentation used in this study. V.G.W. was supported by a UNCF-Merck Postdoctoral Fellowship, and R.G. was supported by the Nemours Summer Scholar Program.
Disclosure Statement
No competing financial interests exist.
References
- 1.Napper AD, Watson VG: Targeted drug discovery for pediatric leukemia. Front Oncol 2013;3:170. [DOI] [PMC free article] [PubMed] [Google Scholar]
- 2.Jaju RJ, Fidler C, Haas OA, et al. : A novel gene, NSD1, is fused to NUP98 in the t(5;11)(q35;p15.5) in de novo childhood acute myeloid leukemia. Blood 2001;98:1264–1267 [DOI] [PubMed] [Google Scholar]
- 3.Hollink IH, van den Heuvel-Eibrink MM, Arentsen-Peters ST, et al. : NUP98/NSD1 characterizes a novel poor prognostic group in acute myeloid leukemia with a distinct HOX gene expression pattern. Blood 2011;118:3645–3656 [DOI] [PubMed] [Google Scholar]
- 4.Morishita M, di Luccio E: Cancers and the NSD family of histone lysine methyltransferases. Biochim Biophys Acta 2011;1816:158–163 [DOI] [PubMed] [Google Scholar]
- 5.Wagner EJ, Carpenter PB: Understanding the language of Lys36 methylation at histone H3. Nat Rev Mol Cell Biol 2012;13:115–126 [DOI] [PMC free article] [PubMed] [Google Scholar]
- 6.Wang GG, Cai L, Pasillas MP, Kamps MP: NUP98-NSD1 links H3K36 methylation to Hox-A gene activation and leukaemogenesis. Nat Cell Biol 2007;9:804–812 [DOI] [PubMed] [Google Scholar]
- 7.Li Y, Trojer P, Xu CF, et al. : The target of the NSD family of histone lysine methyltransferases depends on the nature of the substrate. J Biol Chem 2009;284:34283–34295 [DOI] [PMC free article] [PubMed] [Google Scholar]
- 8.Qiao Q, Li Y, Chen Z, et al. : The structure of NSD1 reveals an autoregulatory mechanism underlying histone H3K36 methylation. J Biol Chem 2010;286:8361–8368 [DOI] [PMC free article] [PubMed] [Google Scholar]
- 9.Graves TL, Zhang Y, Scott JE: A universal competitive fluorescence polarization activity assay for S-adenosylmethionine utilizing methyltransferases. Anal Biochem 2008;373:296–306 [DOI] [PMC free article] [PubMed] [Google Scholar]
- 10.Klink TA, Staeben M, Twesten K, et al. : Development and validation of a generic fluorescent methyltransferase activity assay based on the transcreener AMP/GMP assay. J Biomol Screen 2012;17:59–70 [DOI] [PMC free article] [PubMed] [Google Scholar]
- 11.Collazo E, Couture JF, Bulfer S, Trievel RC: A coupled fluorescent assay for histone methyltransferases. Anal Biochem 2005;342:86–92 [DOI] [PubMed] [Google Scholar]
- 12.Wang R, Ibanez G, Islam K, et al. : Formulating a fluorogenic assay to evaluate S-adenosyl-L-methionine analogues as protein methyltransferase cofactors. Mol Biosyst 2011;7:2970–2981 [DOI] [PMC free article] [PubMed] [Google Scholar]
- 13.Dorgan KM, Wooderchak WL, Wynn DP, et al. : An enzyme-coupled continuous spectrophotometric assay for S-adenosylmethionine-dependent methyltransferases. Anal Biochem 2006;350:249–255 [DOI] [PubMed] [Google Scholar]
- 14.Hemeon I, Gutierrez JA, Ho MC, Schramm VL: Characterizing DNA methyltransferases with an ultrasensitive luciferase-linked continuous assay. Anal Chem 2011;83:4996–5004 [DOI] [PMC free article] [PubMed] [Google Scholar]
- 15.Ibanez G, McBean JL, Astudillo YM, Luo M: An enzyme-coupled ultrasensitive luminescence assay for protein methyltransferases. Anal Biochem 2010;401:203–210 [DOI] [PubMed] [Google Scholar]
- 16.Mascarenhas C, Edwards-Ingram LC, Zeef L, et al. : Gcn4 is required for the response to peroxide stress in the yeast Saccharomyces cerevisiae. Mol Biol Cell 2008;19:2995–3007 [DOI] [PMC free article] [PubMed] [Google Scholar]
- 17.Zhang JH, Chung TD, Oldenburg KR: A simple statistical parameter for use in evaluation and validation of high throughput screening assays. J Biomol Screen 1999;4:67–73 [DOI] [PubMed] [Google Scholar]
- 18.NSD1. Available at www.reactionbiology.com/webapps/site/KinasePDFs/NSD1.pdf (last accessed May8, 2014)
- 19.Fabianowska-Majewska K, Duley JA, Simmonds HA: Effects of novel anti-viral adenosine analogues on the activity of S-adenosylhomocysteine hydrolase from human liver. Biochem Pharmacol 1994;48:897–903 [DOI] [PubMed] [Google Scholar]
- 20.Eastwood BJ, Farmen MW, Iversen PW, et al. : The minimum significant ratio: a statistical parameter to characterize the reproducibility of potency estimates from concentration-response assays and estimation by replicate-experiment studies. J Biomol Screen 2006;11:253–261 [DOI] [PubMed] [Google Scholar]
- 21.Johnston PA: Redox cycling compounds generate H2O2 in HTS buffers containing strong reducing reagents—real hits or promiscuous artifacts? Curr Opin Chem Biol 2011;15:174–182 [DOI] [PMC free article] [PubMed] [Google Scholar]
- 22.Motlekar N, Diamond SL, Napper AD: Evaluation of an orthogonal pooling strategy for rapid high-throughput screening of proteases. Assay Drug Dev Technol 2008;6:395–405 [DOI] [PMC free article] [PubMed] [Google Scholar]
- 23.Soares KM, Blackmon N, Shun TY, et al. : Profiling the NIH small molecule repository for compounds that generate H2O2 by redox cycling in reducing environments. Assay Drug Dev Technol 2010;8:152–174 [DOI] [PMC free article] [PubMed] [Google Scholar]
- 24.Soares J, Keppler BR, Wang X, Lee KH, Jarstfer MB: ortho-Quinone tanshinones directly inhibit telomerase through an oxidative mechanism mediated by hydrogen peroxide. Bioorg Med Chem Lett 2011;21:7474–7478 [DOI] [PMC free article] [PubMed] [Google Scholar]
- 25.Schurer SC, Vempati U, Smith R, Southern M, Lemmon V: BioAssay ontology annotations facilitate cross-analysis of diverse high-throughput screening data sets. J Biomol Screen 2011;16:415–426 [DOI] [PMC free article] [PubMed] [Google Scholar]
- 26.EZH2: Available at www.reactionbiology.com/webapps/site/KinasePDFs/EZH2%20Complex.pdf (last accessed May8, 2014)
- 27.Horiuchi KY, Eason MM, Ferry JJ, et al. : Assay development for histone methyltransferases. Assay Drug Dev Technol 2013;11:227–236 [DOI] [PMC free article] [PubMed] [Google Scholar]
- 28.PRMT1: Available at www.reactionbiology.com/webapps/site/KinasePDFs/PRMT1.pdf (last accessed May8, 2014)
- 29.Whitty A: Growing PAINS in academic drug discovery. Future Med Chem 2011;3:797–801 [DOI] [PMC free article] [PubMed] [Google Scholar]