Abstract
Hemorrhagic shock is a leading cause of trauma-related mortality in both civilian and military settings. Resuscitation often results in reperfusion injury and survivors are susceptible to developing multiple organ failure (MOF). The impact of fed state on the overall response to shock and resuscitation has been explored in some murine models but few clinically relevant large animal models. We have previously used metabolomics to establish that the fed state results in a different metabolic response in the porcine liver following hemorrhagic shock and resuscitation. In this study, we used our clinically relevant model of hemorrhagic shock and polytrauma and the Illumina HiSeq platform to determine if the liver transcriptomic response is also altered with respect to fed state. Functional analysis of the response to shock and resuscitation confirmed several typical responses including carbohydrate metabolism, cytokine inflammation, decreased cholesterol synthesis, and apoptosis. Our findings also suggest that the fasting state, relative to a carbohydrate prefed state, displays decreased carbohydrate metabolism, increased cytoskeleton reorganization and decreased inflammation in response to hemorrhagic shock and reperfusion. Evidence suggests that this is a consequence of a shrunken, catabolic state of the liver cells which provides an anti-inflammatory condition that partially mitigates hepatocellar damage.
Introduction
Hemorrhagic shock is a leading cause of trauma-related mortality in both civilian and military settings. Efforts over the years have significantly improved survival in the military sector [1]; however, hemorrhagic shock from traumatic injury results in multiple alterations in the metabolic state of an organism many of which are not fully elucidated. Civilian data estimates between 1400 and 14,000 preventable hemorrhagic trauma deaths occur per year in the United States [2]. Military data has consistently reported hemorrhagic shock as the leading cause of preventable deaths [3]–[5].
Hemorrhagic shock results in inadequate tissue perfusion leading to decreased oxygen availability to mitochondria. This condition causes a switch towards anaerobic metabolism in addition to a complex inflammatory response. The liver serves an important function as a regulator of metabolism during stressed states. Initially, the shift towards anaerobic metabolism stimulates the liver to increase glycogenolysis and process elevated lactate produced in the peripheral tissues. The liver also provides a major site of detoxification and production of alternate metabolic fuel sources including amino acids and lipids.
Previous research in our laboratory revealed increased acute lung injury and multiple organ failure with a trend toward increased mortality in pigs receiving a carbohydrate diet prior to hemorrhagic shock relative to fasted pigs [6]. Our previous metabolomics research has reported an altered response to fed state in the liver and urine as well as phase of care in serum following hemorrhagic shock and resuscitation [7]–[9]. The objective of this study was to determine if this differential response is related to varied genetic expression in the liver with the hypothesis that there would be quantifiable differences in liver mRNA expression reflecting an altered response to shock and resuscitation with respect to fed state. To test this hypothesis, we used our well-established model of hemorrhagic shock and polytrauma comparing the effect of providing a carbohydrate (CPF) versus a fasted (FS) diet prior to insult. Extraction of mRNA from liver biopsies and subsequent RNA-Sequencing was used to compare between CPF and FS animals at four timepoints: Baseline (B), and 2, 8 and 20 hours after resuscitation (FR2, FR8, and FR20). Secondly, livers samples were examined over the course of polytrauma, hemorrhagic shock and resuscitation within each group to determine how mRNA expression changed within each group.
Materials and Methods
Animals
Male Yorkshire-Landrace pigs (15–20 kg) were purchased from Manthei Hog Farm, LLC (Elk River, MN) and housed in Research Animal Resources (RAR) at the University of Minnesota. All studies were approved by the University of Minnesota Institutional Animal Care and Use Committee (IACUC). Pigs were fasted overnight prior to surgery, but were allowed water ad libitum. All surgeries were performed under anesthesia and all efforts were made to minimize suffering.
Animal Preparation and Hemorrhagic Shock Protocol
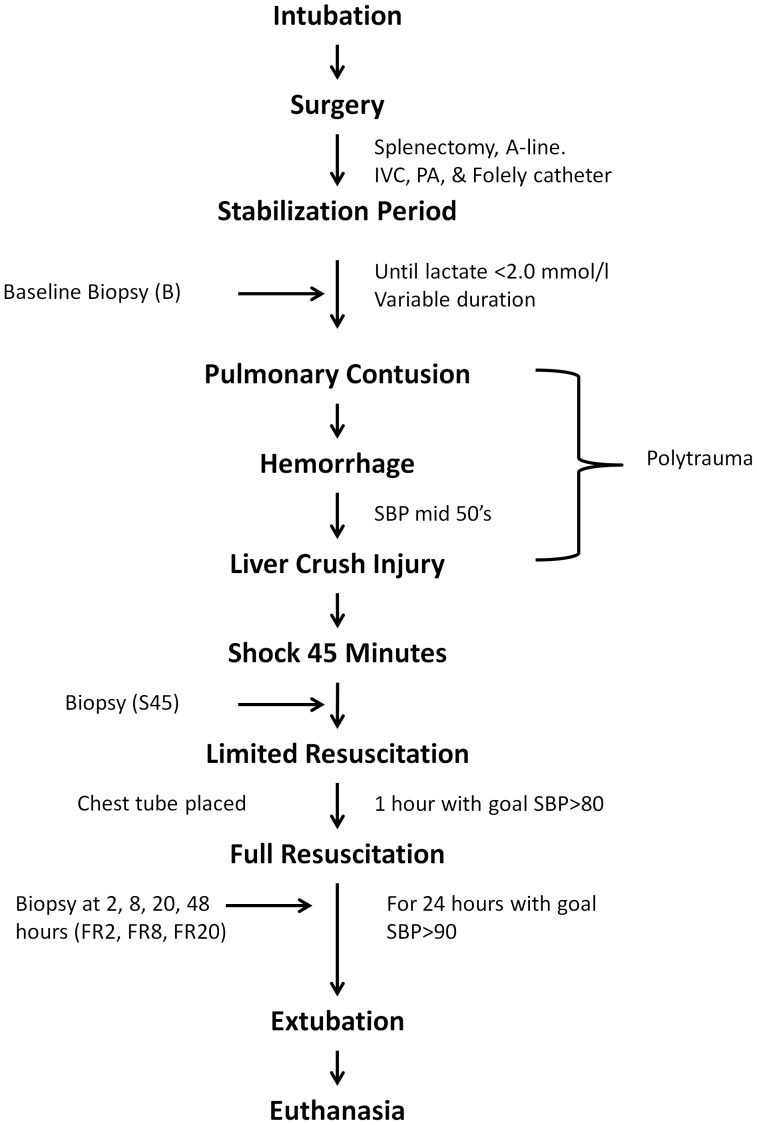
Sixty four (64) juvenile, male Yorkshire pigs were used in this study. All animals were fasted overnight. Two experimental groups were utilized: Carbohydrate Prefed (CPF, n = 32) and Fasted (FS, n = 32). CPF animals were given 7cc/kg bolus of Karo Syrup (mixture of sugars including ∼ 15% glucose, maltose, fructose and sucrose) diluted with water 1 hour prior to induction. The full experimental polytrauma and shock protocols have been described in detail previously [9], [10]. Briefly, animals were instrumented and splenectomized. Polytrauma was induced by a captive bolt device to create a blunt percussive injury to the chest followed by hemorrhage and a liver crush injury using a Holcomb clamp technique [11]. Hemorrhagic shock was induced by withdrawal of blood from the inferior vena cava until a systolic pressure of 45 to 55 mmHg was reached for 45 minutes (S45) to simulate time prior to medical help. Typically, this resulted in withdrawal of approximately 40% of the pig’s blood volume. Blood was placed in an acid-citrate-dextrose bag for later use. Following the shock period, animals received lactated Ringer’s fluid given as 20 cc/kg intravenous (IV) boluses to maintain a systolic blood pressure greater than 80 mmHg for one hour of limited resuscitation to simulate transportation to a medical center; then underwent full resuscitation protocol for the following 24 hours (Figure 1). This resuscitation included fluid, shed blood, and ventilator support per our standard protocol. After the resuscitation period, animals were extubated and sent to recovery and subsequently euthanized.
Figure 1. Graphical representation of the experimental timeline described in Methods.
At several time points throughout the experiment, liver biopsies were taken from the periphery of the liver ranging in weight from 0.2 to 0.6 grams. Biopsies were flash frozen in liquid nitrogen and stored at −80°C until preparation for RNA extraction. Biopsies were taken at the following timepoints: baseline after the animal stabilized from instrumentation (B), 45 minutes after hemorrhage (S45), 2, 8, and 20 hours after full resuscitation (FR2, FR8, FR20). RNA extractions and sequencing were conducted on B, FR2, FR8, and FR20. Analysis was not conducted on the S45 timepoint because of the short time period from baseline to allow RNA changes to take place.
RNA Preparation and Sequencing
RNA extraction and quality assessment
In a previous study, some of the samples from the original 64 animals had been utilized. As such, only those that had all consecutive timepoints were included. Ultimately, only 18 Fasted animals and 5 Prefed animals were analyzed at each timepoint (total n = 92). RNA was purified from liver samples using QIAshredder and Qiagen RNeasy Mini Kits (Qiagen, Chatsworth, CA). Total RNA isolates were quantified using a fluorimetric RiboGreen assay. Total RNA integrity was assessed using capillary electrophoresis, generating an RNA Integrity Number (RIN). All of the samples were verified as high quality (>1 microgram, RIN = 8+) and thus were converted to Illumina sequencing libraries.
Library creation
RNA samples were converted to sequencing libraries using Illumina’s Truseq RNA Sample Preparation Kit (RS-122-2001). In brief, 1 microgram of total RNA was enriched for mRNA using oligo-dT coated magnetic beads, fragmented, and reverse transcribed in cDNA. The cDNA was fragmented into smaller pieces blunt-ended, and ligated to indexed adaptors and amplified using 15 cycles of PCR. Final library size distribution was validated using capillary electrophoresis and quantified using PicoGreen fluorimetry and qPCR. Libraries were successfully sequenced for all samples.
Cluster generation and sequencing
Truseq libraries were hybridized to a paired-end flow cell and individual fragments were clonally amplified by bridge amplification on the Illumina cBot. Libraries were clustered at a concentration of 12 pM. The flow cell was then loaded on the HiSeq 2000 and sequenced using Illumina’s Sequencing by Synthesis (SBS) chemistry. Upon completion of a read, a 7 base pair index was performed for sample identification. Samples were run for 100 cycles with 10 million single reads per sample.
Primary analysis and de-multiplexing
Base call (.bcl) files for each cycle of sequencing were generated by Illumina Real Time Analysis software. The base call files and run folders were then exported to servers maintained at the Minnesota Supercomputing Institute (Minneapolis, MN). Primary analysis and de-muliplexing were performed using Illumina’s CASAVA software (version 1.8.2) resulting in FASTQ files.
Bioinformatics and Data Analysis
RNA-Seq read sequences produced by the Illumina HiSeq 2000 were aligned with the TopHat software [12] to the NCBI Sscrofa 10.2 reference genome. The BAM files from the TopHat mapping were sorted using SAMtools [13] and raw counts estimated by the Python script HTSeq count (http://www.-huber.embl.de/users/anders/HTSeq/) using the NCBI Sscrofa 10.2 reference genome. Identified contigs were converted to human orthologs with the BiomaRt Bioconductor package [14] which facilitates access to BioMart annotation resources [15]. Gene names used for identification are the official Human Genome Organization (HUGO) Gene Nomenclature Committee (HGNC) designations.
The resulting raw counts per gene were used by EdgeR [16] to estimate differential expression (DE). EdgeR (Bioconductor release 3.2.4) uses a pair-wise design to measure differential expression. The analysis is based on a negative binomial model that uses over-dispersion estimates to account for biological variability (i.e., sample to sample differences); this is an alternative to the Poisson estimates of biological variability that are often inappropriate [17]. Genes with less than 10 reads were excluded from the analysis and TMM normalization of the sequenced libraries was performed to remove effects due to differences in library size [18]. The most stringent dispersion method (tag-wise) was used to ensure that differential expression was not due to individual differences. EdgeR generates a log2 fold change for each gene, p values and the Benjamini-Hochberg false discovery rate (FDR) are calculated to statistically test the measured DE. Lastly, genes were filtered to those reporting log2 fold changes ≥1 or ≤ −1 (i.e. 2 fold change). The complete R code and parameters used for the analysis are provided in the Supplementary Material (Supplementary File 7).
Gene Ontology Analysis
The differentially expressed transcripts calculated between fed states at each time point (e.g. FSvCPF, FR2) and between timepoints within each group (e.g. FR8vB, FS) were analyzed using the functional annotation tools of DAVID [19], [20] and additional literature searches. Lists of DEGs from each comparison were entered into DAVID in addition to the complete list of sequenced genes to serve as background for analysis. DAVID analysis provides both functional annotations of each gene (Functional Annotation Table) and of each list of genes (Functional Annotation Clustering) to provide functional information using gene ontology [21]. The Functional Annotation Clustering tool provides an overall picture of the overrepresented and enriched functions by consolidating redundancies in gene ontology categories. Information on specific genes was obtained using the Functional Annotation Table tool and the scientific literature.
Results
RNA-Sequencing Quality
The RNA-sequencing (RNA-seq) results from the Illumina HiSeq 2000 were output as FASTQ format and mapped to the NCBI Sscrofa 10.2 release of the pig genome (ftp://ftp.ncbi.nih.gov/genbank/genomes/Eukaryotes/vertebrates_mammals/Sus_scrofa/Sscrofa10.2/) using TopHat [12]. One FR8 sample failed to sequence successfully and was omitted from further analysis. For each sample, approximately 11.8 million reads were generated (range, 6.9 to 20.6 million reads). On average 88.8% of the reads generated were mapped uniquely (range, 85.7–98.3 percent mapped). Following conversion to human orthologs and Human Gene Nomenclature Committee (HGNC) notation, to facilitate functional analysis, we identified 16,498 genes. The raw data has been made available through the Gene Expression Omnibus database accession number GSE55674.
Differentially Expression
We initially compared gene expression differences between CPF and FS animals at Baseline. Of the 16,498 genes, 68 were identified as differentially expressed genes (DEGs) with 14 upregulated and 54 downregulated in CPF relative to FS. In addition, subsequent analysis comparing each timepoint relative to baseline between CPF and FS identified 13, 29, and 30 DEGs at FR2, FR8 and FR20 versus baseline respectively. At each time point following resuscitation, all DEGs were higher in CPF compared to FS except 2 genes at FR20 versus baseline (CHKA and GCK) (Supplementary File 1).
We then compared gene expression differences between each time point and baseline within each fed state. Within carbohydrate prefed animals 116, 478, and 0 DEGs were identified at FR2, FR8, and FR20 timepoints versus baseline respectively (Supplementary File 2). Observed gene expression changes in fasted animals was far more extensive as 1442, 1460, and 1215 DEGs were identified at FR2, FR8 and FR20 timepoints versus baseline respectively (Supplementary File 3). Table 1 summarizes the DEGs for all comparisons (FDR<0.05).
Table 1. Number of differentially expressed genes between CPF and FS animals and between timepoints within groups.
| Comparison | Differentially Expressed Genes |
| CPFvFS, B | 68 |
| CPFvFS, FR2vB | 13 |
| CPFvFS, FR8vB | 29 |
| CPFvFS, FR20vB | 30 |
| FR2vB, CPF | 116 |
| FR8vB, CPF | 478 |
| FR20vB, CPF | 0 |
| FR2vB, FS | 1442 |
| FR8vB, FS | 1460 |
| FR20vB | 1215 |
Abbreviations: CPF (Carbohydrate Prefed), FS (Fasted), B (Baseline), FR2, FR8 and FR20 (2, 8 and 20 hours after full resuscitation).
Functional Analysis – Fed State Expression
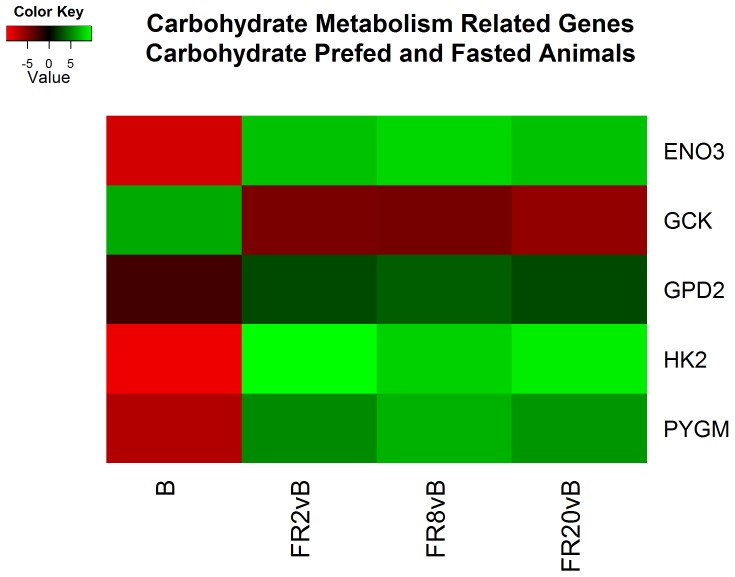
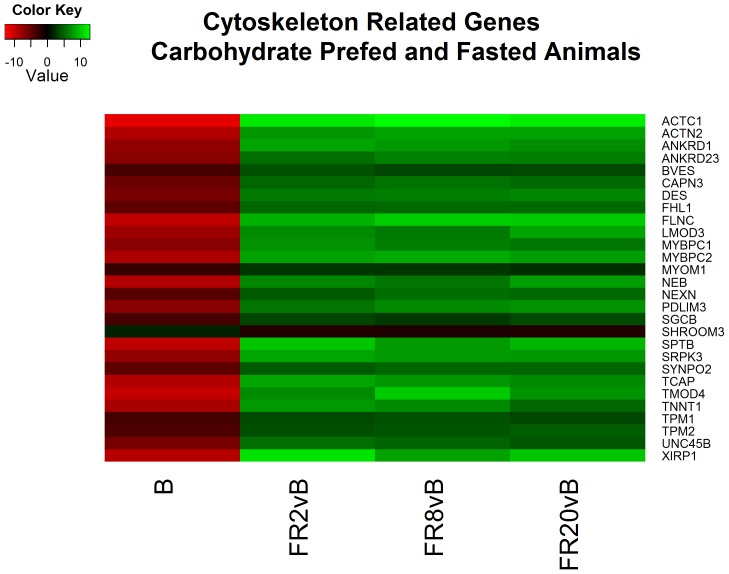
Analysis of the differentially expressed transcripts using the Database for Annotation, Visualization and Integrated Discovery (DAVID) [19] and accompanying literature searches provided an overall picture of the overrepresented functions between the two fed states at various time points (Supplementary File 4). As expected, comparisons at baseline provide evidence of upregulation of transcripts important for carbohydrate metabolism in CPF animals (Figure 2). Curiously, the majority of the differences were related to contractile proteins associated with the cytoskeleton. In contrast to previous cell-based studies our in vivo investigation reports higher actin mRNA in fasted animals at baseline [22]–[24]. This trend reverses during FR2, FR8 and FR20 where cytoskeletal proteins in CPF exceed FS animals (Figure 3).
Figure 2. Heatmap of log2 fold changes of genes associated with carbohydrate metabolism between carbohydrate prefed (CPF) and fasted (FS) animals.
Rows are differentially expressed genes (DEGs) following RNA sequencing. Columns denote the respective timepoints Baseline (B), 2 hours full resuscitation change from Baseline (FR2vB), 8 hours full resuscitation change from Baseline (FR8vB), and 20 hours full resuscitation change from Baseline (FR20vB). Green denotes higher concentration or larger changes in mRNA concentration in CPF whereas red denotes the opposite.
Figure 3. Heatmap of log2 fold changes of genes associated with cytoskeleton processes between carbohydrate prefed (CPF) and fasted (FS) animals.
Rows are differentially expressed genes (DEGs) following RNA sequencing. Columns denote the respective timepoints Baseline (B), 2 hours full resuscitation change from Baseline (FR2vB), 8 hours full resuscitation change from Baseline (FR8vB), and 20 hours full resuscitation change from Baseline (FR20vB). Green denotes higher concentration or larger changes in mRNA concentration in CPF whereas red denotes the opposite.
Functional Analysis – Responses to Shock and Resuscitation within each Fed State
Carbohydrate prefed - FR2 v. baseline
Analysis of each timepoint relative to baseline within CPF animals revealed several responses that are characteristic of hemorrhagic shock and resuscitation. Analysis of FR2vB identified functional responses including increases in processes associated with cell adhesions, hormone responses and cell membrane processes (Supplementary File 5). Exploration of the genes within these categories revealed activation of gene expression related to evidence of wound healing, and apoptosis.
Carbohydrate prefed - FR8 v. baseline
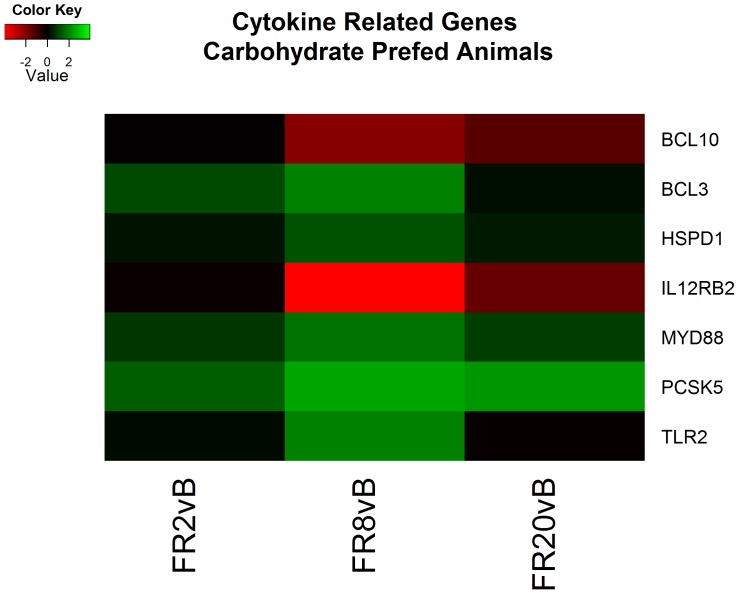
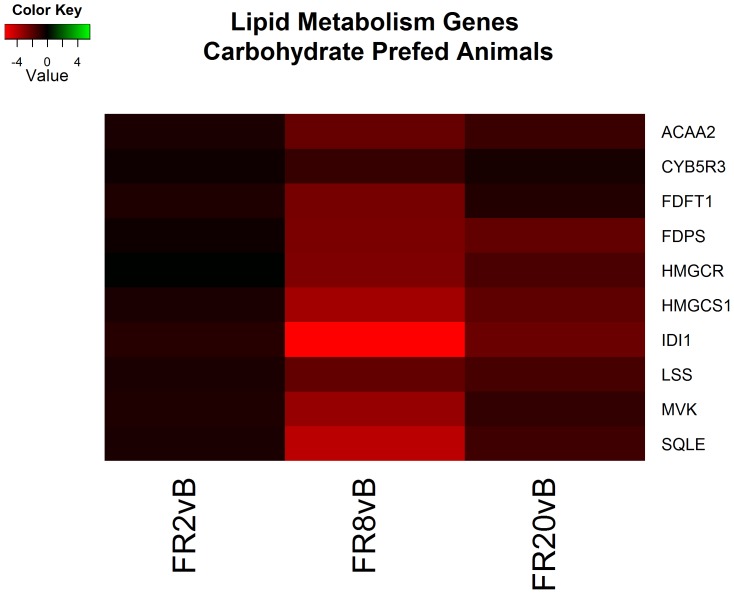
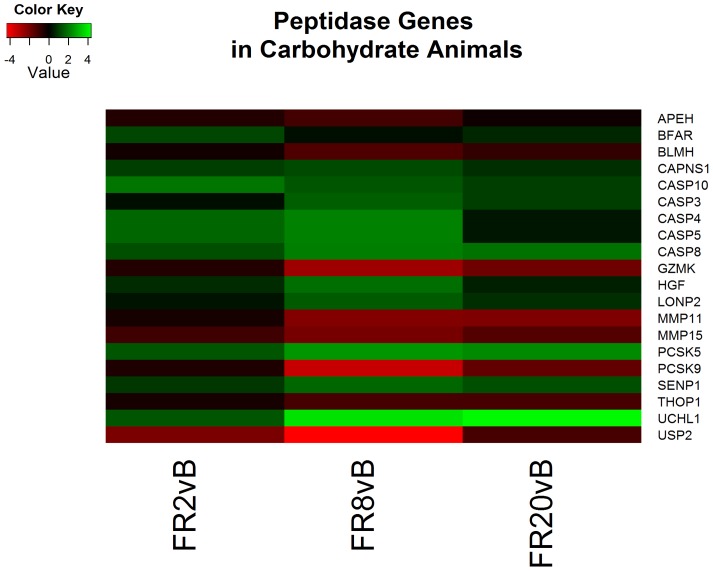
Continued resuscitation in CPF animals continued to identify gene expression characteristic of the response to hemorrhagic shock and resuscitation. Functional clusters identified included altered cytokine production (Figure 4), lipid metabolism (Figure 5), oxidation-reduction processes, hormone responses, and peptidase activity (Figure 6) (Supplementary File 5). Genes associated with cytokine production included heat shock 60 kDa protein 1 (HSPD1) and myeloid differentiation primary response 88 (MyD88) which both induce pro-inflammatory cytokines [25]–[27]. Analysis of specific genes within categories suggested decreased cholesterol synthesis, decreased fatty acid beta-oxidation and apoptosis. All processes are typical following ischemia-reperfusion [28], [29]. No genes were found to be significant when comparing FR20 to baseline, possibly a consequence of the small sample size in the CPF group.
Figure 4. Heatmap of log2 fold changes of genes associated with cytokine related genes in carbohydrate prefed (CPF) animals at each resuscitation timepoint (2, 8, and 20 hours) relative to Baseline (B).
Rows are differentially expressed genes (DEGs) following RNA sequencing. Columns denote the respective timepoints Baseline (B), 2 hours full resuscitation change from Baseline (FR2vB), 8 hours full resuscitation change from Baseline (FR8vB), and 20 hours full resuscitation change from Baseline (FR20vB). Green denotes increased mRNA expression with respect to Baseline whereas red denotes the opposite.
Figure 5. Heatmap of log2 fold changes of genes associated with lipid metabolism in carbohydrate prefed (CPF) animals at each resuscitation timepoint (2, 8, and 20 hours) relative to Baseline (B).
Rows are differentially expressed genes (DEGs) following RNA sequencing. Columns denote the respective timepoints Baseline (B), 2 hours full resuscitation change from Baseline (FR2vB), 8 hours full resuscitation change from Baseline (FR8vB), and 20 hours full resuscitation change from Baseline (FR20vB). Green denotes increased mRNA expression with respect to Baseline whereas red denotes the opposite.
Figure 6. Heatmap of log2 fold changes of genes associated with peptidase activity in carbohydrate prefed (CPF) animals at each resuscitation timepoint (2, 8, and 20 hours) relative to Baseline (B).
Rows are differentially expressed genes (DEGs) following RNA sequencing. Columns denote the respective timepoints Baseline (B), 2 hours full resuscitation change from Baseline (FR2vB), 8 hours full resuscitation change from Baseline (FR8vB), and 20 hours full resuscitation change from Baseline (FR20vB). Green denotes increased mRNA expression with respect to Baseline whereas red denotes the opposite.
Fasted – FR2 v. baseline
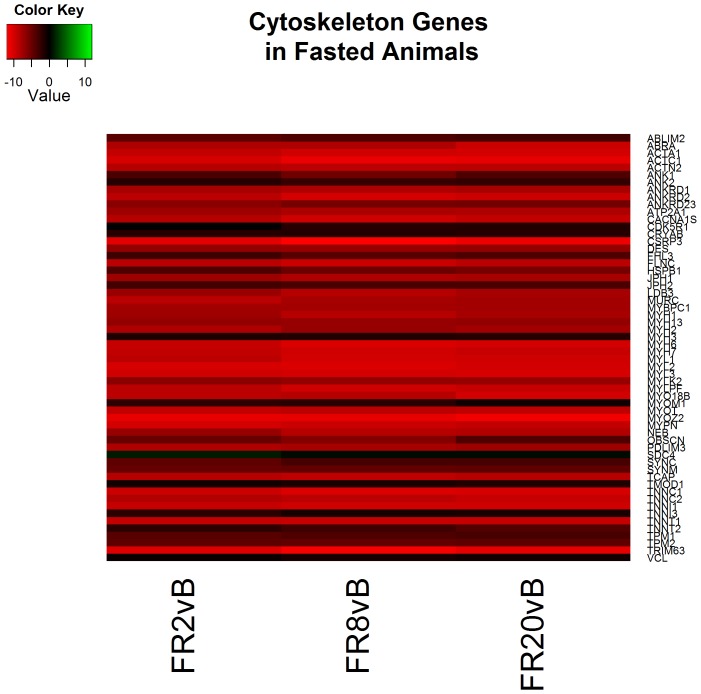
Functional analysis of resuscitation in FS animals returned 37 clusters of similar processes to CPF animals including cell adhesions, wound healing, cytokine inflammation and apoptosis (Supplementary File 6). In contrast to CPF animals, cytoskeleton reorganization appears to be taking place wherein cytoskeletal genes are decreasing (Figure 3). This finding is concordant with previous reports of cytoskeleton destabilization following reperfusion [30].
Fasted – FR8 v. baseline
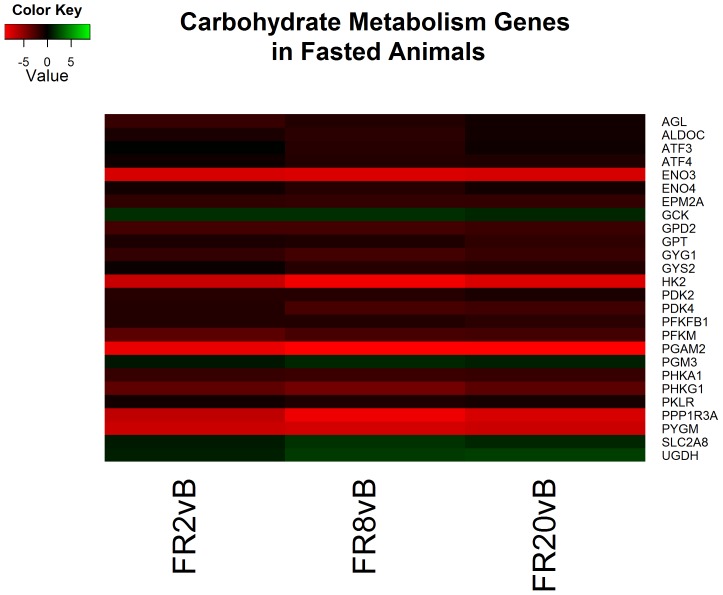
Following 8 hours of resuscitation FS, functional analysis identified 45 clusters that were very similar to CPF animals. The processes include cytokine inflammation, decreased cholesterol synthesis, and apoptosis (Supplementary File 6). In addition, cytoskeleton reorganization continues to take place as noted by decreasing cytoskeletal gene expression including actin and multiple elevated myosin heavy and light chains (MYH1, MYH2, MY3, MY6, MY7, MY13, MYL1, MYL2, MYL3) (Figure 7). In addition, glycolysis appears to be downregulated as several glycolytic genes decreased (HK2, PGAM2, ENO3, GPD2, PDK2, PFKM, and PKLR) (Figure 8).
Figure 7. Heatmap of log2 fold changes of genes associated with cytoskeleton processes in fasted (FS) animals at each resuscitation timepoint (2, 8, and 20 hours) relative to Baseline (B).
Rows are differentially expressed genes (DEGs) following RNA sequencing. Columns denote the respective timepoints Baseline (B), 2 hours full resuscitation change from Baseline (FR2vB), 8 hours full resuscitation change from Baseline (FR8vB), and 20 hours full resuscitation change from Baseline (FR20vB). Green denotes increased mRNA expression with respect to Baseline whereas red denotes the opposite.
Figure 8. Heatmap of log2 fold changes of genes associated with carbohydrate metabolism in fasted (FS) animals at each resuscitation timepoint (2, 8, and 20 hours) relative to Baseline (B).
Rows are differentially expressed genes (DEGs) following RNA sequencing. Columns denote the respective timepoints Baseline (B), 2 hours full resuscitation change from Baseline (FR2vB), 8 hours full resuscitation change from Baseline (FR8vB), and 20 hours full resuscitation change from Baseline (FR20vB). Green denotes increased mRNA expression with respect to Baseline whereas red denotes the opposite.
Fasted – FR20 v. baseline
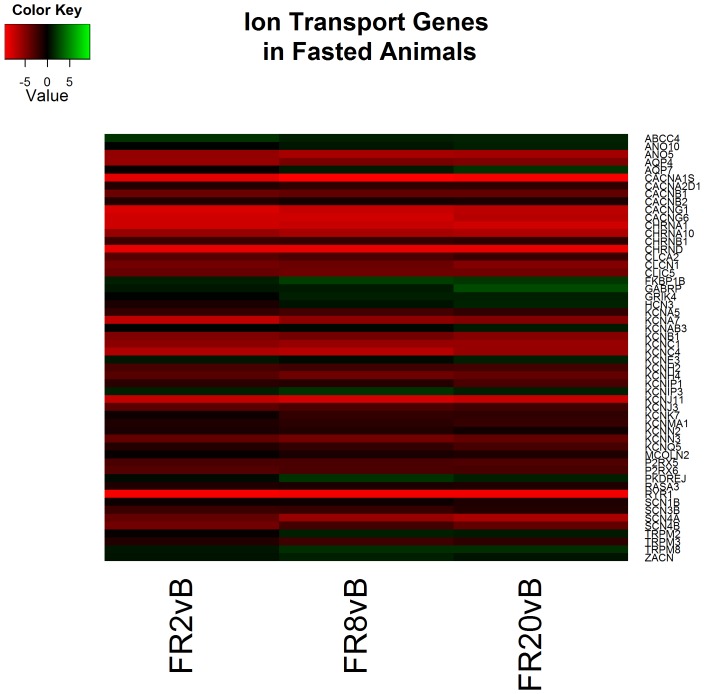
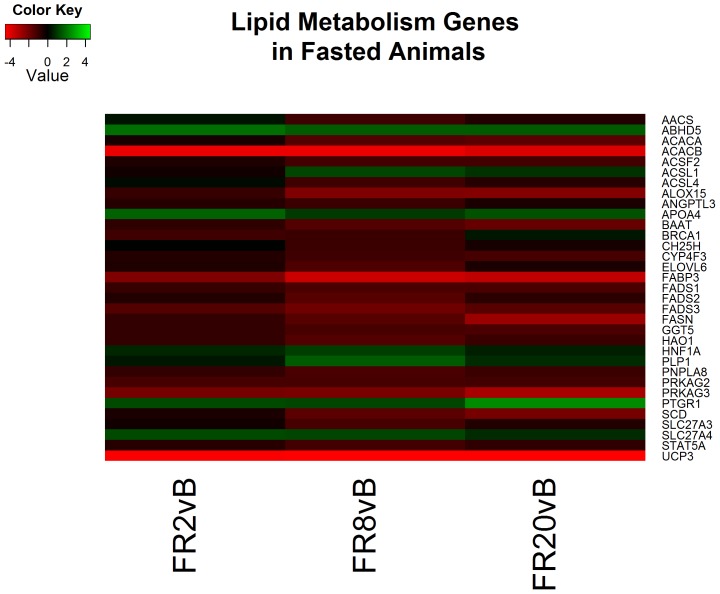
Lastly, of the 41 clusters identified by functional analysis following 20 hours of resuscitation primary processes continued to include cytoskeleton reorganization in addition to ion transport and glucose metabolism processes (Supplementary File 6). Genes associated with glycolytic and ion transport processes continue to both be decreased relative to baseline (Figures 8 & 9). Cholesterol and lipid oxidation are also decreased in overall expression (Figure 10).
Figure 9. Heatmap of log2 fold changes of genes associated with ion transport in fasted (FS) animals at each resuscitation timepoint (2, 8, and 20 hours) relative to Baseline (B).
Rows are differentially expressed genes (DEGs) following RNA sequencing. Columns denote the respective timepoints Baseline (B), 2 hours full resuscitation change from Baseline (FR2vB), 8 hours full resuscitation change from Baseline (FR8vB), and 20 hours full resuscitation change from Baseline (FR20vB). Green denotes increased mRNA expression with respect to Baseline whereas red denotes the opposite.
Figure 10. Heatmap of log2 fold changes of genes associated with carbohydrate metabolism in fasted (FS) animals at each resuscitation timepoint (2, 8, and 20 hours) relative to Baseline (B).
Rows are differentially expressed genes (DEGs) following RNA sequencing. Columns denote the respective timepoints Baseline (B), 2 hours full resuscitation change from Baseline (FR2vB), 8 hours full resuscitation change from Baseline (FR8vB), and 20 hours full resuscitation change from Baseline (FR20vB). Green denotes increased mRNA expression with respect to Baseline whereas red denotes the opposite.
Discussion
We report that the primary differences between the liver transcriptomic response to hemorrhagic shock between fasted and carbohydrate prefed pigs during the first 24 hours in a polytrauma model of hemorrhagic shock and resuscitation consist of glucose metabolism and cytoskeletal remodeling. Consistent with known changes associated with ischemia and reperfusion, we also found evidence of cytokine activation, apoptosis, and lipid metabolism ontological categories. Additionally, genes associated with increased pro-inflammatory cytokines were elevated in CPF animals relative to FS animals. Our results suggest the anti-inflammatory state of the FS animals may be a result of the fasting metabolic state.
Gene Ontology Profiles
We present the first, to our knowledge, comprehensive exploration of the pig liver transcriptome following a polytrauma model of hemorrhagic shock and resuscitation via RNA-seq. As expected following a carbohydrate prefed genes associated with carbohydrate metabolism were upregulated as indicated by elevated Glucokinase (GCK) and glycogen phosphorylase (PYGM) in CPF and FS animals respectively reflecting the alternate metabolic state wherein fasted animals are releasing glucose and CPF animals are breaking down available glucose.
The difference in cytoskeleton related genes in FS animals compared to CPF and over time suggests a link between fed state and metabolic response to hemorrhagic shock and resuscitation. Prior in vitro investigations have reported that glucagon, which is elevated during fasting periods, causes cellular shrinkage as a result of altered ion fluxes [31], [32]. Conversely, elevated insulin results in cellular swelling. Additionally, glucagon stimulates the transcription of actin followed by assembly of actin filaments [22]–[24]. Contrary to these in vitro studies, however, our in vivo investigation reports increased actin transcription in fasted animals compared to CPF animals. This cellular shrinkage has been previously described as triggering the ‘catabolic state’ of a cell resulting in a multitude of altered processes [33]. The presence of this cytoskeleton remodeling is further supported in our study by upregulation of contractile proteins including multiple myosins for intracellular transport. In addition, cellular swelling stabilizes actin filaments [34] which helps explain why cytoskeleton mRNA expression is higher in CPF than FS during resuscitation which usually results in actin depolymerization [35].
Previous studies elucidating the impact of cell swelling during ischemia and reperfusion report that cells naturally become hyperosmotic during ischemia and consequently take up additional fluid [36], [37]. This increased swelling and resultant cellular edema may compress capillaries thereby reducing or preventing reperfusion of capillary beds [38]–[40]. This process results in zones that prevent reperfusion resulting in the ‘no-reflow’ phenomenon [41]. It is possible that the fasting state displays a shrunken catabolic state that may provide an initial condition to partially mitigate the subsequent swelling that is an unavoidable consequence of ischemia and reperfusion. The benefit of induced cellular shrinkage on hepatocellular injury has been shown previously whereby hypertonic preconditioning (i.e. induced cellular shrinkage) reduces hepatocellular damage following ischemia reperfusion [42]. Furthermore, the use of hypertonic saline for reperfusion has been shown to decrease susceptibility to sepsis, mitigate inflammation, and reduce apoptosis after hemorrhagic shock [43]–[45] in addition to being attractive for small-volume resuscitation development [4].
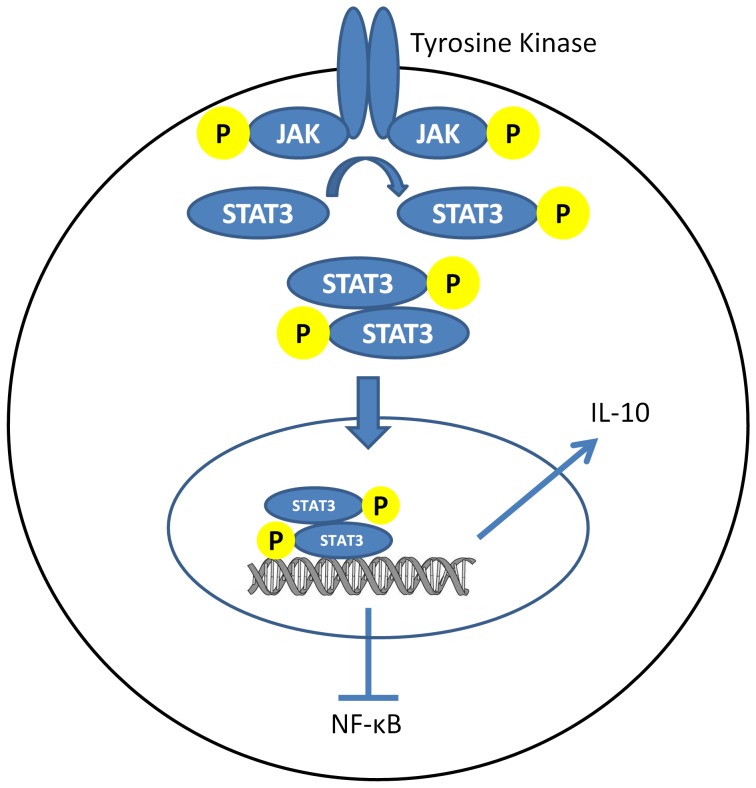
The full molecular mechanisms behind the proposed state are not fully elucidated however several components are understood. One direct result of cellular shrinkage is vasodilation potentially mediating the no-reflow condition. Furthermore, cellular shrinkage is a consequence of hypertonic treatments which have been shown mitigate inflammation following shock [46], [47]. The hyperosmotic environment causes cellular shrinkage which activates the tyrosine phosphorylation of Janus kinases. These kinases activate the transcription factor STAT3 [48] which ultimately stimulates Interleukin 10 (IL-10) production while simultaneously inhibiting pro-inflammatory cytokines (e.g. IL-1β, TNF-α, and intercellular adhesion molecules) by inhibiting the transcription factor NF-κB [49], [50] (Figure 11). Although IL-10 was not individually identified, the anti-inflammatory state of the FS is supported as several pro-inflammatory genes are elevated in CPF animals (Figure 8). Further research on the anti-inflammatory properties of cellular shrinkage is required.
Figure 11. Diagram of simplified Interleukin-10 (IL-10) pathway.
A hyperosmotic condition induces cellular shrinkage and activates tyrosine phosphorylation of Janus kinases (JAK) to subsequently phosphorylate STAT3 and IL-10 production.
Although this study utilized a larger sample size, our groups were unbalanced (18 versus 5). This difference in group size may have partially biased estimates. However, given the quality of the RNA-seq, consistency across timepoints, and agreement with supporting literature supports our results. Lastly, it is important to recall that the liver is only one component of the overall systemic response to hemorrhagic shock and resuscitation. Analysis of other organs and tissues would be should be pursued.
Conclusion
Analysis of the liver transcriptome between carbohydrate prefed and fasted pigs following hemorrhagic shock and resuscitation reveals that the first 24 hours results in different changes to the cytoskeleton structure. Our results suggest this both a metabolic response to decreased carbohydrate substrates and structural modifications in response to cellular shrinkage. Further evidence suggests that this shrunken state provides an anti-inflammatory condition that may decrease hepatocellar damage. More work is required to investigate the potential benefits of alternative diets such as the anti-inflammatory effects of increased intake of omega-3 fatty acids.
Supporting Information
List of genes differentially expressed between Carbohydrate Prefed and Fasted animals at Baseline and FR2, FR8 and FR20 vs. Baseline.
(XLSX)
List of genes differentially expressed over time within Carbohydrate Prefed animals.
(XLSX)
List of genes differentially expressed over time within Fasted animals.
(XLSX)
List of gene ontology profiles comparing Carbohydrate Prefed and Fasted animals at Baseline and FR2, FR8 and FR20 vs. Baseline.
(XLSX)
List of gene ontology profiles over time within Carbohydrate Prefed animals at Baseline and FR2, FR8 and FR20 vs. Baseline.
(XLSX)
List of gene ontology profiles over time within Fasted animals at Baseline and FR2, FR8 and FR20 vs. Baseline.
(XLSX)
R code for differential expression analysis.
(R)
Acknowledgments
BioMedical Genomics Center, Minnesota Supercomputing Institute.
Funding Statement
This work was funding by the University of Minnesota Department of Surgery Grant and the Office of Naval Research (N00014-09-1-0323 P00005). The funders had no role in study design, data collection and analysis, decision to publish, or preparation of the manuscript.
References
- 1. Holcomb JB, Stansbury LG, Champion HR, Wade C, Bellamy RF (2006) Understanding combat casualty care statistics. J Trauma 60: 397–401 10.1097/01.ta.0000203581.75241.f1 [DOI] [PubMed] [Google Scholar]
- 2. Spinella PC, Holcomb JB (2009) Resuscitation and transfusion principles for traumatic hemorrhagic shock. Blood Rev 23: 231–240 10.1016/j.blre.2009.07.003 [DOI] [PMC free article] [PubMed] [Google Scholar]
- 3. Holcomb J, Caruso J, McMullin N, Wade CE, Pearse L, et al. (2007) Causes of death in US Special Operations Forces in the global war on terrorism: 2001–2004. US Army Med Dep J: 24–37. [PubMed] [Google Scholar]
- 4. Dubick MA (2011) Current concepts in fluid resuscitation for prehospital care of combat casualties. US Army Med Dep J: 18–24. [PubMed] [Google Scholar]
- 5. Eastridge BJ, Mabry RL, Seguin P, Cantrell J, Tops T, et al. (2012) Death on the battlefield (2001–2011): implications for the future of combat casualty care. J Trauma Acute Care Surg 73: S431–437 10.1097/TA.0b013e3182755dcc [DOI] [PubMed] [Google Scholar]
- 6. Iyegha UP, Witowski N, Lexcen D, Mulier K, Asghar JI, et al. (2012) Does the fed state impact outcome in polytrauma and hemorrhagic shock? J Am Coll Surg 215: S52 10.1016/j.jamcollsurg.2012.06.152 [DOI] [Google Scholar]
- 7.Determan Jr. C, Lusczek ER, Witowski NE, Lexcen D, Mulier KE, et al. (n.d.) Carbohydrate fed state alters the metabolomic response to hemorrhagic shock and resuscitation in liver. Metabolomics: 1–8. doi:10.1007/s11306-014-0621-6.
- 8. Lusczek ER, Lexcen DR, Witowski NE, Mulier KE, Beilman G (2013) Urinary metabolic network analysis in trauma, hemorrhagic shock, and resuscitation. Metabolomics 9: 223–235 10.1007/s11306-012-0441-5 [DOI] [Google Scholar]
- 9. Lexcen DR, Lusczek ER, Witowski NE, Mulier KE, Beilman GJ (2012) Metabolomics classifies phase of care and identifies risk for mortality in a porcine model of multiple injuries and hemorrhagic shock. J Trauma Acute Care Surg 73: S147–S155 10.1097/TA.0b013e3182609821 [DOI] [PubMed] [Google Scholar]
- 10. Scribner DM, Witowski NE, Mulier KE, Lusczek ER, Wasiluk KR, et al. (2010) Liver Metabolomic Changes Identify Biochemical Pathways in Hemorrhagic Shock. J Surg Res 164: e131–e139 10.1016/j.jss.2010.07.046 [DOI] [PubMed] [Google Scholar]
- 11. Holcomb JB, Pusateri AE, Harris RA, Charles NC, Gomez RR, et al. (1999) Effect of dry fibrin sealant dressings versus gauze packing on blood loss in grade V liver injuries in resuscitated swine. J Trauma 46: 49–57. [DOI] [PubMed] [Google Scholar]
- 12. Trapnell C, Pachter L, Salzberg SL (2009) TopHat: discovering splice junctions with RNA-Seq. Bioinformatics 25: 1105–1111 10.1093/bioinformatics/btp120 [DOI] [PMC free article] [PubMed] [Google Scholar]
- 13. Li H, Handsaker B, Wysoker A, Fennell T, Ruan J, et al. (2009) The Sequence Alignment/Map format and SAMtools. Bioinformatics 25: 2078–2079 10.1093/bioinformatics/btp352 [DOI] [PMC free article] [PubMed] [Google Scholar]
- 14. Durinck S, Moreau Y, Kasprzyk A, Davis S, Moor BD, et al. (2005) BioMart and Bioconductor: a powerful link between biological databases and microarray data analysis. Bioinformatics 21: 3439–3440 10.1093/bioinformatics/bti525 [DOI] [PubMed] [Google Scholar]
- 15. Smedley D, Haider S, Ballester B, Holland R, London D, et al. (2009) BioMart - biological queries made easy. BMC Genomics 10: 22 10.1186/1471-2164-10-22 [DOI] [PMC free article] [PubMed] [Google Scholar]
- 16. Robinson MD, McCarthy DJ, Smyth GK (2010) edgeR: a Bioconductor package for differential expression analysis of digital gene expression data. Bioinformatics 26: 139–140 10.1093/bioinformatics/btp616 [DOI] [PMC free article] [PubMed] [Google Scholar]
- 17. Oshlack A, Robinson MD, Young MD (2010) From RNA-seq reads to differential expression results. Genome Biol 11: 220 10.1186/gb-2010-11-12-220 [DOI] [PMC free article] [PubMed] [Google Scholar]
- 18. Robinson MD, Oshlack A (2010) A scaling normalization method for differential expression analysis of RNA-seq data. Genome Biol 11: R25 10.1186/gb-2010-11-3-r25 [DOI] [PMC free article] [PubMed] [Google Scholar]
- 19. Huang DW, Sherman BT, Lempicki RA (2008) Systematic and integrative analysis of large gene lists using DAVID bioinformatics resources. Nat Protoc 4: 44–57 10.1038/nprot.2008.211 [DOI] [PubMed] [Google Scholar]
- 20. Huang DW, Sherman BT, Lempicki RA (2009) Bioinformatics enrichment tools: paths toward the comprehensive functional analysis of large gene lists. Nucleic Acids Res 37: 1–13 10.1093/nar/gkn923 [DOI] [PMC free article] [PubMed] [Google Scholar]
- 21. Ashburner M, Ball CA, Blake JA, Botstein D, Butler H, et al. (2000) Gene Ontology: tool for the unification of biology. Nat Genet 25: 25–29 10.1038/75556 [DOI] [PMC free article] [PubMed] [Google Scholar]
- 22. Theodoropoulos PA, Stournaras C, Stoll B, Markogiannakis E, Lang F, et al. (1992) Hepatocyte swelling leads to rapid decrease of the G−/total actin ratio and increases actin mRNA levels. FEBS Lett 311: 241–245 10.1016/0014-5793(92)81111-X [DOI] [PubMed] [Google Scholar]
- 23. Pedersen S, Hoffmann E, Mills J (2001) The cytoskeleton and cell volume regulation. Comp Biochem Physiol A Mol Integr Physiol 130: 385–399 10.1016/S1095-6433(01)00429-9 [DOI] [PubMed] [Google Scholar]
- 24. Hoffmann EK, Lambert IH, Pedersen SF (2009) Physiology of Cell Volume Regulation in Vertebrates. Physiol Rev 89: 193–277 10.1152/physrev.00037.2007 [DOI] [PubMed] [Google Scholar]
- 25. Cinel I, Opal SM (2009) Molecular biology of inflammation and sepsis: A primer*. Crit Care Med January 2009 37: 291–304 10.1097/CCM.0b013e31819267fb [DOI] [PubMed] [Google Scholar]
- 26. Tsan M-F, Gao B (2004) Cytokine function of heat shock proteins. Am J Physiol - Cell Physiol 286: C739–C744 10.1152/ajpcell.00364.2003 [DOI] [PubMed] [Google Scholar]
- 27. Kol A, Lichtman AH, Finberg RW, Libby P, Kurt-Jones EA (2000) Cutting Edge: Heat Shock Protein (HSP) 60 Activates the Innate Immune Response: CD14 Is an Essential Receptor for HSP60 Activation of Mononuclear Cells. J Immunol 164: 13–17. [DOI] [PubMed] [Google Scholar]
- 28. Angele MK, Schneider CP, Chaudry IH (2008) Bench-to-bedside review: Latest results in hemorrhagic shock. Crit Care 12: 218 10.1186/cc6919 [DOI] [PMC free article] [PubMed] [Google Scholar]
- 29. Peitzman AB, Harbrecht BG, Udekwu AO, Billiar TR, Kelly E, et al. (1995) Hemorrhagic shock. Curr Probl Surg 32: 925–1002 10.1016/S0011-3840(05)80008-5 [DOI] [PubMed] [Google Scholar]
- 30. Benkoël L, Dodero F, Hardwigsen J, Campan P, Botta-Fridlund D, et al. (2001) Effect of Ischemia-Reperfusion on Bile Canalicular F-Actin Microfilaments in Hepatocytes of Human Liver Allograft. Dig Dis Sci 46: 1663–1667 10.1023/A:1010693218680 [DOI] [PubMed] [Google Scholar]
- 31. Gaussin V, Baquet A, Hue L (1992) Cell shrinkage follows, rather than mediates, the short-term effects of glucagon on carbohydrate metabolism. Biochem J 287: 17–20. [DOI] [PMC free article] [PubMed] [Google Scholar]
- 32. Haussinger D (1996) The role of cellular hydration in the regulation of cell function. Biochem J 313: 697–710. [DOI] [PMC free article] [PubMed] [Google Scholar]
- 33. Häussinger D, Gerok W, Roth E, Lang F (1993) Cellular hydration state: an important determinant of protein catabolism in health and disease. The Lancet 341: 1330–1332 10.1016/0140-6736(93)90828-5 [DOI] [PubMed] [Google Scholar]
- 34. Haussinger D, Lang F, Gerok W (1994) Regulation of cell function by the cellular hydration state. Am J Physiol - Endocrinol Metab 267: E343–E355. [DOI] [PubMed] [Google Scholar]
- 35. Molitoris BA (1997) Putting the actin cytoskeleton into perspective: pathophysiology of ischemic alterations. Am J Physiol - Ren Physiol 272: F430–F433. [DOI] [PubMed] [Google Scholar]
- 36. Flores J, DiBona DR, Frega N, Leaf DA (1972) Cell volume regulation and ischemic tissue damage. J Membr Biol 10: 331–343 10.1007/BF01867864 [DOI] [PubMed] [Google Scholar]
- 37. Leaf A (1973) Cell Swelling A Factor in Ischemic Tissue Injury. Circulation 48: 455–458 10.1161/01.CIR.48.3.455 [DOI] [PubMed] [Google Scholar]
- 38. Tranum-Jensen J, Janse MJ, Fiolet WT, Krieger WJ, D’Alnoncourt CN, et al. (1981) Tissue osmolality, cell swelling, and reperfusion in acute regional myocardial ischemia in the isolated porcine heart. Circ Res 49: 364–381 10.1161/01.RES.49.2.364 [DOI] [PubMed] [Google Scholar]
- 39. Manciet LH, Poole DC, McDonagh PF, Copeland JG, Mathieu-Costello O (1994) Microvascular compression during myocardial ischemia: mechanistic basis for no-reflow phenomenon. Am J Physiol - Heart Circ Physiol 266: H1541–H1550. [DOI] [PubMed] [Google Scholar]
- 40. Gavin JB, Thomson RW, Humphrey SM, Herdson PB (1983) Changes in vascular morphology associated with the no-reflow phenomenon in ischaemic myocardium. Virchows Arch A 399: 325–332 10.1007/BF00612950 [DOI] [PubMed] [Google Scholar]
- 41. Rezkalla SH, Kloner RA (2002) No-Reflow Phenomenon. Circulation 105: 656–662 10.1161/hc0502.102867 [DOI] [PubMed] [Google Scholar]
- 42. Oreopoulos GD, Wu H, Szaszi K, Fan J, Marshall JC, et al. (2004) Hypertonic preconditioning prevents hepatocellular injury following ischemia/reperfusion in mice: A role for interleukin 10. Hepatology 40: 211–220 10.1002/hep.20281 [DOI] [PubMed] [Google Scholar]
- 43. Coimbra R, Hoyt DB, Junger WG, Angle N, Wolf P, et al. (1997) Hypertonic Saline Resuscitation Decreases Susceptibility to…: Journal of Trauma and Acute Care Surgery. J Trauma-Inj Infect Surg Care 42: 602–607. [DOI] [PubMed] [Google Scholar]
- 44. Bahrami S, Zimmermann K, Szelenyi Z, Hamar J, Scheiflinger F, et al. (2006) Small-Volume Fluid Resuscitation with Hypertonic Saline Prevents Inflammation but not Mortality In A Rat Model of Hemorrhagic Shock. [Miscellaneous Article]. Shock March 2006 25: 283–289 10.1097/01.shk.0000208808.03148.ea [DOI] [PubMed] [Google Scholar]
- 45. Murao Y, Hata M, Ohnishi K, Okuchi K, Nakajima Y, et al. (2003) Hypertonic Saline Resuscitation Reduces Apoptosis and Tissue Damage of The Small Intestine In A Mouse Model of Hemorrhagic Shock: Shock. 20: 23–28 10.1097/01.shk.0000078832.57685.6c [DOI] [PubMed] [Google Scholar]
- 46. Ke Q-H, Zheng S-S, Liang T-B, Xie H-Y, Xia W-L (2006) Pretreatment of Hypertonic Saline Can Increase Endogenous Interleukin 10 Release to Attenuate Hepatic Ischemia Reperfusion Injury. Dig Dis Sci 51: 2257–2263 10.1007/s10620-006-9135-6 [DOI] [PubMed] [Google Scholar]
- 47. Benkhart EM, Siedlar M, Wedel A, Werner T, Ziegler-Heitbrock HWL (2000) Role of Stat3 in Lipopolysaccharide-Induced IL-10 Gene Expression. J Immunol 165: 1612–1617. [DOI] [PubMed] [Google Scholar]
- 48. Gatsios P, Terstegen L, Schliess F, Häussinger D, Kerr IM, et al. (1998) Activation of the Janus Kinase/Signal Transducer and Activator of Transcription Pathway by Osmotic Shock. J Biol Chem 273: 22962–22968 10.1074/jbc.273.36.22962 [DOI] [PubMed] [Google Scholar]
- 49. Yoshidome H, Kato A, Edwards MJ, Lentsch AB (1999) Interleukin-10 suppresses hepatic ischemia/reperfusion injury in mice: Implications of a central role for nuclear factor κB. Hepatology 30: 203–208 10.1002/hep.510300120 [DOI] [PubMed] [Google Scholar]
- 50. Fiorentino DF, Zlotnik A, Mosmann TR, Howard M, O’Garra A (1991) IL-10 inhibits cytokine production by activated macrophages. J Immunol 147: 3815–3822. [PubMed] [Google Scholar]
Associated Data
This section collects any data citations, data availability statements, or supplementary materials included in this article.
Supplementary Materials
List of genes differentially expressed between Carbohydrate Prefed and Fasted animals at Baseline and FR2, FR8 and FR20 vs. Baseline.
(XLSX)
List of genes differentially expressed over time within Carbohydrate Prefed animals.
(XLSX)
List of genes differentially expressed over time within Fasted animals.
(XLSX)
List of gene ontology profiles comparing Carbohydrate Prefed and Fasted animals at Baseline and FR2, FR8 and FR20 vs. Baseline.
(XLSX)
List of gene ontology profiles over time within Carbohydrate Prefed animals at Baseline and FR2, FR8 and FR20 vs. Baseline.
(XLSX)
List of gene ontology profiles over time within Fasted animals at Baseline and FR2, FR8 and FR20 vs. Baseline.
(XLSX)
R code for differential expression analysis.
(R)


