Abstract
Within the amygdala, AMPA receptors expressing the AMPA-GluR1 (GluR1) subunit play an important role in basal glutamate signaling as well as behaviors associated with exposure to drugs of abuse like opiates. Although the ultrastructural location of GluR1 is an important functional feature of this protein, the basal distribution of GluR1, as well as its sensitivity to acute morphine, has never been characterized in the mouse central nucleus of the amygdala (CeA). Electron microscopic immunocytochemistry employing visually distinct gold and peroxidase markers was used to explore the distribution of GluR1 and its relationship with the mu-opioid receptor (μOR) in the mouse CeA under basal conditions and after morphine. We also looked at the effect of morphine on other glutamate receptor subunits, including AMPA-GluR2 (GluR2) and NMDA-NR1 (NR1). In opiate naive animals, GluR1 and μOR were present in diverse populations of neuronal profiles, but mainly in somatodendritic structures that expressed exclusive labeling for either antigen, as well as those co-expressing both proteins. Compared to saline treated animals, mice given morphine showed significant differences in the subcellular location of GluR1 in dendrites without co-expression of μOR. Although GluR2 also showed similar changes in non-μOR expressing dendrites, contrasting effects were seen in GluR2 and μOR co-expressing profiles. These results provide the ultrastructural basis for basal interactions involving the modulation of GluR1 or μOR activity in the mouse CeA. Further, they indicate that the subcellular distribution of GluR1 is modified by acute opiates in a manner that compares, as well as contrasts, with GluR2.
Keywords: Addiction, AMPA-GluR2, NMDA receptor, Opioids, Synaptic Plasticity
INTRODUCTION
Altered AMPA-type glutamate receptor function is a well characterized correlate of exposure to drugs of abuse, including opiates (Reissner and Kalivas 2010). The AMPA receptors are a heterogeneous class of multimeric ionotropic receptors composed of various combinations of AMPA receptor subunits (GluR1-4) that are encoded by separate genes (Cull-Candy et al. 2006). Due to their heterogeneous subunit composition, post-transcriptional modifications, and affiliations with auxiliary proteins, AMPA receptors express highly diverse functional properties including channel activation kinetics and Ca2+ permeability (Cull-Candy et al. 2006; Schwenk et al. 2012).
Receptors containing the GluR1 subunit in the absence of GluR2 are characterized by their Ca2+ conductance (Cull-Candy et al. 2006). The GluR1 subunit is expressed in neural pathways involved in addictive behavior (Petralia and Wenthold 1992; Rogers et al. 1991), and GluR1 levels have been shown to be impacted by opiates or opiate associated stimuli (Ren et al. 2009; Scheggi et al. 2004; Zhong et al. 2006). In addition to expression levels, opiate associated adaptations in the subcellular location of GluR1, a process generally linked with the functional state of this protein, have been reported in key components of neural pathways that are involved in reward-related behaviors, including the amygdala (Billa et al. 2010; Glass et al. 2005; Glass et al. 2008b; Lane et al. 2008).
The central nucleus of the amygdala (CeA) is an important component of neural systems that coordinate sensory and affective processes with memory and goal directed behaviors (Lang and Davis 2006). In addition to its established role in affect as well as emotional learning and memory, the CeA is also emerging as a key neuroanatomical substrate of addiction to opiates (Glass 2010). The CeA receives diverse information related to sensory experience, emotional state, and memory from glutamatergic inputs originating from the thalamus (Turner and Herkenham 1991), cerebral cortex (Fisk and Wyss 2000; McDonald 1998), other amygdala areas (Pitkanen et al. 1997), and the hippocampal formation (Cullinan et al. 1993; Kishi et al. 2006). Through its outputs to areas of the extended amygdala, hypothalamus, and brain stem, the CeA, in turn, plays an important role in coordinating autonomic function, neuroendocrine activity, and behaviors critical to homeostatic regulation (Knapska et al. 2007; LeDoux 2000), all of which are processes profoundly affected by opiate administration.
Ultrastructural associations between GluR1 and the μ-opioid receptor (μOR) have been described in the amygdala, but only in the context of high morphine intake during long-term self-administration in the rat (Glass et al. 2005). The synaptic organization of GluR1 in relationship to μOR has not been characterized in the CeA of untreated mice, the latter species being an invaluable source of common genetic models used in neurobiological studies of addiction and other psychiatric syndromes. It is also important to note that a significant property of opiate exposure is the rapid onset of behavioral and neural adaptations after an initial drug exposure; plasticity in behavior (Eisenberg 1982; Eisenberg and Sparber 1979; Gold et al. 1994; June et al. 1995; Ritzmann 1981) as well as glutamate receptor localization (Lane et al. 2008) have been characterized with only a single opioid exposure. However, it is unknown if acute morphine administration is associated with adaptations in the subcellular location of GluR1, or other glutamate receptor subunits, in dendrites of CeA neurons.
To examine the basal fine structural distribution of GluR1 and its relationship with μOR, as well as the impact of acute morphine on the subcellular location of GluR1 in dendrites without or with co-expression of μOR, we used high resolution electron microscopic immunocytochemistry employing visually distinct gold and peroxidase markers. We also examined the effect of acute morphine on the AMPA-GluR2 (GluR2) subunit and the NMDA-NR1 (NR1) receptor subunit, both of which have close associations with the opioid system in the CeA (Beckerman and Glass 2011; Beckerman and Glass 2012).
METHODS
Subjects
The experimental protocols were carried out in accordance with the National Institutes of Health Guide for the Care and Use of Laboratory Animals and were approved by the Institutional Animal Care and Use Committees at the Weill Cornell Medical College. All efforts were made to minimize the number of animals used and their suffering. Male C57BL/6J mice weighing 20–25 grams were housed in groups of 2–4 animals per cage and maintained on a 12-hr light/dark cycle (lights out 1800 hours). All mice had unlimited access to water and rodent chow in their home cages.
Systemic morphine injections
In order to habituate mice to the injection procedure and reduce non-specific stress-induced actions on protein levels/distribution, mice were handled and given saline injections for five days prior to their test injection, a procedure that has been shown to result in negligible neural activation, as measured by immediate early gene activity, in saline treated mice (Beckerman and Glass 2012). Morphine sulfate (10 mg/kg; NIDA) was prepared in 0.9% saline solution and given intraperitoneally on the test day. Control animals received an injection of saline (1 ml/kg, 0.9%). Ninety minutes following injection, a time period previously shown to result in drug-induced changes in GluR1 localization (Lane et al. 2008), animals from each group were sacrificed and transcardially perfused in preparation for immunocytochemistry.
Tissue preparation and single labeling immunocytochemical procedures
A total of six mice were used to examine basal GluR1 and μOR localization in naive mice, whereas nine mice (saline: 4; morphine: 5) were used for the morphine induced glutamate receptor subunit distribution study. All mice were anesthetized with pentobarbital (150 mg/kg, i.p.), and their brains were rapidly fixed by aortic arch perfusion sequentially with: (a) 15 ml of normal saline (0.9%) containing 1000 units/ml of heparin, (b) 40 ml of 3.75% acrolein in 2% paraformaldehyde in 0.1 M phosphate buffer (PB, pH 7.4), and (c) 100 ml of 2% paraformaldehyde in PB, all delivered at a flow rate of 20 ml/minute. The brains were removed and post-fixed for 60 minutes in 2% paraformaldehyde in PB. Coronal sections (40 μm) from the forebrain at the level of the CeA (Paxinos and Franklin 2000), were cut with a vibrating microtome. Tissue sections were processed for dual labeling immunocytochemistry using immunoperoxidase (IP) and immunogold-silver (IGS) markers, as previously described (Milner et al. 2011). Brain sections were treated with 1.0% sodium borohydride in PB and washed in PB. To enhance tissue permeability, sections were immersed in a cryoprotectant solution (20% sucrose and 8% glycerol in 0.05M PB) at room temperature followed by 15 minutes at −80°C. Sections were next rinsed in 0.1 M Tris-buffered saline (TBS, pH 7.6) and then incubated for 30 minutes in 0.5% bovine serum albumin (BSA) to minimize nonspecific labeling. For basal labeling of GluR1 and μOR, sections were incubated for 48 hours in a primary antiserum cocktail including rabbit anti-GluR1 (IP: 1:400; IGS: 1:100) and guinea pig anti-μOR (IP:1:400; IGS: 1:100). For the study examining opiate-related changes in the spatial distribution of glutamate receptor subunits, sections were incubated for 48 hours in a primary antiserum cocktail including guinea pig anti-μOR (IP: 1:400) and one of the following: 1). Rabbit anti-GluR1, 2). Rabbit anti-GluR2, or 3). Mouse anti-NR1, each at the same concentration (IGS: 1:100). After incubation, sections were rinsed in TBS and prepared first for peroxidase identification. Sections were incubated in IgG conjugated to biotin, rinsed in TBS, and then incubated for 30 minutes in avidin-biotin-peroxidase complex (1:100, Vectastain Elite Kit, Vector Laboratories) in TBS. The bound peroxidase was visualized by reaction for 5–6 minutes in a 0.2% solution of 3, 3′-diaminobenzidine and 0.003% hydrogen peroxide in TBS, followed by several washes in TBS. In preparation for immunogold labeling, sections were rinsed in 0.01 M PBS (pH 7.4), and blocked for 10 minutes in 0.8% BSA and 0.1% gelatin in PBS to reduce non-specific binding of gold particles. Sections then were incubated for 2 hours in IgG conjugated with 1 nm gold particles (1:50, AuroProbeOne, Amersham, Arlington Heights, IL), then rinsed in 0.5% BSA and 0.1% gelatin in PBS, and then PBS. Following gold conjugated antisera incubation, sections were then incubated for 10 minutes in 2% glutaraldehyde in PBS, and rinsed in PBS. The bound gold particles were enlarged by a 6 minute silver intensification using an IntenSE-M kit (Amersham, Arlington Heights, IL). The tissue was then postfixed in 2% osmium tetroxide in PB for one hour, and dehydrated in a series of alcohols, through propylene oxide, and flat embedded in EM BED 812 (EMS, Fort Washington, PA) between 2 sheets of Aclar plastic. In order to investigate possible cross-reactivity, tissue from naive mice was processed with omission of one or the other primary antisera followed by incubation with the secondary antisera corresponding to the alternate species.
Antisera
Brain sections containing the amygdala were processed for GluR1 and μOR labeling using affinity purified polyclonal rabbit and guinea pig antipeptide antisera, respectively (Millipore, Billerica, MA). The GluR1 antiserum was raised against a 15 amino acid peptide sequence corresponding to the C-terminus (Chemicon, Temecula, CA). This antiserum has been characterized by immunolabeling and Western blot analysis, showing that it recognizes a single band of 110 kDa corresponding to the GluR1 subunit with no cross-reaction with GluR2-4 subunits (Aicher et al. 2002). The μOR antiserum was raised against amino acids 384–398 of the cloned rat μOR. Immunolabeling of this receptor is abolished by preadsorption with the antigenic peptide (Drake and Milner 2002), and attenuated in mice with a knockout of either exon 1, 2/3, or 11 of the μOR gene, respectively (Jaferi and Pickel 2009). The rabbit anti-GluR2 antiserum recognizes amino acids 827–842 of rat GluR2 (Chemicon). This antibody has been characterized in transfected cells and Western blots of rat brain (Manufacturer’s data) and labeling is reduced in the amygdala of mice following local GluR2 gene deletion (unpublished report). A monoclonal mouse anti-NR1 antibody (Pharmingen) was used to label NR1. Labeling of the mouse anti-NR1 antiserum is significantly reduced following conditional NR1 deletion in the CeA (Beckerman and Glass 2012; Glass et al. 2008a).
Electron Microscopy
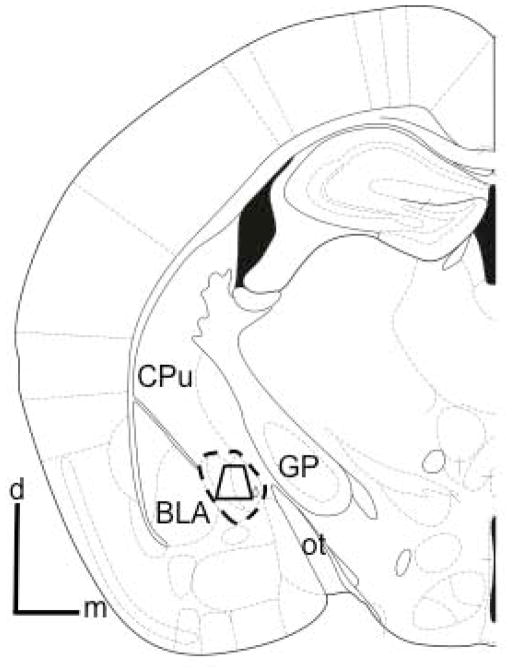
Ultrathin sections (60–80 nm) from the surface of flat-embedded sections containing the CeA (Fig. 1) were cut with a diamond knife using an ultramicrotome (Ultratome, NOVA, LKB, Bromma, Sweden), and sections were collected on grids. Electron microscopic images of this tissue were obtained using a digital camera (Advanced Microscopy Techniques, Danvers, MA) interfaced with a transmission electron microscope (Technai 12 BioTwin, FEI, Hillsboro, OR). Areas that showed labeling for μOR and one of the respective glutamate receptor subunits were captured as digital images using the AMT Advantage HR/HR-B CCD Camera System (AMT, Danvers, MA). For preparation of figures, images were adjusted for contrast and brightness using Photoshop 11 software, and imported into PowerPoint to add lettering.
Figure 1. Region of the CeA sampled by electron microscopy.
Schematic coronal hemisection of the forebrain illustrating the CeA and surrounding structures. The area bound by the trapezoid shows the region of the CeA (indicated by the dashed outline) sampled by electron microscopy, which included medial and lateral regions. Tissue analyzed by electron microscopy was obtained at a distance of 1.2 – 1.4 mm caudal to bregma (Paxinos and Franklin 2000). BLA: basolateral amygdala; CPu: caudate-putamen; d: dorsal; GP: global pallidus; m: medial; ot: optic tract.
Ultrastructural analysis
In order to control for potential labeling artifacts due to penetration of cytological reagents, sampling was performed at the tissue surface as determined by proximity to the epon-tissue interface. This was achieved by collecting electron micrographs exclusively in the transition zone where one edge of the sampling area was in contact with epon in a field of at least four grid squares. Digital images were captured and analyzed to determine the number of single and dual labeled neuronal and glial profiles. The classification of labeled dendrites was based upon descriptions by Peters et. al. (Peters et al. 1991). Dendrites were identified by the presence of postsynaptic densities, as well as ribosome’s and both rough and smooth endoplasmic reticula. However, profiles were also considered dendritic whenever postsynaptic densities were observed, independent of endoplasmic reticulum. Somata were distinguished by the presence of a nucleus. Axon terminals were identified by size (at least 0.2 μm diameter) and the presence of synaptic vesicles. Astrocytes were identified by their irregular shape, the presence of filamentous membranes apposing dendrites or axons, or the presence of gap junctions. Synapses were defined as either symmetric or asymmetric, according to the presence of either thin or thick postsynaptic specializations, respectively. Appositions were distinguished by closely spaced plasma membranes that lacked recognizable specializations, or interposing astrocytic processes. Structures containing electron dense granular precipitate darker than that seen in similar processes in the neuropil were considered as containing immunoperoxidase labeling. At least one gold particle per small profile, or two gold particles for larger profiles were considered as evidence of positive immunogold labeling, provided that comparable areas of epon, or neuropil containing myelin or other structures not expressing labeling for any of the antigens, were devoid of gold-silver deposits (Hara and Pickel 2008). Under similar conditions of low background, it has been shown that 1–2 gold particles in small profiles, such as dendritic spines, is equivalent to four or more in dendritic profiles with a larger surface area (Wang et al. 2003).
For the analysis of gold particle distribution, we used an established procedure that successfully shows regional differences in the subcellular location of proteins (Glass et al. 2008b). From the CeA of each animal, ultrathin sections at the tissue-surface interface were selected for analysis. From each section, 360 fields (60.5 μm2/field) per animal were analyzed by an experimenter blind to the treatments. Digital images were captured and analyzed to determine: (1) the number of single and dual labeled dendritic profiles, and (2) the number of gold-silver particles present in the cytoplasm, or in contact with the plasma membrane. For quantification of cross-sectional area, surface area, as well as minor and major axis lengths, digital images from saline and morphine treated mice were analyzed with MCID software (Imaging Research Inc., Ontario, Canada). Using JMP software (version 5.0.1, SAS, Cary, NC), dendritic profiles were sorted by size using k-means cluster analysis (Lane et al. 2008) with three clusters selected corresponding to proximal, intermediate, and distal dendritic profiles. K-means cluster analysis was calculated with minor axis length, a valid metric of dendritic profile size (Glass et al. 2004). This analysis yielded the following size clusters: ≤0.6 μm (small/distal), 0.61–1.1 μm (intermediate), and ≥1.12 μm (large/proximal). Data were analyzed by Analysis of Variance and differences in means were analyzed by Fisher’s Protected Least Significant Difference.
RESULTS
In untreated mice immunolabeling for GluR1 is primarily located in somata and dendrites with or without concomitant μOR labeling in the CeA
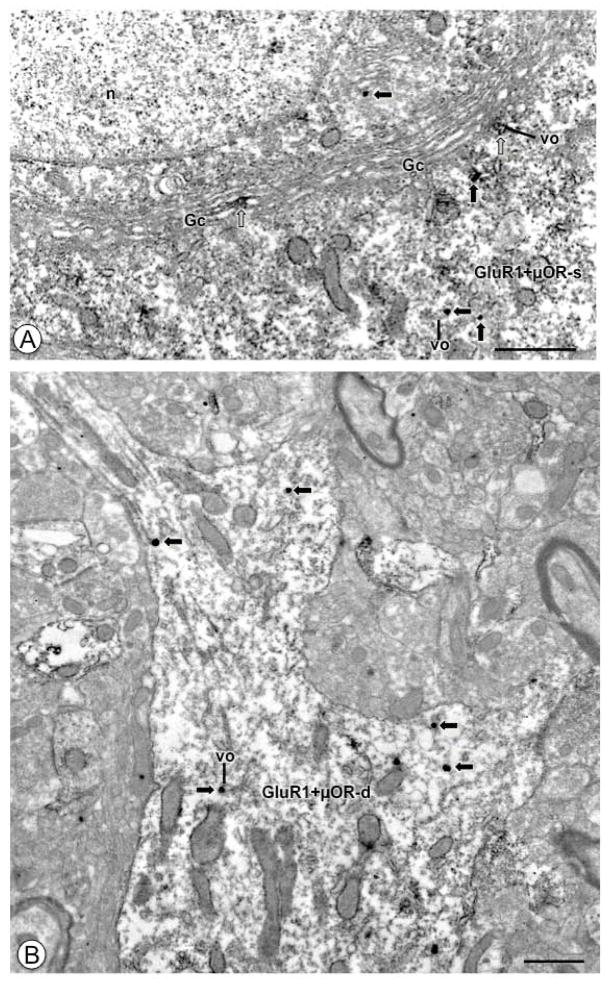
Electron microscopic analysis of the CeA of untreated mice revealed that GluR1 labeling was present in neuronal cell bodies, with, or without, immunoreactivity for μOR. Within somata, immunolabeling for GluR1 was typically present in the cytoplasm (Fig. 2A), and occasionally near the plasma membrane. Many cell bodies labeled for GluR1 also expressed μOR immunoreactivity, which was also typically found in the cytoplasm. GluR1 also extended into proximal portions of dendritic profiles, some of which were also shown to contain immunoreactivity for μOR (Fig. 2B). In large dendritic profiles, immunoreactivity for GluR1 was typically found intracellularly (Fig. 2B). Dual labeled intermediate size dendritic profiles showed immunolabeling for GluR1 intracellularly and near the plasma membrane. These dendrites frequently received asymmetric excitatory type synapses from unlabeled axon terminals, and, when on the surface, GluR1 was present near the extrasynaptic plasma membrane (Figs. 3A). In addition to these larger structures, GluR1 was also present in small dendritic profiles that were contacted by axon terminals forming asymmetric type synaptic junctions (Fig. 3B).
Figure 2. Under basal conditions CeA neuronal cell bodies and proximal dendritic profiles express GluR1 and μOR.
(A). A portion of a neuronal cell body (GluR1+μOR-s) shows IGS labeling for GluR1 (black arrows) and IP reaction product for μOR (white arrows). A Golgi Complex (GC) beneath the nucleus (n) shows IP labeling for μOR, as does a nearby small vesicular organelle (vo). Immunogold-silver particles for GluR1 (black arrows) are found in the cytoplasm. (B). A proximal dendritic profile (GluR1+μOR-d) expresses IGS labeling for GluR1 (black arrows) and diffuse IP labeling for μOR. Labeling for GluR1 is located near small vesicular organelles (vo). Labeling for GluR1 can be seen in smaller dendritic arborizations. Scale Bars: (A) 1.0 μm; (B) 0.5 μm.
Figure 3. In opiate naive animals medium and small-size dendritic processes of CeA neurons express GluR1 and μOR.
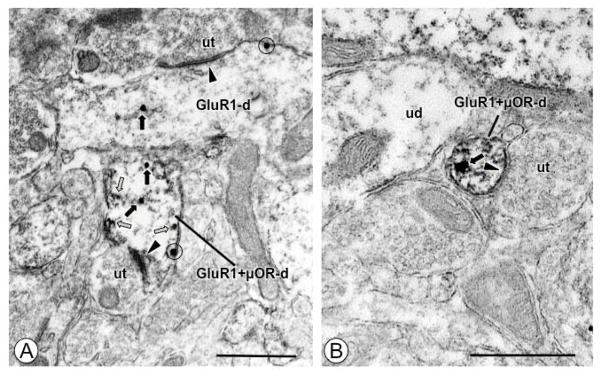
(A). A dendritic profile (GluR1+μOR-d) expresses IGS labeling for GluR1 and IP labeling for μOR (white arrows). A longitudinally sectioned single labeled dendritic profile (GluR1-d) and the dual labeled profile both show IGS particles in the cytoplasm (black arrows), and near the plasmalemma (circle). Both dendritic profiles receive asymmetric excitatory type synapses (arrow heads) from unlabeled axon terminals (ut). (B). A small dendritic profile (GluR1+μOR-d) contains intracellular IGS labeling for GluR1 (black arrow) in the cytoplasm, and diffuse IP labeling for μOR. This profile receives an asymmetric synapse (arrow head) from an unlabeled axon terminal (ut). Scale Bars: 0.5 μm.
Following visual inspection, the ultrastructural distribution of GluR1 was quantified in neuronal profiles (somata, dendrites, spines, axons, and axon terminals). In forebrain sections processed for IGS labeling of GluR1 and IP labeling of μOR, a total of 759 labeled processes were counted in 18,975 μm2 of tissue sampled from the CeA. Of these, 329 were single labeled for GluR1, the majority of which were somata or dendrites (82%), or dendritic spines (14%), while there were only low levels of axons (1%) and axon terminals (2%). A total of 282 profiles were single labeled for μOR, the majority of which were dendrites (68%), whereas 148 profiles were dually labeled. Among all labeled profiles, 14% showed labeling for both GluR1 and μOR, and most of these were somata (17%) or dendrites (82%). Of 223 profiles sampled from 5,575 μm2 of tissue processed with markers reversed (i.e. IP labeling of GluR1 and IGS labeling of μOR), a similar distribution was found. Of the 137 single GluR1 labeled profiles, the majority were somata/dendrites (85%) and dendritic spines (18%). A total of 53 profiles were exclusively labeled for μOR, the majority of which were dendrites (60%). Of the 33 dual labeled structures, 24% were somata, 70% were dendrites, and 6% were dendritic spines.
Acute morphine is associated with changes in the distribution of GluR1 selectively in single labeled dendritic profiles
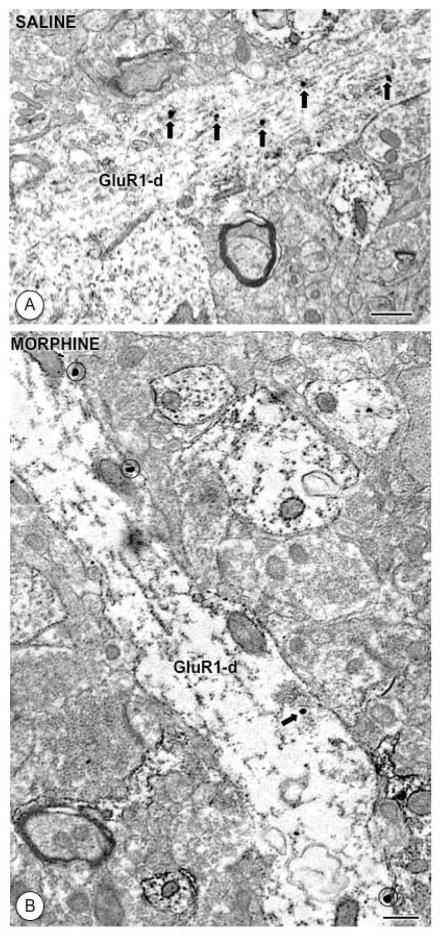
Forebrain sections containing the CeA from mice injected with either saline or morphine were processed for IGS and IP labeling of GluR1 and μOR, respectively. A total of 21,780 μm2 of tissue containing 360 sampled fields were sampled from each animal. By visual analysis of tissue from saline administered mice it was found that IGS GluR1 labeling was present in cytoplasmic sites as well as near the plasma membrane in single and dual labeled profiles of various sizes, generally comparable to untreated animals. Although the distribution of GluR1 in dual labeled structures was generally similar in both treatment groups, certain differences were noted in single labeled profiles. For example, although GluR1 was seen throughout the cytoplasm of large dendritic profiles of saline treated mice (Figs. 4A), there appeared to be lower levels of cytoplasmic labeling along with an increase in surface GluR1 in morphine treated mice (Figs. 4B).
Figure 4. Acute morphine affects the distribution of GluR1 in single labeled dendritic profiles.
(A). A large longitudinally sectioned dendritic profile (GluR1-d) from a CeA neuron of a saline treated animal shows IGS labeling (black arrows) exclusively in intracellular sites. (B). In a large dendrite from a morphine treated mouse, GluR1 labeling is expressed mainly on the plasmalemma (circles). Scale Bars: 0.5 μm.
By quantitative analysis, collapsed across all dendritic profiles, the density of intracellular [F(1,600)= 17.6, p<0.0001], but not surface [F(1,600)= 0.44, p>0.5] GluR1 was lower in morphine treated mice compared to those given saline. There were no between-group differences in the cross-sectional area [F(1, 600)= 0.02, p>0.8], surface area [F(1,600)=0.01, p>0.9], minor axis length [F(1, 600)= 0.8, p>0.3], or the ratio of major/minor axis lengths [F(1, 600)= 0.1, p>0.7] in dendritic profiles. There were no interanimal differences in total gold particles [F(8, 611)= 1.1, p>.3] in profiles other than dendrites (somata, axons, axon terminals).
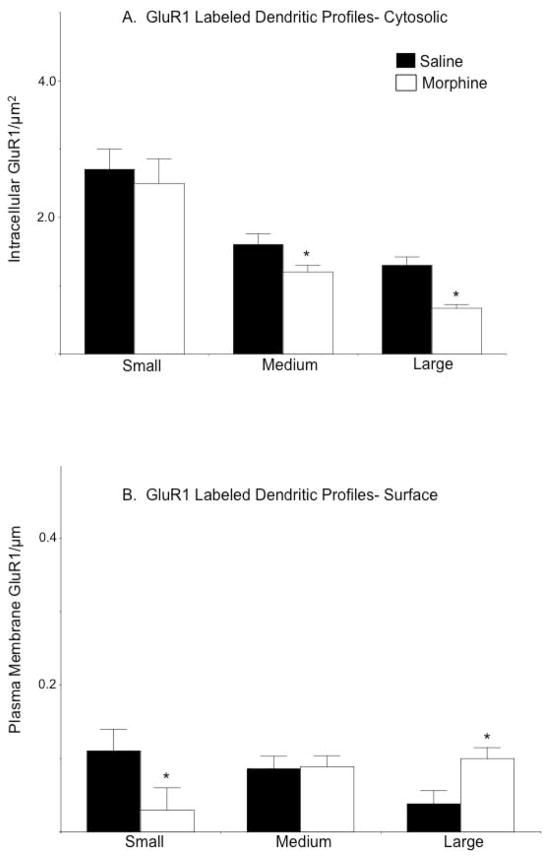
Analysis of the distribution of GluR1 after segregating dendrites into populations based on profile size (small/distal, intermediate, large/proximal), as well as labeling type (GluR1; GluR1+μOR) revealed that treatment-related differences in GluR1 location occurred only in select subpopulations of single labeled dendritic profiles. Compared to saline injected mice, the density of cytoplasmic GluR1 was significantly lower in intermediate [F(1,157)= 4.9, p<0.05] and large [F(1,102)= 30.0, p<0.0001], but not small [F(1,53)= 0.1, p>0.7] dendritic profiles in the CeA of morphine treated animals (Figure 5A). Although there was a decrease in surface labeling in small profiles [F(1,53)= 3.8, p<.05], there was also a concomitant increase in plasma membrane GluR1 specifically in large dendritic profiles [F(1,102)= 6.9, p<0.01] of morphine treated animals (Figure 5B). No differences in plasmalemmal GluR1 were seen in intermediate [F(1, 157)= 0.02, p>0.8] size single labeled profiles.
Figure 5. The impact of acute morphine on the distribution of GluR1 depends on dendritic profile size.
(A). The density [number/cross-sectional area (μm2)] of intracellular GluR1 is significantly lower in intermediate and large dendritic profiles of CeA neurons in morphine treated mice. (B). The density [number/plasma membrane area (μm)] of GluR1 labeling near the plasma membrane is significantly lower in small dendritic profiles from the CeA of morphine treated mice. However, there is a concomitant increase in the density of GluR1 labeling in large dendritic profiles. *p<.0.05 in morphine compared to saline treated mice by Fisher’s PLSD.
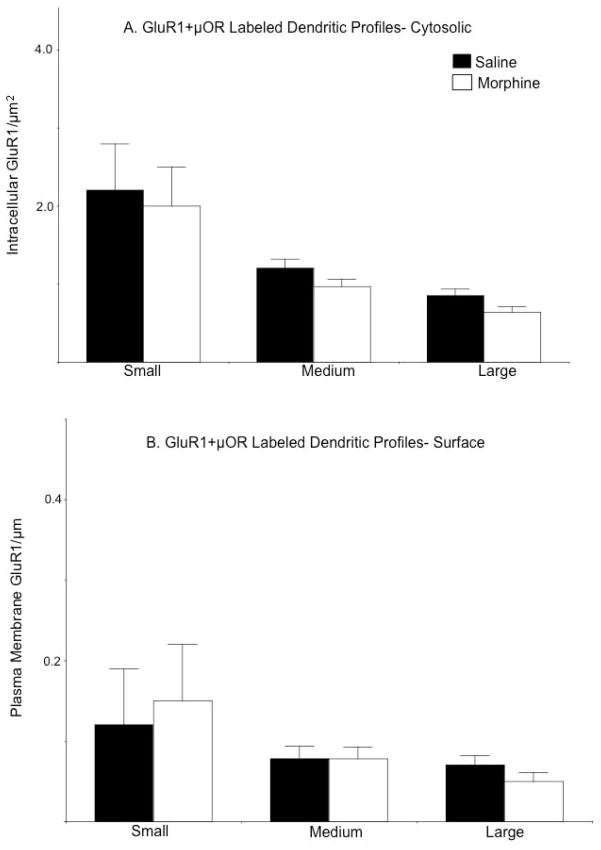
In dual labeled profiles, there were no significant differences in the intracellular or surface density of GluR1 in small [intracellular: F(1, 30)= 0.001, p>0.9; surface: F(1, 30)=0.6, p>0.4], intermediate [intracellular: F(1,134)=2.4, p>0.1; surface: F(1,134)=0.00001, p>0.9], or large [intracellular: F(1,121)=3.7, p>0.05; surface: F(1,121)=1.1, p>0.2] dendritic profiles (Figures 6A–B).
Figure 6. Morphine does not affect the levels or distribution of GluR1 in dual labeled dendritic profiles.
(A–B). There are no significant differences in the density of intracellular or surface GluR1 labeling in small, intermediate, or large dual labeled dendritic profiles in mice administered saline or morphine.
Acute morphine differentially impacts the distribution of GluR2 in single and dual labeled dendritic profiles
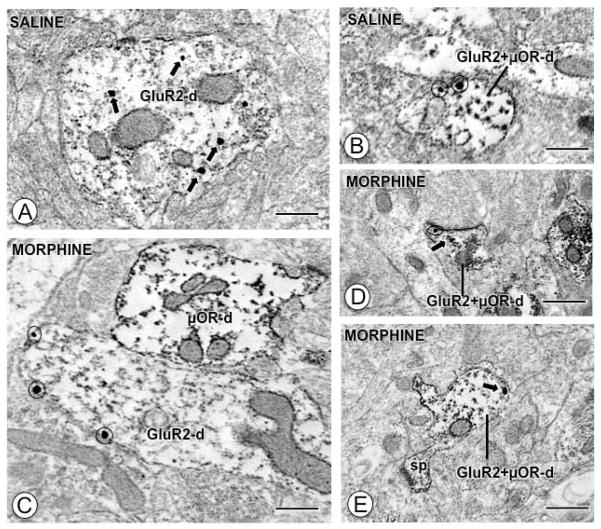
The effect of morphine on the ultrastructural distribution of GluR2 in the CeA was assessed in forebrain sections adjacent to those used in the GluR1 study above, except that these were processed for dual IGS and IP labeling of GluR2 and μOR, respectively. A total of 360 fields from 21,780 μm2 of tissue were sampled. Consistent with a previous report (Beckerman and Glass 2011), qualitative analysis revealed diverse populations of somata and dendrites in the CeA, including those exclusively labeled for GluR2, μOR, or those co-labeled for both. Visual analysis revealed that GluR2 was present in the cytoplasm in large (Fig. 7A) dendritic profiles in saline treated mice, whereas there appeared to be an increase in plasma membrane GluR2 that was most prominent in larger dendritic profiles (Fig. 7C) in morphine treated mice. A different pattern was noted in dendrites dually labeled for GluR2 and μOR: an increase in cytoplasmic GluR2 along with a decrease in plasma membrane GluR2 labeling in small dendrites (Fig. 7B–D–E).
Figure 7. Acute morphine affects the distribution of GluR2 in single and dual labeled dendritic profiles.
(A). A large single labeled dendritic profile (GluR2-d) from a CeA neuron of a saline injected mouse expresses intracellular IGS particles (black arrows) for GluR2. (B). A small dual labeled dendritic profile (GluR2+μOR-d) from a saline injected mouse shows IGS particles exclusively near the surface (circles). (C). A large obliquely sectioned single labeled dendritic profile (GluR2-d) from a morphine treated animal shows IGS labeling for GluR2 primarily near the plasma membrane (circles). (D–E). Small dual labeled dendritic profiles (GluR2+μOR-d) from animals given morphine express sparse IGS GluR2 labeling near the surface (circle) or in the cytoplasm (arrows). Scale Bars: 0.5 μm.
The distribution of GluR2 was quantified in saline and morphine treated mice. Collapsed across all dendritic profiles, there were no between-group differences in the intracellular [F(1, 497)= 0.4, p>0.5], or surface [F(1, 497)= 0.9, p>0.3] densities of GluR2. There were also no differences in several morphological parameters, including cross-sectional [F(1, 497)= 3.5, p>0.05] or surface [F(1, 497)= 2.9, p>0.05] areas, minor axis length [F(1, 497)= 2.5, p>0.05], or the ratio of lengths of major/minor axes [F(1, 497)= 0.8, p>0.3]. There were no interanimal differences in total gold particles [F(8, 507)= 1.3, p>0.1] in profiles other than dendrites (somata, axons, axon terminals).
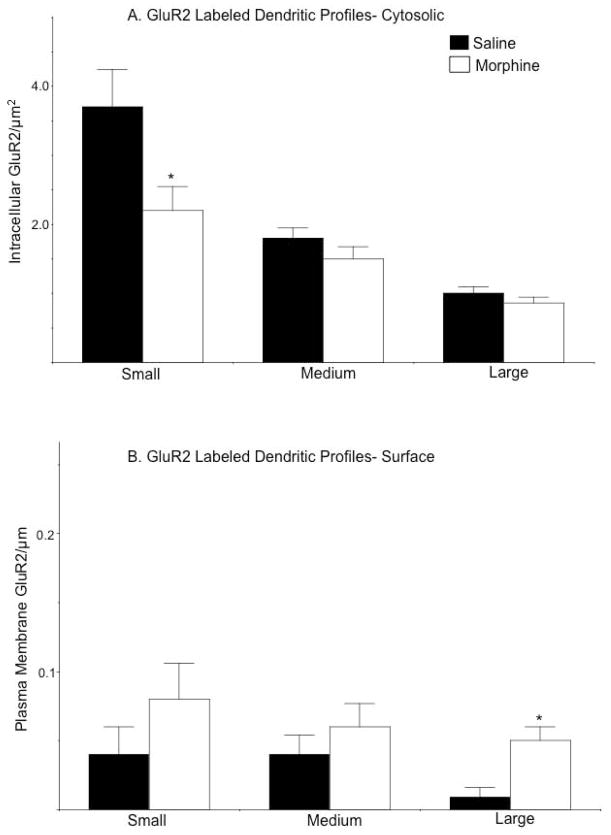
Analysis of GluR2 distributions after categorizing dendritic profiles according to size and labeling classifications revealed notable differences between saline and morphine treated animals. In small single labeled dendritic profiles, there was a significant decrease in the density of cytoplasmic GluR2 labeling [F(1, 61)= 4.9, p<0.05; Fig. 8A]. However, in large single labeled profiles there was a significant increase in the density of plasmalemmal GluR2 [F(1, 61)= 6.3, p<.05; Fig. 8B]. There were no significant differences in the density of intracellular GluR2 in intermediate [F(1, 116)= 1.8, p>0.1] or large [F(1, 61)= 1.5, p>0.2] dendrites, nor were there differences in surface labeling in small [F(1, 61)= .9, p>0.3] or intermediate [F(1, 116)= 0.6, p>0.4] structures.
Figure 8. Morphine exposure is associated with contrasting changes in the cytoplasmic and plasmalemmal distribution of GluR2 in single labeled dendritic profiles.
(A). Small single labeled dendritic profiles of CeA neurons from morphine treated animals have lower levels of intracellular GluR2 compared to mice given saline. (B). There are increases in the density of plasma membrane GluR2 labeling in dendritic profiles from CeA neurons of mice administered morphine compared to animals treated with saline. These differences are significant in large dendritic profiles. *p<.0.05 in morphine compared to saline treated mice by Fisher’s PLSD.
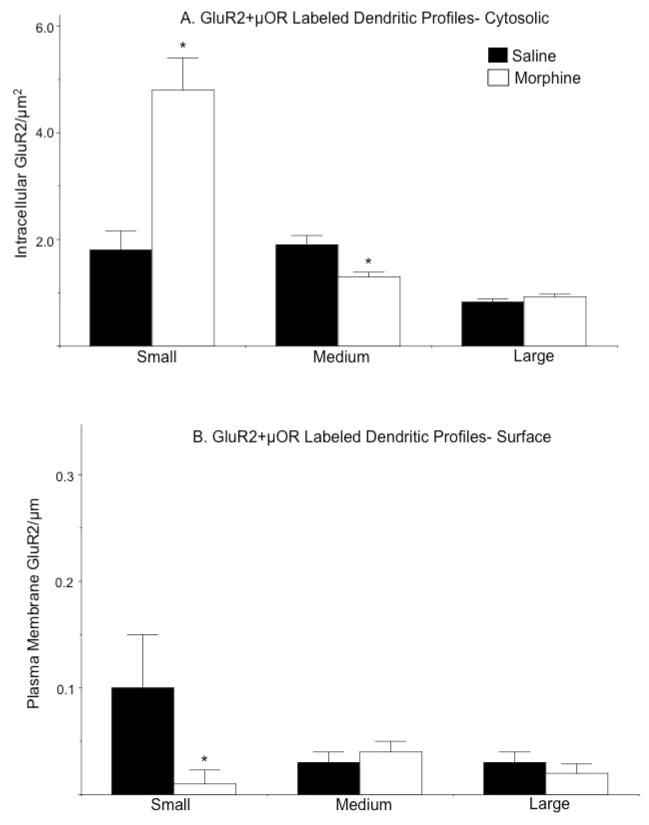
In small dual labeled profiles there was a significant shift in the distribution of GluR2: an increase in the density of cytoplasmic labeling [F(1, 35)= 10, p<0.005; Fig. 9A] coupled with a decrease in surface labeling [F(1, 35)= 5.8, p<0.05; Fig. 9B]. There were also lower levels of intracellular GluR2 in intermediate dual labeled dendrites [F(1, 123)= 8.3, p<0.005], but no difference in surface density [F(1, 123)= 0.2, p>0.4] in the two groups of mice. There were no between-group differences in the density of intracellular [F(1, 91)= 1.2, p>0.2] or plasma membrane [F(1, 91)= 0.2, p>0.5] GluR2 in large dual labeled dendritic profiles.
Figure 9. Exposure to morphine is associated with increased cytoplasmic and decreased surface GluR2 in dendrites also showing μOR labeling.
(A). Small dual labeled dendritic profiles of CeA neurons from morphine treated animals show significantly higher levels of intracellular GluR2 compared to mice given saline. (B). The density of plasma membrane GluR2 labeling is significantly lower in small dual dendritic profiles from CeA neurons of mice administered morphine compared to animals treated with saline. Significant differences in GluR2 labeling were only found in small dendritic profiles. *p<.0.05 in morphine compared to saline treated mice by Fisher’s PLSD.
Acute morphine does not impact the distribution of NR1
The ultrastructural distribution of the NR1 subunit was examined in μOR and non-μOR expressing dendritic processes of CeA neurons in mice given acute saline or morphine. Using tissue from the same animals used in the studies above, forebrain sections containing the CeA were processed for IGS and IP labeling of NR1 and μOR, respectively. A total of 360 fields from 21,780 μm2 of tissue were sampled. There were no significant between-group differences in the cross-sectional [F(1, 501)= 3.5, p>0.05] or surface [F(1, 501)= 2.7, p>0.05] areas, minor [F(1, 501)= 1.2, p>0.2] axis length, or the ratio of major to minor axes [F(1, 501)= 0.03, p>0.8]. In addition, there were no interanimal differences in total gold particles [F(8, 511)= 0.4, p>0.8] in profiles other than dendrites (somata, axons, axon terminals).
Collapsed across all dendritic profiles, there were no differences in the density of total [F(1, 501)= 2.4, p>0.1], intracellular [F(1, 501)= 2.0, p>0.1], or plasma membrane [F(1, 501)= 0.1, p>0.7] NR1 labeling. Dendritic profiles were segregated by size and labeling status. Irrespective of size or labeling type, there were no significant differences in intracellular or surface NR1 labeling (Table 1).
Table 1.
Distribution of NR1 in single and dual labeled dendritic profiles in the CeA of mice injected with saline or morphine
| Profile Type | Saline | Morphine | Saline | Morphine |
|---|---|---|---|---|
| Small | NR1 | NR1 | NR1+μOR | NR1+μOR |
| NR1 cytosolic particles/area (μm2) | 2.9±0.5 | 3.1±0.3 | 2.5±0.4 | 2.3±0.3 |
| NR1 surface particles/area (μm) | 0.046±0.04 | 0.047±0.03 | 0.06±0.04 | 0.05±0.04 |
| Intermediate | ||||
| NR1 cytosolic particles/area (μm2) | 1.4±0.13 | 1.7±0.09 | 1.7±0.1 | 1.7±0.1 |
| NR1 surface particles/area (μm) | 0.04±0.02 | 0.047±0.01 | 0.04±0.01 | 0.022±0.01 |
| Large | ||||
| NR1 cytoplasmic particles/area (μm2) | 0.85±0.1 | 0.88±0.1 | 1.0±0.1 | 1.0±0.1 |
| NR1 surface particles/area (μm) | 0.03±0.02 | 0.03±0.02 | 0.03±0.01 | 0.04±0.01 |
Data are presented as mean ± SEM for intracellular and plasma membrane NR1 densities
DISCUSSION
This study is the first to report that, in opiate naive mice, GluR1 and μOR are co-expressed in somata and dendritic profiles of neurons in the CeA. The presence of GluR1 and μOR in common dendritic profiles resembled previous descriptions of the NR1 (Beckerman and Glass 2012; Glass et al. 2009) and GluR2 (Beckerman and Glass 2011) receptor subunits in CeA neurons, and, taken together, suggests that diverse ionotropic receptors are expressed in opioid responsive CeA neurons. In addition, the present study is also the first to report that acute morphine is associated with changes in the distribution of GluR1 in a manner that both compares and contrasts with morphine’s effect on other key ionotropic glutamate receptor subunits (i.e. GluR2 and NR1). Differences in the subcellular location of GluR1 and GluR2 occurred in dendrites without concomitant μOR labeling, and only in a subpopulation of GluR2 expressing dendritic profiles did alterations in protein location correlate with μOR expression. Morphine was not associated with any changes in the location of NR1. These findings suggest that the ultrastructural distribution of AMPA receptor subunits in CeA neurons is altered in response to systemic opiate administration. These changes, however, need not involve direct postsynaptic interactions with μOR, but instead, may reflect the indirect upstream actions of opiates on glutamate release, or some other related signaling event that can impact the subcellular location of glutamate receptors.
Methodological Considerations
AMPA receptors can exist as homo- and/or heteromers of GluR1, GluR2, or other subunits, however, the antisera used in this study do not discriminate between these various receptor configurations. The relative abundance of AMPA receptor composition is a generally contentious issue (Reimers et al. 2011), and estimates in the CeA are lacking. Any changes in heteromeric receptor location may be revealed by parallel changes in both GluR1 and GluR2 with respect to the magnitude and direction (higher, lower) of changes, and these effects should occur in the same size and type of profile (μOR+, or μOR−). These criteria were only met in the case of large single labeled dendritic profiles (as discussed below), however, whether or not this pattern of change reflects heteromeric GluR1-GluR2 proteins cannot be ascertained at present.
The subcellular distribution of GluR1 is affected by acute morphine administration
Changes in the expression (Ren et al. 2009; Scheggi et al. 2004; Zhong et al. 2006), phosphorylation state (Billa et al. 2009; Edwards et al. 2009), and subcellular location (Glass et al. 2008b; Lane et al. 2008) of GluR1 have each been shown to be associated with exposure to opiates or opiate seeking behaviors. In the present study, it was found that, compared to mice receiving saline, mice given morphine showed a general decrease in the density of intracellular GluR1 in single labeled dendritic profiles. These changes were not seen in somata, axons, or axon terminals, nor did they occur in GluR1 profiles that also expressed labeling for μOR. The reduction of labeling may be the result of protein modifications that impair antisera binding, and/or an increase in protein degradation pathways. Although there was a decrease in the overall density of cytoplasmic GluR1, there was no change in the overall density of surface protein. When apportioning dendrites by size, we found a lower density of plasma membrane GluR1 in small dendrites, coupled with the concomitant increase in larger profiles. This pattern is indicative of a reapportionment of GluR1 resulting in reduced levels in distal sites with an increase in proximal regions.
The present results differ from a prior report that the distribution of GluR1 was not impacted in the CeA of rats self-administering escalating doses of morphine (Glass et al. 2005). In addition, the present findings also contrast with reports of a general increase in surface GluR1 in tyrosine hydroxylase (TH) and non-TH containing dendritic profiles in the ventral tegmental area (VTA) of rats given a single injection of morphine (Lane et al. 2008). The contrasting findings between the present and latter studies may be the result of brain regional differences in the sensitivity of GluR1 to acute opiate exposure, as in the VTA, or, in the case of the CeA, experimental differences in the dosage, timing, or route of morphine administration, in addition to control of drug administration (i.e. subject, experimenter) or variations in species (mouse versus rat). It is also possible that the contrasting results seen in the CeA of acutely and chronically treated mice reflects some form of “tolerance” to repeated opiate exposure.
Acute morphine administration influences the subcellular distribution of GluR2
Changes in the distribution of GluR2 have been reported after exposure to opiates (Zhong et al. 2006) and opiate seeking behaviors (Van den Oever et al. 2008), and experience-related alterations in the cellular distribution of GluR2 has been implicated in learned behaviors implicated in relapse (Li et al. 2011; Van den Oever et al. 2008). In the present study, acute morphine administration was associated with alterations in the localization of GluR2 in dendritic profiles, changes that were dependent on dendritic profile size as well as the presence or absence of μOR. In single GluR2 labeled dendrites, there was a notable shift in the location of GluR2; decreases were seen in the intracellular compartment and increases on the surface membrane, but these were only shown to occur at statistically significant levels in small and large profiles, respectively. A different pattern was seen in GluR2 containing dendrites that also expressed μOR: there was an increase in intracellular GluR2 and a concomitant decrease in surface labeling in small profiles.
Despite the apparently complex nature of morphine’s effects on GluR1 and GluR2 localization, general patterns may, nonetheless, be discerned. In the case of single labeled profiles, whether GluR1 or GluR2, there was an increase in surface labeling in large dendritic profiles (Fig. 10). Since surface labeling most likely reflects the detection of potentially functional receptors, these results indicate an elevation in the potential for receptor activation on dendritic areas proximal to the soma. Along similar lines, the decrease in surface or cytoplasmic GluR1 and GluR2 in small dendritic profiles, respectively, would indicate a decrease in the activation potential in distal dendrites. Taken together, these results suggest a rebalancing of both GluR1 and GluR2 from distal to proximal dendritic areas, and a diminution and elevation, respectively, in the potential for activation of each population of receptors in distinct dendritic compartments. Moreover, these changes were particularly prominent in dendritic profiles that did not express μOR labeling. This finding suggests that the effect of morphine on GluR localization is not directly related to μOR activation in this population of dendrites, but may reflect opiate actions on glutamate neurons presynaptic to them.
Figure 10. Summary of morphine’s impact on AMPA receptor subunit localization.
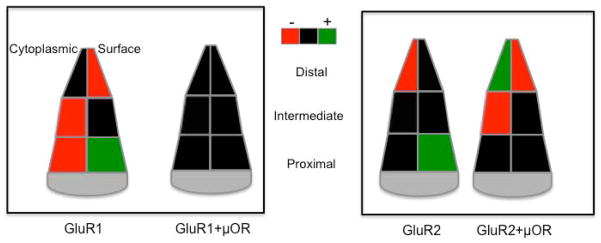
Schematic representation depicting differences in the subcellular distribution of AMPA receptor subunits (GluR1, GluR2) in dendritic profiles of CeA neurons from morphine administered mice. Differences in the density of cytoplasmic (left) and surface (right) labeling are portrayed in dendrites that are presumably distal, intermediate, and proximal in distance from the soma, based on size criteria. Decreases are indicated by red fill, increases by green, whereas black fill denotes instances where differences between treatment groups were not significantly detected. Differences are presented with respect to saline treatment.
NR1 localization and acute morphine administration
There is extensive evidence that functional NMDA receptors play a critical role in many of the behavioral effects of acute and chronic opiate exposure (Glass 2011). In addition, repeated opiate exposure has also been reported to influence the cellular distribution of NR1 in brain areas other than the CeA (Glass et al. 2004; Tai et al. 2010). In the present study, acute administration of morphine did not impact the distribution of NR1 in dendritic profiles expressing μOR, nor in exclusively NR1 labeled profiles. These results indicate that the impact of morphine on the subcellular distribution of the NMDA receptor is circumscribed by the pattern or duration of opiate administration, and, possibly, brain site-specific sensitivities of NMDA receptors to opiates.
Functional implications of acute morphine related alterations in ionotropic glutamate receptor localization
Opioid dependent behavioral adaptations can be seen in response to acute administration (Eisenberg and Sparber 1979; Gold et al. 1994; White et al. 2005). Although these effects suggest some form of experience dependent modifications in neural signaling, the neurobiological mechanisms mediating them are unknown. Experience-dependent changes in the cellular location of glutamate receptors has been implicated in many forms of neural plasticity at the cellular level (Henley et al. 2011; van der Sluijs and Hoogenraad 2011) even over short time periods. The present study provides evidence suggesting that significant changes in the subcellular location of AMPA receptors can occur following a single morphine injection, thus providing an ultrastructural basis for alterations in glutamate signaling in the CeA by acute morphine.
The finding that morphine is associated with changes in AMPA receptor subunit localization in select subpopulations of dendrites (e.g. distal vs proximal) is consistent with other data showing that receptor mobility induced by synaptic activity can occur in spatially restricted functional domains including synapses formed by particular afferents (Humeau et al. 2007; Zhu 2009), select morphological species of dendritic spines (Humeau et al. 2005; Matsuo et al. 2008), or specific activated synaptic inputs (Kakegawa et al. 2004; Kielland et al. 2009). These events may be critical in coordinating synaptic strength and dendrite and/or spine size (Kopec et al. 2007; Zhou et al. 2008), which, in turn, may be critical in dendritic computational processes (Branco and Hausser 2010). Dendrites are a principal integrating unit of synaptic inputs, and the processing of this information is related to several dendritic properties including morphology (Hausser et al. 2000), the density of excitatory versus inhibitory synapses (Williams and Stuart 2003), distance (distal, proximal) from the cell body (Jang et al. 2011), and glutamate receptor levels (Williams and Stuart 2002). Any change in the density of surface or intracellular receptors in a particular dendritic compartment would, therefore, be expected to alter ongoing or future neural integration (Branco and Hausser 2010; London and Hausser 2005). Since proximal dendrites are strategically located as an interface between distal dendrites and the cell body, and play a key role in the integration of inputs (Sjostrom et al. 2008), a shift in the relative location of surface GluR’s away from distal and toward proximal dendritic compartments, as occurred with systemic morphine exposure, would be expected to have an impact on the local dendritic processing of glutamate inputs and/or glutamate/GABA integration, and ultimately the output of these neurons.
Acknowledgments
Supported by DA-027128 and DA-024030
References
- Aicher SA, Sharma S, Mitchell JL. Co-localization of AMPA receptor subunits in the nucleus of the solitary tract in the rat. Brain Res. 2002;958:454–8. doi: 10.1016/s0006-8993(02)03693-4. [DOI] [PubMed] [Google Scholar]
- Beckerman MA, Glass MJ. Ultrastructural relationship between the AMPA-GluR2 receptor subunit and the mu-opioid receptor in the mouse central nucleus of the amygdala. Exp Neurol. 2011;227:149–158. doi: 10.1016/j.expneurol.2010.10.010. [DOI] [PMC free article] [PubMed] [Google Scholar]
- Beckerman MA, Glass MJ. The NMDA-NR1 receptor subunit and the mu-opioid receptor are expressed in somatodendritic compartments of central nucleus of the amygdala neurons projecting to the bed nucleus of the stria terminalis. Exp Neurol. 2012;234:112–126. doi: 10.1016/j.expneurol.2011.12.034. [DOI] [PMC free article] [PubMed] [Google Scholar]
- Billa SK, Liu J, Bjorklund NL, Sinha N, Fu Y, Shinnick-Gallagher P, Moron JA. Increased insertion of glutamate receptor 2-lacking alpha-amino-3-hydroxy-5-methyl-4-isoxazole propionic acid (AMPA) receptors at hippocampal synapses upon repeated morphine administration. Mol Pharmacol. 2010;77:874–83. doi: 10.1124/mol.109.060301. [DOI] [PMC free article] [PubMed] [Google Scholar]
- Billa SK, Sinha N, Rudrabhatla SR, Moron JA. Extinction of morphine-dependent conditioned behavior is associated with increased phosphorylation of the GluR1 subunit of AMPA receptors at hippocampal synapses. Eur J Neurosci. 2009;29:55–64. doi: 10.1111/j.1460-9568.2008.06560.x. [DOI] [PMC free article] [PubMed] [Google Scholar]
- Branco T, Hausser M. The single dendritic branch as a fundamental functional unit in the nervous system. Curr Opin Neurobiol. 2010;20:494–502. doi: 10.1016/j.conb.2010.07.009. [DOI] [PubMed] [Google Scholar]
- Cull-Candy S, Kelly L, Farrant M. Regulation of Ca2+-permeable AMPA receptors: synaptic plasticity and beyond. Curr Opin Neurobiol. 2006;16:288–97. doi: 10.1016/j.conb.2006.05.012. [DOI] [PubMed] [Google Scholar]
- Cullinan WE, Herman JP, Watson SJ. Ventral subicular interaction with the hypothalamic paraventricular nucleus: evidence for a relay in the bed nucleus of the stria terminalis. J Comp Neurol. 1993;332:1–20. doi: 10.1002/cne.903320102. [DOI] [PubMed] [Google Scholar]
- Drake CT, Milner TA. Mu opioid receptors are in discrete hippocampal interneuron subpopulations. Hippocampus. 2002;12:119–36. doi: 10.1002/hipo.1107. [DOI] [PubMed] [Google Scholar]
- Edwards S, Graham DL, Whisler KN, Self DW. Phosphorylation of GluR1, ERK, and CREB during spontaneous withdrawal from chronic heroin self-administration. Synapse. 2009;63:224–35. doi: 10.1002/syn.20601. [DOI] [PMC free article] [PubMed] [Google Scholar]
- Eisenberg RM. Further studies on the acute dependence produced by morphine in opiate naive rats. Life Sci. 1982;31:1531–40. doi: 10.1016/0024-3205(82)90043-1. [DOI] [PubMed] [Google Scholar]
- Eisenberg RM, Sparber SB. Changes in plasma corticosterone levels as a measure of acute dependence upon levorphanol in rats. J Pharmacol Exp Ther. 1979;211:364–9. [PubMed] [Google Scholar]
- Fisk GD, Wyss JM. Descending projections of infralimbic cortex that mediate stimulation-evoked changes in arterial pressure. Brain Res. 2000;859:83–95. doi: 10.1016/s0006-8993(00)01935-1. [DOI] [PubMed] [Google Scholar]
- Glass MJ. The role of functional postsynaptic NMDA receptors in the central nucleus of the amygdala in opioid dependence. Vitam Horm. 2010;82:145–66. doi: 10.1016/S0083-6729(10)82008-4. [DOI] [PMC free article] [PubMed] [Google Scholar]
- Glass MJ. Opioid dependence and NMDA receptors. ILAR Journal. 2011;52:342–51. doi: 10.1093/ilar.52.3.342. [DOI] [PubMed] [Google Scholar]
- Glass MJ, Hegarty DM, Oselkin M, Quimson L, SMS, Xu Q, Pickel VM, Inturrisi CE. Conditional deletion of the NMDA-NR1 receptor subunit gene in the central nucleus of the amygdala inhibits naloxone-induced conditioned place aversion in morphine dependent mice. Exp Neurol. 2008a;213:57–70. doi: 10.1016/j.expneurol.2008.04.045. [DOI] [PMC free article] [PubMed] [Google Scholar]
- Glass MJ, Kruzich PJ, Colago EE, Kreek MJ, Pickel VM. Increased AMPA GluR1 receptor subunit labeling on the plasma membrane of dendrites in the basolateral amygdala of rats self-administering morphine. Synapse. 2005;58:1–12. doi: 10.1002/syn.20176. [DOI] [PubMed] [Google Scholar]
- Glass MJ, Kruzich PJ, Kreek M, Pickel VM. Decreased plasma membrane targeting of NMDA-NR1 receptor subunit in dendrites of medial nucleus tractus solitarius neurons in rats self-administering morphine. Synapse. 2004;53:191–201. doi: 10.1002/syn.20049. [DOI] [PubMed] [Google Scholar]
- Glass MJ, Lane DA, Chan J, Schlussman SD, Zhou Y, Kreek MJ, Pickel VM. Chronic administration of morphine is associated with a decrease in surface AMPA GluR1 receptor subunit in dopamine D1 receptor expressing neurons in the shell and non-D1 receptor expressing neurons in the core of the rat nucleus accumbens. Exp Neurol. 2008b;210:750–761. doi: 10.1016/j.expneurol.2008.01.012. [DOI] [PMC free article] [PubMed] [Google Scholar]
- Glass MJ, Vanyo L, Quimson L, Pickel VM. Ultrastructural relationship between NMDA-NR1 and mu-opioid receptor in the mouse central nucleus of the amygdala. Neurosci. 2009;163:857–67. doi: 10.1016/j.neuroscience.2009.07.020. [DOI] [PMC free article] [PubMed] [Google Scholar]
- Gold LH, Stinus L, Inturrisi CE, Koob GF. Prolonged tolerance, dependence and abstinence following subcutaneous morphine pellet implantation in the rat. Eur J Pharmacol. 1994;253:45–51. doi: 10.1016/0014-2999(94)90755-2. [DOI] [PubMed] [Google Scholar]
- Hara Y, Pickel VM. Preferential relocation of the N-methyl-D-aspartate receptor NR1 subunit in nucleus accumbens neurons that contain dopamine D1 receptors in rats showing an apomorphine-induced sensorimotor gating deficit. Neurosci. 2008;154:965–77. doi: 10.1016/j.neuroscience.2008.04.009. [DOI] [PMC free article] [PubMed] [Google Scholar]
- Hausser M, Spruston N, Stuart GJ. Diversity and dynamics of dendritic signaling. Science. 2000;290:739–44. doi: 10.1126/science.290.5492.739. [DOI] [PubMed] [Google Scholar]
- Henley JM, Barker EA, Glebov OO. Routes, destinations and delays: recent advances in AMPA receptor trafficking. Trends Neurosci. 2011;34:258–68. doi: 10.1016/j.tins.2011.02.004. [DOI] [PMC free article] [PubMed] [Google Scholar]
- Humeau Y, Herry C, Kemp N, Shaban H, Fourcaudot E, Bissiere S, Luthi A. Dendritic spine heterogeneity determines afferent-specific Hebbian plasticity in the amygdala. Neuron. 2005;45:119–31. doi: 10.1016/j.neuron.2004.12.019. [DOI] [PubMed] [Google Scholar]
- Humeau Y, Reisel D, Johnson AW, Borchardt T, Jensen V, Gebhardt C, Bosch V, Gass P, Bannerman DM, Good MA, Hvalby O, Sprengel R, Luthi A. A pathway-specific function for different AMPA receptor subunits in amygdala long-term potentiation and fear conditioning. J Neurosci. 2007;27:10947–56. doi: 10.1523/JNEUROSCI.2603-07.2007. [DOI] [PMC free article] [PubMed] [Google Scholar]
- Jang M, Jang JY, Kim SH, Uhm KB, Kang YK, Kim HJ, Chung S, Park MK. Functional organization of dendritic Ca2+ signals in midbrain dopamine neurons. Cell Calcium. 2011;50:370–80. doi: 10.1016/j.ceca.2011.06.007. [DOI] [PubMed] [Google Scholar]
- June HL, Stitzer ML, Cone E. Acute physical dependence: time course and relation to human plasma morphine concentrations. Clin Pharmacol Ther. 1995;57:270–280. doi: 10.1016/0009-9236(95)90152-3. [DOI] [PubMed] [Google Scholar]
- Kakegawa W, Tsuzuki K, Yoshida Y, Kameyama K, Ozawa S. Input- and subunit-specific AMPA receptor trafficking underlying long-term potentiation at hippocampal CA3 synapses. Eur J Neurosci. 2004;20:101–10. doi: 10.1111/j.1460-9568.2004.03461.x. [DOI] [PubMed] [Google Scholar]
- Kielland A, Bochorishvili G, Corson J, Zhang L, Rosin DL, Heggelund P, Zhu JJ. Activity patterns govern synapse-specific AMPA receptor trafficking between deliverable and synaptic pools. Neuron. 2009;62:84–101. doi: 10.1016/j.neuron.2009.03.001. [DOI] [PMC free article] [PubMed] [Google Scholar]
- Kishi T, Tsumori T, Yokota S, Yasui Y. Topographical projection from the hippocampal formation to the amygdala: a combined anterograde and retrograde tracing study in the rat. J Comp Neurol. 2006;496:349–68. doi: 10.1002/cne.20919. [DOI] [PubMed] [Google Scholar]
- Knapska E, Radwanska K, Werka T, Kaczmarek L. Functional internal complexity of amygdala: focus on gene activity mapping after behavioral training and drugs of abuse. Physiol Rev. 2007;87:1113–73. doi: 10.1152/physrev.00037.2006. [DOI] [PubMed] [Google Scholar]
- Kopec CD, Real E, Kessels HW, Malinow R. GluR1 links structural and functional plasticity at excitatory synapses. J Neurosci. 2007;27:13706–18. doi: 10.1523/JNEUROSCI.3503-07.2007. [DOI] [PMC free article] [PubMed] [Google Scholar]
- Lane DA, Lessard AA, Chan J, Colago EE, Zhou Y, Schlussman SD, Kreek MJ, Pickel VM. Region-specific changes in the subcellular distribution of AMPA receptor GluR1 subunit in the rat ventral tegmental area after acute or chronic morphine administration. J Neurosci. 2008;28:9670–81. doi: 10.1523/JNEUROSCI.2151-08.2008. [DOI] [PMC free article] [PubMed] [Google Scholar]
- Lang PJ, Davis M. Emotion, motivation, and the brain: reflex foundations in animal and human research. Prog Brain Res. 2006;156:3–29. doi: 10.1016/S0079-6123(06)56001-7. [DOI] [PubMed] [Google Scholar]
- Lapray D, Lasztoczi B, Lagler M, Viney TJ, Katona L, Valenti O, Hartwich K, Borhegyi Z, Somogyi P, Klausberger T. Behavior-dependent specialization of identified hippocampal interneurons. Nat Neurosci. 2012;15:1265–71. doi: 10.1038/nn.3176. [DOI] [PMC free article] [PubMed] [Google Scholar]
- LeDoux JE. Emotion circuits in the brain. Ann Rev Neurosci. 2000;23:155–184. doi: 10.1146/annurev.neuro.23.1.155. [DOI] [PubMed] [Google Scholar]
- Li YQ, Xue YX, He YY, Li FQ, Xue LF, Xu CM, Sacktor TC, Shaham Y, Lu L. Inhibition of PKMzeta in nucleus accumbens core abolishes long-term drug reward memory. J Neurosci. 2011;31:5436–46. doi: 10.1523/JNEUROSCI.5884-10.2011. [DOI] [PMC free article] [PubMed] [Google Scholar]
- London M, Hausser M. Dendritic computation. Annual Rev Neurosci. 2005;28:503–32. doi: 10.1146/annurev.neuro.28.061604.135703. [DOI] [PubMed] [Google Scholar]
- Matsuo N, Reijmers L, Mayford M. Spine-type-specific recruitment of newly synthesized AMPA receptors with learning. Science. 2008;319:1104–7. doi: 10.1126/science.1149967. [DOI] [PMC free article] [PubMed] [Google Scholar]
- McDonald AJ. Cortical pathways to the mammalian amygdala. Prog Neurobiol. 1998;55:257–332. doi: 10.1016/s0301-0082(98)00003-3. [DOI] [PubMed] [Google Scholar]
- Milner TA, Waters EM, Robinson DC, Pierce JP. Degenerating processes identified by electron microscpic immunocytochemical methods. In: Manfredi G, Kawamata H, editors. Neurodegeneration, Methods and Protocols. Springer; New York: 2011. pp. 23–59. [Google Scholar]
- Paxinos G, Franklin KB. The mouse brain in stereotaxic coordinates. Academic Press; Academic Press: 2000. [Google Scholar]
- Peters A, Palay SL, Webster H. The fine structure of the nervous system. Oxford University Press; Oxford University Press: 1991. [Google Scholar]
- Petralia RS, Wenthold RJ. Light and electron immunocytochemical localization of AMPA-selective glutamate receptors in the rat brain. J Comp Neurol. 1992;318:329–54. doi: 10.1002/cne.903180309. [DOI] [PubMed] [Google Scholar]
- Pitkanen A, Savander V, LeDoux JE. Organization of intra-amygdaloid circuitries in the rat: an emerging framework for understanding functions of the amygdala. Trends in Neurosci. 1997;20:517–23. doi: 10.1016/s0166-2236(97)01125-9. [DOI] [PubMed] [Google Scholar]
- Reimers JM, Milovanovic M, Wolf ME. Quantitative analysis of AMPA receptor subunit composition in addiction-related brain regions. Brain Res. 2011;1367:223–33. doi: 10.1016/j.brainres.2010.10.016. [DOI] [PMC free article] [PubMed] [Google Scholar]
- Reissner KJ, Kalivas PW. Using glutamate homeostasis as a target for treating addictive disorders. Behav Pharmacol. 2010;21:514–522. doi: 10.1097/FBP.0b013e32833d41b2. [DOI] [PMC free article] [PubMed] [Google Scholar]
- Ren Y, Whittard J, Higuera-Matas A, Morris CV, Hurd YL. Cannabidiol, a nonpsychotropic component of cannabis, inhibits cue-induced heroin seeking and normalizes discrete mesolimbic neuronal disturbances. J Neurosci. 2009;29:14764–9. doi: 10.1523/JNEUROSCI.4291-09.2009. [DOI] [PMC free article] [PubMed] [Google Scholar]
- Ritzmann RF. Opiate dependence following acute injections of morphine and naloxone: the assessment of various withdrawal signs. Pharmacol Biochemi Behav. 1981;14:575–7. doi: 10.1016/0091-3057(81)90320-8. [DOI] [PubMed] [Google Scholar]
- Rogers SW, Hughes TE, Hollmann M, Gasic GP, Deneris ES, Heinemann S. The characterization and localization of the glutamate receptor subunit GluR1 in the rat brain. J Neurosci. 1991;11:2713–24. doi: 10.1523/JNEUROSCI.11-09-02713.1991. [DOI] [PMC free article] [PubMed] [Google Scholar]
- Scheggi S, Rauggi R, Gambarana C, Tagliamonte A, De Montis MG. Dopamine and cyclic AMP-regulated phosphoprotein-32 phosphorylation pattern in cocaine and morphine-sensitized rats. J Neurochem. 2004;90:792–9. doi: 10.1111/j.1471-4159.2004.02510.x. [DOI] [PubMed] [Google Scholar]
- Schwenk J, Harmel N, Brechet A, Zolles G, Berkefeld H, Muller CS, Bildl W, Baehrens D, Huber B, Kulik A, Klocker N, Schulte U, Fakler B. High-resolution proteomics unravel architecture and molecular diversity of native AMPA receptor complexes. Neuron. 2012;74:621–33. doi: 10.1016/j.neuron.2012.03.034. [DOI] [PubMed] [Google Scholar]
- Sjostrom PJ, Rancz EA, Roth A, Hausser M. Dendritic excitability and synaptic plasticity. Physiol Rev. 2008;88:769–840. doi: 10.1152/physrev.00016.2007. [DOI] [PubMed] [Google Scholar]
- Tai YH, Cheng PY, Tsai RY, Chen YF, Wong CS. Purinergic P2X receptor regulates N-methyl-D-aspartate receptor expression and synaptic excitatory amino acid concentration in morphine-tolerant rats. Anesthesiol. 2010;113:1163–75. doi: 10.1097/ALN.0b013e3181f11aa2. [DOI] [PubMed] [Google Scholar]
- Turner BH, Herkenham M. Thalamoamygdaloid projections in the rat: a test of the amygdala’s role in sensory processing. J Comp Neurol. 1991;313:295–325. doi: 10.1002/cne.903130208. [DOI] [PubMed] [Google Scholar]
- Van den Oever MC, Goriounova NA, Li KW, Van der Schors RC, Binnekade R, Schoffelmeer AN, Mansvelder HD, Smit AB, Spijker S, De Vries TJ. Prefrontal cortex AMPA receptor plasticity is crucial for cue-induced relapse to heroin-seeking. Nature Neurosci. 2008;11:1053–8. doi: 10.1038/nn.2165. [DOI] [PubMed] [Google Scholar]
- van der Sluijs P, Hoogenraad CC. New insights in endosomal dynamics and AMPA receptor trafficking. Semin Cell Dev Biol. 2011;22:499–505. doi: 10.1016/j.semcdb.2011.06.008. [DOI] [PubMed] [Google Scholar]
- Wang H, Cuzon VC, Pickel VM. Postnatal development of mu-opioid receptors in the rat caudate-putamen nucleus parallels asymmetric synapse formation. Neurosci. 2003;118:695–708. doi: 10.1016/s0306-4522(02)00926-0. [DOI] [PubMed] [Google Scholar]
- White DA, Hwang ML, Holtzman SG. Naltrexone-induced conditioned place aversion following a single dose of morphine in the rat. Pharmacol Biochem Behav. 2005;81:451–8. doi: 10.1016/j.pbb.2005.04.002. [DOI] [PubMed] [Google Scholar]
- Williams SR, Stuart GJ. Dependence of EPSP efficacy on synapse location in neocortical pyramidal neurons. Science. 2002;295:1907–10. doi: 10.1126/science.1067903. [DOI] [PubMed] [Google Scholar]
- Williams SR, Stuart GJ. Role of dendritic synapse location in the control of action potential output. Trends in Neurosci. 2003;26:147–54. doi: 10.1016/S0166-2236(03)00035-3. [DOI] [PubMed] [Google Scholar]
- Zhong W, Dong Z, Tian M, Cao J, Xu T, Xu L, Luo J. Opiate withdrawal induces dynamic expressions of AMPA receptors and its regulatory molecule CaMKIIalpha in hippocampal synapses. Life Sci. 2006;79:861–9. doi: 10.1016/j.lfs.2006.02.040. [DOI] [PubMed] [Google Scholar]
- Zhou W, Zhang L, Guoxiang X, Mojsilovic-Petrovic J, Takamaya K, Sattler R, Huganir R, Kalb R. GluR1 controls dendrite growth through its binding partner, SAP97. J Neurosci. 2008;28:10220–33. doi: 10.1523/JNEUROSCI.3434-08.2008. [DOI] [PMC free article] [PubMed] [Google Scholar]
- Zhu JJ. Activity level-dependent synapse-specific AMPA receptor trafficking regulates transmission kinetics. J Neurosci. 2009;29:6320–35. doi: 10.1523/JNEUROSCI.4630-08.2009. [DOI] [PMC free article] [PubMed] [Google Scholar]


