Abstract
The liver has been shown to be a primary target organ for SiO2 nanoparticles in vivo, and may be highly susceptible to damage by these nanoparticles. However, until now, research focusing on the potential toxic effects of SiO2 nanoparticles on mitochondria-associated energy metabolism in hepatocytes has been lacking. In this work, SiO2 nanoparticles 20 nm in diameter were evaluated for their ability to induce dysfunction of mitochondrial energy metabolism. First, a buffalo rat liver (BRL) cell line was directly exposed to SiO2 nanoparticles, which induced cytotoxicity and mitochondrial damage accompanied by decreases in mitochondrial dehydrogenase activity, mitochondrial membrane potential, enzymatic expression in the Krebs cycle, and activity of the mitochondrial respiratory chain complexes I, III and IV. Second, the role of rat-derived Kupffer cells was evaluated. The supernatants from Kupffer cells treated with SiO2 nanoparticles were transferred to stimulate BRL cells. We observed that SiO2 nanoparticles had the ability to activate Kupffer cells, leading to release of tumor necrosis factor-α, nitric oxide, and reactive oxygen species from these cells and subsequently to inhibition of mitochondrial respiratory chain complex I activity in BRL cells.
Keywords: SiO2 nanoparticles, mitochondria-associated energy metabolism, buffalo rat liver cells, Kupffer cells
Introduction
SiO2 nanoparticles, which have diameters of less than 100 nm, are widely used in the biomedical and biotechnological fields, including applications as drug carriers, in gene therapy, in molecular imaging, and as biosensors.1–3 In previous studies, the liver, which is the major organ involved in biotransformation of toxins, has been shown to be a primary target for SiO2 nanoparticles in vivo. Xie et al4 reported that once injected intravenously, SiO2 nanoparticles, especially those with a diameter of 20 nm, can accumulate in the liver and be retained there for at least 30 days. Similarly, Cho et al5 described how nanosized SiO2 particles (50 nm, 100 nm, and 200 nm) aggregated and caused acute inflammation in the liver. In a chronic toxicity study, Nishimori et al6 found that administration of nanoparticles with a diameter of 70 nm induced elevated serum alanine aminotransferase levels in blood and liver fibrosis, among other effects. In in vitro systems, SiO2 nanoparticles with diameters of 20–80 nm have been shown to induce apoptosis via activation of p53, Bax, and Bcl-2, all of which are involved in the mitochondrial-dependent pathway in certain cell lines, including human hepatocytes and human lung fibroblasts.7–9 Upregulation of Bax and downregulation of Bcl-2 can promote mitochondrial membrane permeability and subsequently disturb normal mitochondrial function.10 Thus, whether these potential toxic effects of SiO2 nanoparticles can influence mitochondria-associated energy metabolism is of great interest.
Hepatocytes are closely involved in the metabolic process. In energy metabolism, the mitochondria, which are most populous in hepatocytes, play a critical role in supplying energy to support cellular function in organs and tissues. The Krebs cycle takes place in the mitochondrial matrix, generating the reducing equivalents (NADH and FADH2), which then enter the oxidative phosphorylation pathway, producing electrons transferred through the mitochondrial respiratory chain complexes I to IV located in the inner membrane, driving synthesis of adenosine triphosphate. To date, there have been a limited number of studies published that mention the potential impact of direct cell exposure to SiO2 nanoparticles in the mitochondria. For example, Lu et al11 found that amino acid metabolism, lipid metabolism, and nucleotide metabolism were disturbed in the serum of mice injected intravenously with SiO2 nanoparticles 30, 70, or 300 nm in diameter, along with decreased fumarate, α-ketoglutarate, and malate in the Krebs cycle. Another study of magnetic nanoparticles coated with SiO2 reported that these nanoparticles could disturb the metabolic pathway for glutamic acid and disturb certain organic acids related to the Krebs cycle.12 However, none of the above-mentioned investigations focused on the mitochondria or mitochondria-associated energy metabolism, in particular the Krebs cycle and the oxidative phosphorylation pathway. Therefore, the effect of SiO2 nanoparticles on the mitochondria and mitochondria-associated energy production is still a topic requiring more research attention.
Kupffer cells (KCs) are the resident macrophages in the liver. They are phagocytic and ingest substances to provide the first line of defense against invading particles.13 Previous experimental evidence, including our own, demonstrates that KCs are critical for endocytosis and retention of SiO2 nanoparticles in the liver; this retention prolongs the interaction between the nanoparticles and hepatic tissues.4–6 On activation, KCs are capable of releasing various molecules, including tumor necrosis factor-α (TNF-α), nitric oxide (NO), reactive oxygen species (ROS), and interleukin-1β (IL-1β), which play important roles in liver injury and hepatocellular necrosis.14,15 However, until now, the potential toxic effects of SiO2 nanoparticles on mitochondrial function in hepatocytes mediated by KCs has been unknown.
In the present study, we investigated the role of SiO2 nanoparticles in inducing mitochondrial injury and impairment of mitochondrial energy metabolism in hepatocytes directly and via a KC-mediated pathway in vitro. We utilized SiO2 nanoparticles 20 nm in diameter, with micrometer SiO2 particles as the control. After hepatocytes were exposed to the SiO2 nanoparticles, we performed a series of measurements to define their impact on mitochondrial morphology and mitochondrial energy metabolism. In addition to studying the direct interaction between SiO2 nanoparticles and hepatocytes, we developed a culture model to investigate indirect KC-mediated interactions between SiO2 nanoparticles and hepatocytes, analyzed the proinflammatory cytokines released by KCs, and determined their effects on mitochondrial energy metabolism.
Materials and methods
Particles and their characteristics
SiO2 nanoparticles and micrometer SiO2 particles were purchased from Sigma Chemical Company (St Louis, MO, USA) at ≥99.0% purity. The average size of the particles was determined by transmission electron microscopy (TEM, JEOL Ltd, Tokyo, Japan) and scanning electron microscopy (SEM, JEOL Ltd). Characterization of the size and zeta potential of these particles in high-glucose Dulbecco’s Modified Eagle’s Medium with 10% fetal bovine serum was performed using a Zetasizer 3000HS (Malvern Instruments Ltd, Malvern, UK) and an LS230 laser diffraction particle size analyzer (Beckman Coulter Inc., Brea, CA, USA). All the particles were sterilized with epoxyethane and suspended in culture medium. Subsequently, the stock solution was diluted serially to yield concentrations ranging from 0.005 mg/mL to 2.0 mg/mL. The samples were sonicated for at least 30 minutes to produce a less aggregated and more uniform suspension before exposing the cells to the samples.
Cell preparation and culture
A primary KC culture was prepared as described by Tukov et al.16 Briefly, the liver of a male Sprague-Dawley rat was perfused with liver perfusion medium in situ through the portal vein. After digestion, the filtrate was centrifuged to form a hepatocyte pellet. The nonparenchymal cell fraction was layered onto a Percoll gradient. This assembly was centrifuged to separate the nonparenchymal cell fraction into distinct zones in the gradient. The KC-enriched fraction was aspirated into a clean tube and washed. The pellet was then resuspended in high-glucose Dulbecco’s Modified Eagle’s Medium without serum. The viability of the isolated KCs was determined by trypan blue exclusion and was generally >95%. The cell concentration was adjusted to 1×10⁶ viable cells/mL in a plastic culture flask for 20 minutes at 37°C in a humidified incubator. Next, the nonadherent cells were removed by replacing the culture medium with fresh complete culture medium. The purity of the KC was determined by ED1 (AbD Serotec, Kidlington, UK) staining (flow cytometry). For the in vitro study, KCs were plated into a culture plate and allowed to attach overnight.
A buffalo rat liver (BRL) cell line was obtained from the Cell Bank of Type Culture Collection at the Chinese Academy of Sciences in Shanghai, People’s Republic of China. The cells were grown in high-glucose Dulbecco’s Modified Eagle’s Medium containing 10% fetal bovine serum, 100 U/mL penicillin, and 100 μg/mL streptomycin at 37°C in an atmosphere of 5% CO2.
In the monoculture system, BRL cells were plated into a culture plate at different densities based on the experimental requirements and allowed to attach overnight. SiO2 nanoparticle suspensions with different concentrations ranging from 0.005 mg/mL to 1.0 mg/mL were then applied to the BRL cells. Cells not treated with SiO2 nanoparticles were used as the control.
In the other culture system, the following protocol was used. KCs were treated with lipopolysaccharide, a typical stimulant for KCs, in a plate for 24 hours. The supernatant was then harvested and centrifuged at 12,000 rpm for 10 minutes. The supernatant was then used to stimulate BRL cells in another plate. This group was used as a positive control. Similarly, KCs were incubated with SiO2 nanoparticles or micrometer SiO2 particles (2.0 mg/mL) for 24 hours. The supernatants were then harvested by centrifuging and used to stimulate BRL cells. These groups were used as the test groups. The negative BRL cell control was treated with the supernatant of the KCs that received no treatment. The duration of BRL cell stimulation was 24 hours.
The study was performed according to the ethical standards laid down in the 1964 Declaration of Helsinki and its later amendments, and was approved by the Independent Ethics Committee of Shanghai Ninth People’s Hospital.
Mitochondrial dehydrogenase activity
The effects of the SiO2 nanoparticles on mitochondrial dehydrogenase activity in BRL cells were assessed using the thiazolyl blue tetrazolium bromide assay. Cells were seeded at 2×10⁴ cells/well in a 96-well plate and cultured with 100 μL of culture medium for 24 hours. The spent medium was aspirated, and the cells were exposed to 100 μL of the test or control samples for 24 hours. The samples were removed, and the cells were washed once with 100 μL of phosphate-buffered saline before incubation with 100 μL of 3-(4,5-dimethylthiazol-2-yl)-2,5-diphenyl tetrazolium bromide (MTT) 1 mg/mL for 4 hours. The formazan crystals produced intracellularly were solubilized by incubating the cells with acidified isopropanol and quantified by absorbance measurements at 570 nm and 630 nm. The results are expressed as the percentage activity relative to that of cells grown in culture medium.
Leakage of lactate dehydrogenase
Leakage of lactate dehydrogenase (LDH) is a measure of cytotoxicity because LDH damages the integrity of the cell membrane, and in this study was determined using a commercial LDH kit (Jiancheng Bioengineering Co, Ltd, Nanjing, People’s Republic of China) according to the manufacturer’s protocols. After incubation with the SiO2 particles for 18 hours, the supernatants of the BRL cells were collected for measurement of LDH. A 100 mL aliquot of cell medium was used for the LDH activity analysis, and absorption was measured using an ultraviolet-visible spectrophotometer at 340 nm.
Transmission electron microscopy
TEM was used to visualize morphological changes in BRL cells exposed to SiO2 nanoparticles. Cells (1×10⁶ cells/mL) were plated in a plastic culture flask overnight and then exposed to the test samples for one hour. The cells were then washed with phosphate-buffered saline, prefixed with 2% glutaraldehyde (in phosphate-buffered saline), stained with 1% osmium tetroxide (in phosphate-buffered saline) and embedded in Spurr’s resin to enable viewing under a CM120 transmission electron microscope (Philips, Eindhoven, the Netherlands).
Detection of changes in mitochondrial membrane potential
The mitochondrial membrane potential was determined using a mitochondrial permeability detection kit (Applygen, Beijing, People’s Republic of China). The lipophilic dye JC-1 (5,50,6,60-tetrachloro-1,10,3,30-tetraethylbenzimidazolec arbocyanine iodide) was used to measure the mitochondrial membrane potential (ΔΨ m). This dye enters the mitochondria, aggregates, and fluoresces red. If the mitochondrial membrane potential collapses, the dye can no longer accumulate within the mitochondria and fluoresces green. BRL cells were cultured with SiO2 particles in six-well plates for 24 hours and then rinsed twice with phosphate-buffered saline and stained with 1 mL of culture medium containing 5 μmol/L JC-1 for 30 minutes at 37°C. The cells were rinsed twice with ice-cold phosphate-buffered saline, resuspended in 200 mL of ice-cold phosphate-buffered saline, and immediately assessed for red and green fluorescence using flow cytometry. A 488 nm filter was used for the excitation of JC-1. Emission filters at 535 nm and 595 nm were used to quantify the population of mitochondria with green (JC-1 monomers) and red (JC-1 aggregates) fluorescence, respectively. Frequency plots were prepared for FL1 (fluorescein isothiocyanate) and FL2 (phycoerythrin) to determine the percentage of mitochondria stained green (loss membrane potential) and red (normal membrane potential).
Western blot analysis
The cells were ruptured in a Dounce homogenizer with optimal gentle strokes and centrifuged at 1,500× g for 10 minutes at 4°C to remove unbroken cells and nuclei. The homogenates were collected and centrifuged again at 10,000× g for 10 minutes at 4°C to separate the mitochondria and cytosol fractions. The mitochondrial protein concentrations were determined by performing a bicinchoninic acid protein assay (Pierce, Rockford, IL, USA). Equal amounts of protein (30 μg) were then loaded onto sodium dodecyl sulfate-polyacrylamide gels (10%–15% separation gels) and electrophoretically transferred to nitrocellulose membranes (Amersham Biosciences, Piscataway, NJ, USA). After blocking with 5% nonfat milk in Tris-buffered saline containing 0.05% Tween-20 (TBST) for one hour at room temperature, the membrane was incubated with anti-isocitrate dehydrogenase, anti-citrate synthase (1:1,000, rabbit polyclonal antibodies, Abcam Inc., Cambridge, MA, USA) and anti-COX IV (1:1,000, rabbit polyclonal antibodies, Cell Signaling Technology, Danvers, MA, USA) overnight at 4°C, washed with TBST, and incubated with a horseradish peroxidase-conjugated anti-rabbit IgG secondary antibody for one hour at 37°C. The antibody-bound proteins were detected using ECL chemiluminescence reagent (EMD Millipore Corporation, Billerica, MA, USA).
Measurement of mitochondrial complex activity
The activity of complex I (NADH-co-enzyme Q [CoQ] oxidoreductase) was assayed by Hatefi’s method17 with slight modifications. Fifty milliliters of 1.0 M phosphate buffer (pH 8.0), 50 mL of 1.0 mM CoQ, and 12 mL of 10 mM NADH were added to 880 mL of double-distilled water, and the solution was mixed well. Fifty milliliters of 1/5 diluted mitochondrial fraction were then added, and the decrease in absorbance was measured at 340 nm for 3 minutes at 15-second intervals. An extinction coefficient of 6.3 mM−1 cm−1 was used to calculate the activity.
The activity of complex II (succinate-CoQ oxidoreductase) was measured by Hatefi and Stiggall’s method18 with slight modifications; 0.5 mL of 0.2 M ethylenediaminetetraacetic acid (pH 7.0), 20 mL of 0.1 M sodium azide, and 800 mL of 50 mM potassium phosphate buffer (pH 7.4) were added to 20 mL of 1.0 M sodium succinate (pH 7.4), and the solution was incubated at 37°C for 10 minutes. Next, 16 mL of 4.65 mM 2,6-dichlorophenol indophenol and 20 mL of 2.5 mM CoQ were added to the above mixture; 50 mL of the mitochondrial fraction was diluted to 1/5 of its original concentration, and the activity was measured at 600 nm for 3 minutes at 15-second intervals. An extinction coefficient of 21 mM−1 cm−1 was used for the calculation.
The activity of complex III (CoQ-cytochrome c oxidoreductase) was measured according to the method of Shimomura et al19 with slight modifications; 200 mL of 0.1 M sodium azide and 20 mL of 30 mM cytochrome c were added to 700 mL of 25 mM phosphate buffer (pH 7.5) containing 25 mM ethylenediaminetetraacetic acid. Next, 63 mM of reduced CoQ was added, and 50 mL of mitochondrial suspension diluted to 1/5 of its original concentration was added. The reaction was monitored at 550 nm for 3 minutes at 15-second intervals. The increase in absorbance was noted. An extinction coefficient of 18.5 mM−1 cm−1 was used for the calculation.
The activity of complex IV (cytochrome c oxidase) was assayed by Wharton and Tzagoloff’s method20 with slight modifications; 100 mL of reduced cytochrome c was added to 2.85 mL of 50 mM phosphate buffer (pH 7.0), and the mixture was subsequently incubated. Next, 50 mL of 1/5 diluted mitochondrial suspension was added to the above mixture, and the decrease in absorbance was measured at 550 nm for 3 minutes at 15-second intervals. An extinction coefficient of 21.1 mM−1 cm−1 was used for the calculation.
Cytokine measurement
For the TNF-α assay, the KCs were treated with the particles, and the supernatants were then collected after 24 hours. The amounts of TNF-α were quantified with an immunoassay kit (R&D Systems, Abingdon, UK). All of the cytokines were quantified using a sandwich enzyme-linked immunosorbent assay procedure.
Measurement of nitrite
The production of NO was determined by measurement of nitrite, a stable product of NO that reflects accumulated NO in the medium, using the Griess reagent (1% sulfanilamide, 5% phosphoric acid, and 0.1% naphthylethylenediamine). This assay relies on a diazotization reaction that was originally described by Griess in 1879.21 Briefly, 100 μL of medium were mixed with 100 μL of Griess reagent in a 96-well flat plate. After 10 minutes, the plate was mounted in an automated microplate reader. The concentration of nitrite was determined at 540 nm by referring to a standard curve for sodium nitrite. Culture medium was used as the blank control.
Measurement of ROS
ROS were measured by flow cytometry using the oxidation-sensitive probe 2,7′-dichlorofluorescein diacetate (DCFH-DA, Applygen). Briefly, 10 mM of DCFH-DA stock solution (in methanol) was diluted 4,000-fold in cell culture medium without serum or other additives to yield a 2.5 μM working solution. After the KCs had been exposed to SiO2 particles for 24 hours, the cells were washed twice with phosphate-buffered saline and incubated in 0.5 mL of DCFH-DA working solution at 37°C in 24-well plates in the dark for 30 minutes. The cells were then washed twice with cold phosphate-buffered saline and resuspended in phosphate-buffered saline for analysis of intracellular ROS with a FACScan flow cytometer (BD Biosciences, Franklin Lakes, NJ, USA). The DCFH fluorescence emission was collected with a 530 nm band-pass filter. The mean fluorescence intensity of 104 cells was quantified using Cell Quest software (Becton, Dickinson and Company, Franklin Lakes, NJ, USA). The data were normalized to the mean fluorescence intensity of the control cells.
Statistical analysis
The data are expressed as the mean ± standard deviation. Statistical comparisons of means were performed using one-way analysis of variance followed by the Tukey–Kramer test using SAS version 6.12 software (SAS Institute, Cary, NC, USA). The differences were considered to be statistically significant at a P-value of <0.05.
Results
Particle characterization
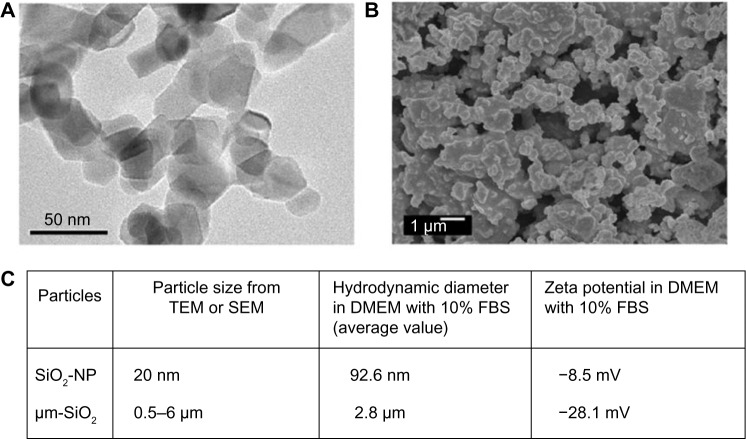
The primary sizes of the SiO2 particles were estimated from the TEM (Figure 1A) and SEM (Figure 1B) images, and are presented in Figure 1C. The TEM image characteristics show that the SiO2 nanoparticles were granular with a diameter of 20 nm; the SEM image characteristics show that the micrometer SiO2 particles were irregularly shaped with diameters of 0.5–6 μm. Because nanoparticles often form agglomerates in solution, the sizes of the particles and their agglomerates in suspended Dulbecco’s Modified Eagle’s Medium with 10% fetal bovine serum were estimated using dynamic light scattering. The dynamic light scattering-measured value for the SiO2 nanoparticle was larger than the particle size measured by TEM, whereas the value for the micrometer SiO2 particles was not larger than that measured by SEM (Figure 1C), indicating that the SiO2 nanoparticles formed agglomerates in the culture medium. The zeta potentials were −8.5 mV and −28.1 mV for SiO2 nanoparticles and micrometer SiO2 particles, respectively (Figure 1C).
Figure 1.
Characterization of SiO2 particles.
Notes: (A) TEM analysis of SiO2 nanoparticles, (B) SEM analysis of micrometer SiO2 particles, and (C) particle size, hydrodynamic diameter, and zeta potential.
Abbreviations: SEM, scanning electron microscopy; TEM, transmission electron microscopy; DMEM, Dulbecco’s Modified Eagle’s Medium; FBS, fetal bovine serum; μm-SiO2, micrometer SiO2 particles; NP, nanoparticle.
Mitochondrial dehydrogenase activity and LDH leakage from BRL cells
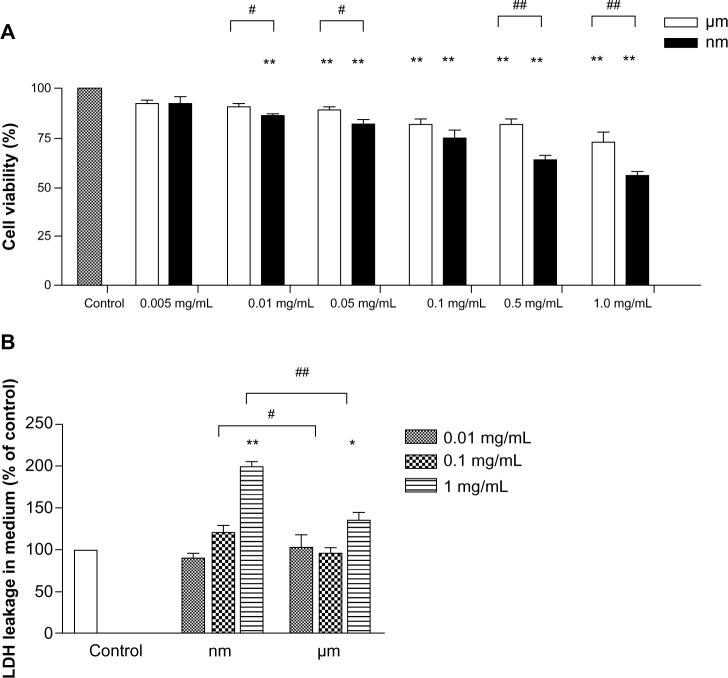
Overt mitochondrial toxicity of the SiO2 nanoparticles to BRL cells was measured via cellular mitochondrial dehydrogenase activity. At low concentrations of 0.005 mg/mL, neither the SiO2 nanoparticles nor the micrometer SiO2 particles influenced cellular mitochondrial dehydrogenase activity after 24 hours of exposure (Figure 2A). However, significant decreases in enzyme activity were observed following exposure of the cells to 0.01 mg/mL and 0.05 mg/mL of SiO2 nanoparticles and micrometer SiO2 particles, respectively. Moreover, the decreases could be detected in a dose-dependent manner at higher concentrations of the two types of particles. The SiO2 nanoparticle samples exerted a greater influence at almost all concentrations ≥0.01 mg/mL. At the highest concentrations (1.0 mg/mL), the cell viability for the SiO2 nanoparticle sample decreased to 55.65%, which was significantly lower than the control.
Figure 2.
Effects of SiO2 particles on the activity of mitochondrial dehydrogenase and LDH leakage from BRL cells.
Notes: (A) Mitochondrial dehydrogenase activity of BRL cells treated with SiO2 particles for 24 hours was measured with MTT assay. (B) LDH level of the BRL cells cultured for 18 hours in medium containing various SiO2 particle concentrations was measured by LDH assay. The data are presented as the mean ± standard deviation. The experiments were repeated in triplicate, and a similar pattern was observed. *P<0.05, **P<0.01 versus control; #P<0.05, ##P<0.01 versus micrometer SiO2 particles.
Abbreviations: LDH, lactate dehydrogenase; BRL, buffalo rat liver; MTT, 3-(4,5-dimethylthiazol-2-yl)-2,5-diphenyl tetrazolium bromide.
LDH leakage was measured to reveal the impact of the particles on cell membrane integrity and their cytotoxicity. As indicated in Figure 2B, no significant difference in LDH release was observed compared with control when the samples were incubated with 0.01 mg/mL of SiO2 nanoparticles or micrometer SiO2 particles for 18 hours. At the highest concentrations, LDH release was significantly elevated for the samples with both types of particles compared with the negative control. In addition, greater elevation effects were found for the SiO2 nanoparticle samples than for the micrometer SiO2 particle samples.
Uptake of SiO2 nanoparticles and mitochondrial injury in BRL cells
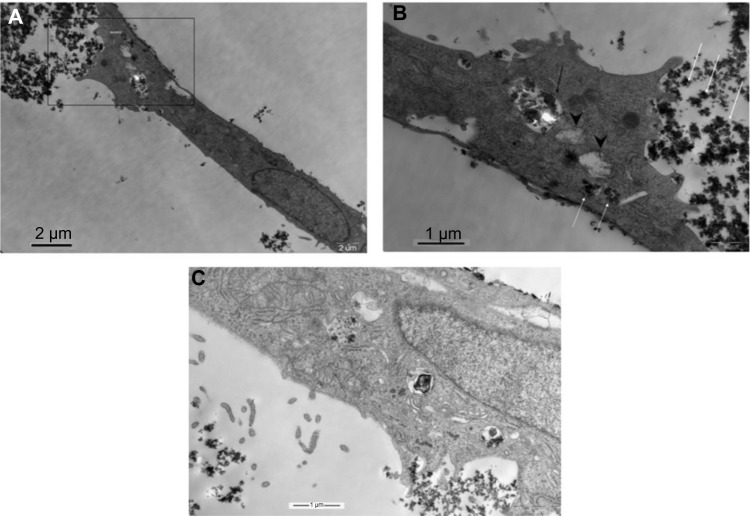
The morphology of BRL cells following exposure to 1 mg/mL of SiO2 nanoparticles for one hour was examined by TEM. As shown in Figure 3A–C, small particle aggregates were visible. Some small particle aggregates were localized in the cytoplasmic vesicles of the cell, while some aggregates were free in the cytoplasm. Notably, swelling mitochondria with vacuolization and reduced crests were found near the particles that were free in the cytoplasm (Figure 3B).
Figure 3.
Transmission electron microscopic images of BRL cells treated with SiO2 nanoparticles (1 mg/mL) for 1 hour.
Notes: (A) Image of the whole cell. (B) Image of the gated part of (A). Nanoparticles are indicated with white arrows, the particle-filled vesicle is indicated with a black arrow, and the damaged mitochondria are indicated with arrow heads. (C) Image of SiO2 nanoparticles close up in vesicles. The bars represent 2 μm (A) and 1 μm (B and C).
Abbreviation: BRL, buffalo rat liver.
Mitochondrial membrane potential in BRL cells
The mitochondrial membrane potential is a key indicator of the integrity of the membrane. It reflects the pumping of hydrogen ions across the inner membrane during the electron transport and oxidative phosphorylation processes, which are the driving forces behind production of adenosine triphosphate. Alteration of mitochondrial membrane permeability is also regarded as one of the crucial events in cellular apoptosis. Therefore, the effect of SiO2 particles on the mitochondrial membrane potential of BRL cells was evaluated using the JC-1 mitochondrial membrane potential detection kit. As shown in Figure 4, compared with the control value (3.18%±2.63%), treatment of BRL cells with SiO2 nanoparticles and micrometer SiO2 particles resulted in dose-dependent increases in the green fluorescent JC-1 monomers, but these increases were not significant at most concentrations. A significant difference was observed only in the 1.0 mg/mL SiO2 nanoparticle samples (32.22%±5.51%). These results demonstrate that mitochondrial depolarization was induced by the SiO2 nanoparticles.
Figure 4.
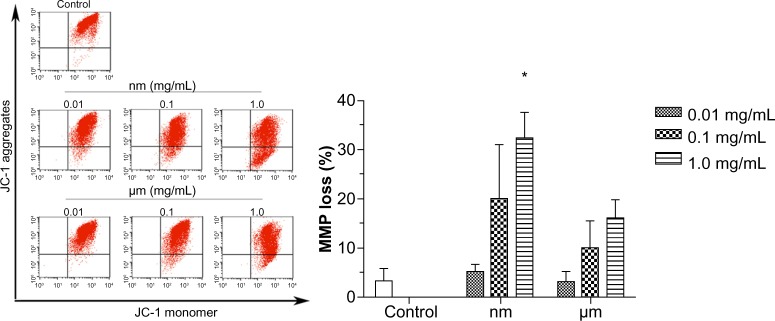
Effect of SiO2 particles on the mitochondrial membrane potential of BRL cells.
Notes: BRL cells were treated with different concentrations of SiO2 particles for 18 hours, stained with JC-1 and analyzed by flow cytometry. The scatter plot of the flow cytometry analysis shows the distribution of JC-1 aggregates and JC-1 monomer in the mitochondrial membrane and cytoplasm, respectively. The bar graph shows the percentage of JC-1 monomer-positive cells. The results are the mean ± standard deviation of three independent experiments. *P<0.05 versus the control.
Abbreviations: JC-1, 5,50,6,60-tetrachloro-1,10,3,30-tetraethylbenzimidazolecarbocyanine iodide; BRL, buffalo rat liver; MMP, mitochondrial membrane potential.
Krebs cycle enzymes in BRL cells
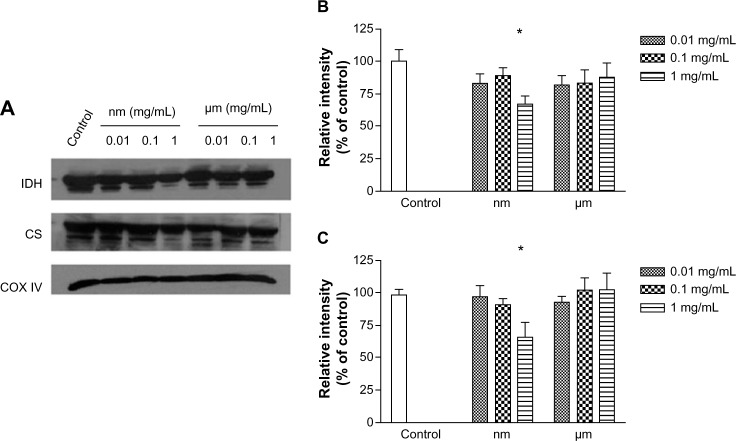
Isocitrate dehydrogenase and citrate synthase are enzymes that participate in the Krebs cycle, and were assayed in this study by Western blot. As shown in Figure 5, compared with the negative control, SiO2 nanoparticles inhibited expression of both isocitrate dehydrogenase and citrate synthase at a concentration of 1.0 mg/mL, whereas micrometer SiO2 particles did not. This finding suggests that SiO2 nanoparticles have the potential to disturb the Krebs cycle in BRL cells.
Figure 5.
Effects of SiO2 particles on the expression of Krebs cycle enzymes (IDH and CS) in BRL cells.
Notes: (A) BRL cells were exposed to different concentrations of SiO2 particles for 24 hours. Aliquots of mitochondrial protein were separated by sodium dodecyl sulfate polyacrylamide gel electrophoresis and analyzed by Western blotting. COX IV was used as an internal control to monitor for equal loading. Densitometry showing data for (B) IDH and (C) CS. The results are the mean ± standard deviation of three independent experiments. *P<0.05 versus the control.
Abbreviations: CS, citrate synthase; IDH, isocitrate dehydrogenase; BRL, buffalo rat liver; COX, cytochrome C oxidase.
Activity of mitochondrial respiratory chain complexes I–IV in BRL cells
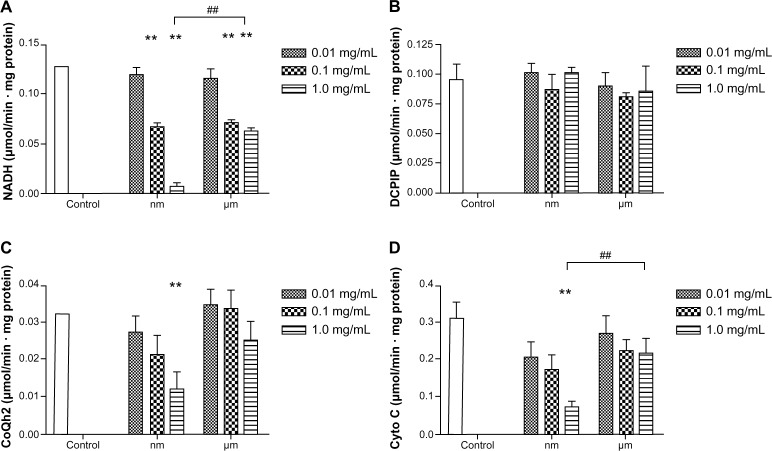
Mitochondrial respiratory chain complexes drive synthesis of adenosine triphosphate though a concerted action, and this action is termed oxidative phosphorylation. Figure 6 shows the activity of the mitochondrial chain complexes in BRL cells. There appeared to be significant inhibition in the activity of complexes I, III, and IV after addition of SiO2 nanoparticles, especially at a concentration of 1.0 mg/mL (Figure 6A–D). However, treatment with micrometer SiO2 particles did not appear to affect any of the mitochondrial chain complexes, except for complex I at concentrations of 0.1 mg/mL and 1.0 mg/mL. However, complex I was less affected by the micrometer SiO2 particles than by the SiO2 nanoparticles (Figure 6A). In addition, all of the inhibitory effects appeared to be dose-dependent. Our results indicate that SiO2 nanoparticles are more capable of reducing the activity of the mitochondrial respiratory chain complexes I, III, and IV than micrometer SiO2 particles.
Figure 6.
Effects of SiO2 particles on the mitochondrial respiratory chain complexes I (A), II (B), III (C), and IV (D) of BRL cells after treatment for 24 hours.
Notes: The results are presented as the mean ± standard deviation of three independent experiments performed in triplicate. **P<0.01 versus the control; ##P<0.01 versus micrometer SiO2 particles.
Abbreviations: CoQ, coenzyme Q; Cyto C, cytochrome C; BRL, buffalo rat liver; NADH, nicotinamide adenine dinucleotide; DCPIP, 2,6-dichlorophenolindophenol.
Inflammatory mediators generated by KCs
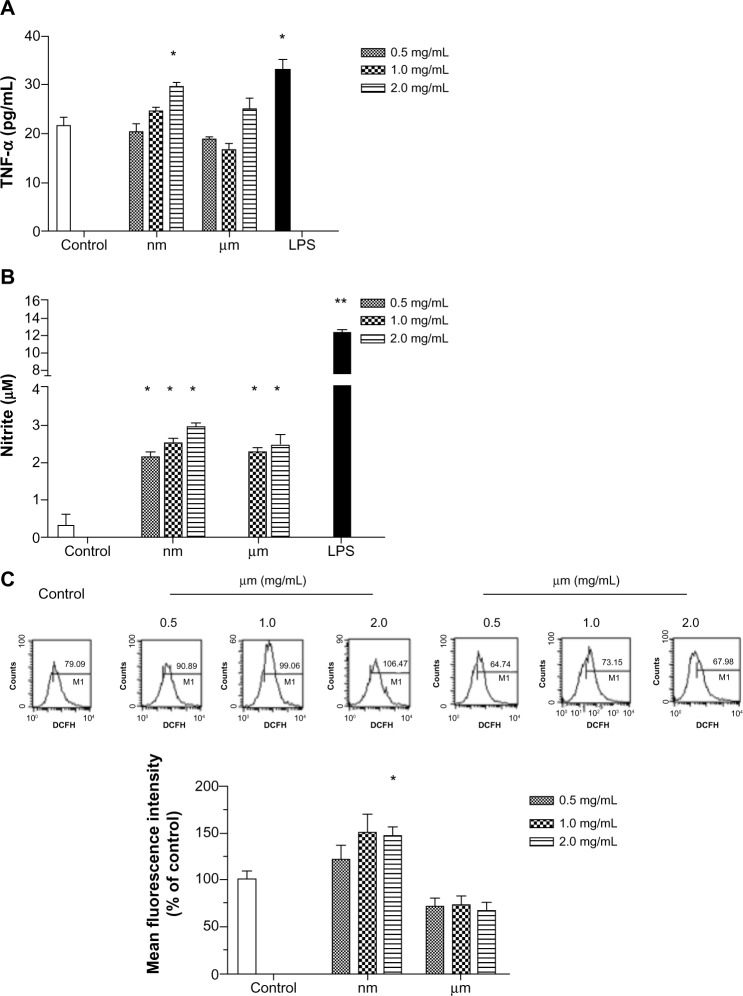
To clarify the effects of SiO2 particles on KCs, we measured inflammatory mediators generated by KCs. Because TNF-α, NO, and ROS from activated KCs play an important role in the KC inflammatory response, these mediators were chosen as indicators. As shown in Figure 7A and B, secretion of TNF-α and NO increased significantly after addition of lipopolysaccharide. SiO2 nanoparticles appeared to be potent inducers of these three mediators, especially at the highest concentration (Figure 7A–C). SiO2 nanoparticles acted effectively in a dose-dependent manner with regard to production of NO. Treatment with micrometer SiO2 particles did not appear to affect production of TNF-α and ROS, but NO expression increased at concentrations of 1.0 mg/mL and 2.0 mg/mL (Figure 7B). Therefore, our results indicate that SiO2 nanoparticles are more capable of upregulating the secretion of inflammatory mediators from KCs than micrometer SiO2 particles, although at different levels.
Figure 7.
Effect of SiO2 particles on secretion of proinflammatory factors from Kupffer cells.
Notes: Kupffer cells were treated with different concentrations of SiO2 particles or lipopolysaccharide (1 µg/mL) for 24 hours. The cultured supernatants and cells were collected and assayed for TNF-α (A), nitric oxide (B), and reactive oxygen species (C). The data are expressed as the mean ± standard deviation. The experiments were repeated three times, and a similar stimulation pattern was observed. *P<0.05, **P<0.01.
Abbreviations: TNF-α, tumor necrosis factor alpha; LPS, lipopolysaccharide.
Activity of mitochondrial respiratory chain complexes I and IV in BRL cells treated with supernatants isolated from KCs
Complexes I and IV were selected as indicators to verify whether SiO2 nanoparticles could induce KC-mediated changes in the activity of mitochondrial respiratory chain complexes in BRL cells. As shown in Figure 8, compared with the negative control, BRL cells treated with the supernatant from untreated KCs (0.27±0.03) and the supernatant from SiO2 nanoparticle-treated KCs markedly suppressed the activity of complex I (0.16±0.01), as did the positive control (0.17±0.003). In contrast, the supernatant from micrometer SiO2 particle-treated KCs did not have this suppressive effect. There was no significant difference in the activity of complex IV between BRL cells incubated with the supernatants of treated and nontreated KCs (Figure 8B).
Figure 8.
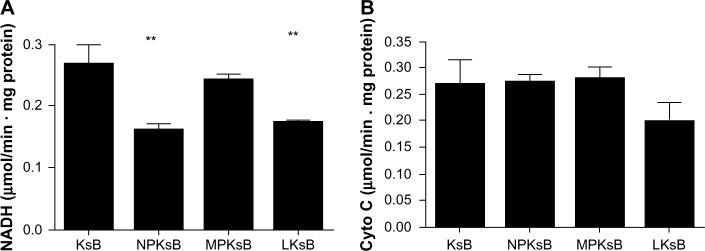
Effect of SiO2 particles on mitochondrial respiratory chain complexes I (A) and IV (B) in BRL cells after coculture.
Notes: BRL cells were incubated with the cell-free supernatant of KsB or Kupffer cells stimulated with SiO2 particles (NPKsB, MPKsB, 2.0 mg/mL) or lipopolysaccharide 1 μg/mL for 24 hours. The data are presented as the mean ± standard deviation of three independent experiments performed in triplicate. **P<0.01 compared with KsB.
Abbreviations: KsB, BRL cells treated with the supernatant from the untreated Kupffer cells; LKsB, BRL cells treated with the supernatant from the lipopolysaccharide-treated Kupffer cells; NPKsB, BRL cells treated with the supernatant from the SiO2 NP-treated Kupffer cells; MPKsB, BRL cells treated with the supernatant from the micrometer SiO2 particle-treated Kupffer cells; BRL, buffalo rat liver; NADH, nicotinamide adenine dinucleotide; Cyto C, cytochrome C.
Discussion
After SiO2 nanoparticles are injected into an animal’s body, the liver is the major organ where they tend to aggregate and be retained in vivo. Although numerous studies have shown that SiO2 nanoparticles induce cytotoxicity and oxidative stress in hepatocytes,7–9,22 the state of energy metabolism in these hepatocytes, especially in hepatocellular mitochondria, is largely unclear. Our findings demonstrate that direct exposure of hepatocytes to SiO2 nanoparticles induced mitochondrial damage, inhibition of mitochondrial dehydrogenase activity, mitochondrial depolarization, decreased enzymatic expression in the Krebs cycle, and decreased activity of the mitochondrial respiratory chain complexes I, III, and IV. We also explored the KC-mediated pathway, and observed SiO2 nanoparticle-induced KC activation, leading to secretion of TNF-α, NO, and ROS by KCs and subsequent inhibition of the activity of mitochondrial respiratory chain complex I in hepatocytes.
In the system with direct exposure of hepatocytes to SiO2 nanoparticles, mitochondrial dehydrogenase activity was first determined to assess the biological effects of different concentrations of SiO2 nanoparticles on hepatocytes. Our MTT results show that exposure to higher concentrations (0.01–1.0 mg/mL) of SiO2 nanoparticles caused a decrease in dehydrogenase activity in hepatocellular mitochondria (Figure 2A). In the MTT assay, suppression of mitochondrial dehydrogenase activity could also reflect inhibition of cell viability. According to other reports, such a cytotoxic effect of SiO2 nanoparticles has been observed in a variety of cell types,23–25 especially in apoptosis of cells via the mitochondria-dependent pathway.26,27 To better confirm cytotoxicity in the MTT assay, LDH release was also measured (Figure 2B). After exposure to SiO2 nanoparticles for 18 hours, LDH release was accordingly increased by SiO2 nanoparticles but only at the highest concentration; this result indicates that exposure to high concentrations of SiO2 nanoparticles can affect cell membrane integrity and lead to cell death. Similarly, previous studies have shown that polycationic organic nanoparticles cause holes in plasma membranes, and formation of such holes has been linked to cellular uptake of particles.28 In a previous study, we found that high concentrations of SiO2 nanoparticles damaged cellular plasma membranes and caused necrosis in endothelial cells.26
Following in vitro exposure, SiO2 nanoparticles were readily taken up by hepatocytes; the location of the nanoparticles in the cells was observed, and the physiological state of the mitochondrion was determined (Figure 3). In the present experiments, most SiO2 nanoparticles were concentrated within membrane-bound vesicles 0.5–1.0 μm in diameter, and the particle aggregates were large enough to be visible by TEM. This concentration of SiO2 nanoparticles indicates either effective removal of these nanoparticles from the cytoplasm after diffusion through the membrane or their uptake via mechanisms involving incorporation of particles into the membrane, eg, endocytosis. In contrast, some particles did not appear to be membrane-bound but were free within the cytoplasm. Notably, swollen mitochondria with vacuolization and reduced crests were found near the particles that were free within the cytoplasm (Figure 3B); this location indicated that these particles that were free within the cytoplasm might be responsible for the damaged mitochondrion. In addition, the disturbance of mitochondrial structure might be correlated with release of ROS and subsequent activation of p53, Bax, and Bcl-2, which are involved in the mitochondrial-dependent apoptotic pathway in BRL cells. In the present experiments, we also observed the location of the micrometer SiO2 nanoparticles in BRL cells, and most of these were taken up and accumulated in cells. However, damaged mitochondria could not be visualized by TEM (images not shown).
Any change in mitochondrial membrane permeability indicates interruption of the integrity of the mitochondrial membrane. Such a change indicates that the ability to pump hydrogen ions across the inner membrane during the process of electron transport and oxidative phosphorylation has been disturbed. Mitochondrial depolarization induced by SiO2 nanoparticles has been previously reported in other cell lines, ie, a hepatocellular carcinoma (HepG2) cell line27 and endothelial cells.26 Consistent with these reports, our study showed a clear response in mitochondrial depolarization following exposure to SiO2 nanoparticles (Figure 4); this response suggests that mitochondrial membrane disturbance is involved in SiO2 nanoparticle-induced dysfunctional energy metabolism.
During the energy production process, the Krebs cycle, an important aerobic pathway for the final steps of carbohydrate and fatty acid oxidation, occurs in the mitochondrial matrix, while the oxidative phosphorylation process occurs in the inner mitochondrial membrane through a concerted action to drive conversion of energy from carbohydrates or fatty acids to adenosine triphosphate. Citrate synthase works as a pace-making enzyme in the first step of the Krebs cycle, and isocitrate dehydrogenase catalyzes the third step of the cycle, ie, oxidative decarboxylation of isocitrate to produce α-ketoglutarate and CO2 while converting NAD+ to NADH. In this study, we found that expression of citrate synthase and isocitrate dehydrogenase was significantly decreased in BRL cells after exposure to SiO2 nanoparticles at a concentration of 1.0 mg/mL (Figure 5). These decreases indicated the dysfunction of these Krebs cycle enzymes. Consistent with our results, Parveen et al29 reported that the metabonomic profiles of serum from rats treated for 90 days with SiO2 nanoparticles showed a significant decrease in glucose levels and considerable increases in lactate, alanine, acetate, creatine, and choline. These changes indicate impairment of the Krebs cycle and liver metabolism. Mitochondrial bioenergetics were also assessed by evaluating the parameters of the mitochondrial respiratory chain. Therefore, we examined the activity of the mitochondrial respiratory chain complexes I, II, III, and IV and found that SiO2 nanoparticles had similar inhibitory effects on complexes I, III, and IV (Figure 6). Although such an investigation has not been reported until now, other nanoparticles, ie, silver nanoparticles, have been shown to decrease the activity of the mitochondrial respiratory chain complexes I, II, III, and IV from brain, skeletal muscle, heart, and liver tissues of rats in vitro.30
KCs play an important role in the defense against invading particles.16,31 However, as the primary responders to toxicants, some studies, including ours, have considered the proinflammatory molecules released by KCs to be mediators of subsequent hepatic damage.32,33 In the present study, our results indicate that SiO2 nanoparticles are capable of enhancing production of proinflammatory factors such as TNF-α, NO, and ROS (Figure 7) by KCs, and are fairly consistent with our own recent report.22 In related research on sepsis, a systemic inflammatory response syndrome to a serious infection that is associated with mitochondrial dysfunction, all of the above mentioned factors were significantly correlated with inhibition of the complexes.34–36 NO has been suggested to be responsible for the inhibition of complex IV by directly binding to the core of complex IV. Moreover, interaction of NO with ROS leads to the formation of peroxynitrite anion (ONOO·), which has been suggested to bind to and inhibit mitochondrial complex I.34 It has been reported that TNF-α transgenic rats, which have higher basal ROS production, show altered mitochondrial homeostasis.35 TNF-α and ischemic stress synergistically augment mitochondrial dysfunction to promote neuronal death.35 Moreover, TNF-α can trigger increased inducible NO synthase expression or release of ROS in hepatocytes and can increase the formation of ONOO· to inhibit the mitochondrial complex directly or through a mitochondrial DNA damage pathway.36 Although no relevant report has addressed the role of KCs in the mitochondrial complex toxicity induced by SiO2 nanoparticles, we hypothesize that the proinflammatory molecules induced from KCs by SiO2 nanoparticles could exhibit inhibitory effects on complexes I and IV. When we examined the activities of both the complex I and the complex IV cells, we found an inhibitory pattern for complex I but not for complex IV (Figure 8), and further investigation is needed to explain this result.
In conclusion, we investigated SiO2 nanoparticle-induced mitochondrial injury and mitochondrial energy metabolism impairment in BRL cells directly and through a KC-mediated pathway in vitro. Our results show that direct exposure of hepatocytes to SiO2 nanoparticles induced mitochondrial damage, which was accompanied by decreases in mitochondrial dehydrogenase activity, mitochondrial membrane potential, enzymatic expression in the Krebs cycle, and the activity of mitochondrial respiratory chain complexes I, III, and IV. Meanwhile, the role of KCs was also assessed. We observed that SiO2 nanoparticles had the ability to induce KC activation, leading to secretion of TNF-α, NO, and ROS from KCs and subsequently to inhibit mitochondrial respiratory chain complex I activity in BRL cells. This study provides important insights into the potentially adverse effects of in vitro exposure to SiO2 nanoparticles on mitochondrial energy metabolism in hepatocytes; however, these findings must be verified by investigations in animals and human beings.
Acknowledgments
This work was supported by grants from the Natural Science Foundation of China (31070843) and the Shanghai Sci-Tech Committee Foundation (11DZ2291700).
Footnotes
Disclosure
The authors report no conflicts of interest in this work.
References
- 1.Huo Q, Liu J, Wang LQ, Jiang Y, Lambert TN, Fang E. A new class of silica cross-linked micellar core-shell nanoparticles. J Am Chem Soc. 2006;128:6447–6453. doi: 10.1021/ja060367p. [DOI] [PubMed] [Google Scholar]
- 2.Roy I, Ohulchanskyy TY, Bharali DJ, et al. Optical tracking of organically modified silica nanoparticles as DNA carriers: a nonviral, nanomedicine approach for gene delivery. Proc Natl Acad Sci U S A. 2005;102:279–284. doi: 10.1073/pnas.0408039101. [DOI] [PMC free article] [PubMed] [Google Scholar]
- 3.Zhao X, Hilliard LR, Mechery SJ, et al. A rapid bioassay for single bacterial cell quantitation using bioconjugated nanoparticles. Proc Natl Acad Sci U S A. 2004;101:15027–15032. doi: 10.1073/pnas.0404806101. [DOI] [PMC free article] [PubMed] [Google Scholar]
- 4.Xie G, Sun J, Zhong G, Shi L, Zhang D. Biodistribution and toxicity of intravenously administered silica nanoparticles in mice. Arch Toxicol. 2010;84:183–190. doi: 10.1007/s00204-009-0488-x. [DOI] [PubMed] [Google Scholar]
- 5.Cho M, Cho WS, Choi M, et al. The impact of size on tissue distribution and elimination by single intravenous injection of silica nanoparticles. Toxicol Lett. 2009;189:177–183. doi: 10.1016/j.toxlet.2009.04.017. [DOI] [PubMed] [Google Scholar]
- 6.Nishimori H, Kondoh M, Isoda K, Tsunoda S, Tsutsumi Y, Yagi K. Histological analysis of 70-nm silica particles-induced chronic toxicity in mice. Eur J Pharm Biopharm. 2009;72:626–629. doi: 10.1016/j.ejpb.2009.03.007. [DOI] [PubMed] [Google Scholar]
- 7.Ye Y, Liu J, Xu J, Sun L, Chen M, Lan M. Nano-SiO2 induces apoptosis via activation of p53 and Bax mediated by oxidative stress in human hepatic cell line. Toxicol In Vitro. 2010;24:751–758. doi: 10.1016/j.tiv.2010.01.001. [DOI] [PubMed] [Google Scholar]
- 8.Xu Z, Chou L, Sun J. Effects of SiO2 nanoparticles on HFL-I activating ROS-mediated apoptosis via p53 pathway. J Appl Toxicol. 2012;32:358–364. doi: 10.1002/jat.1710. [DOI] [PubMed] [Google Scholar]
- 9.Yang X, Liu J, He H, et al. SiO2 nanoparticles induce cytotoxicity and protein expression alteration in HaCaT cells. Part Fibre Toxicol. 2010;7:1. doi: 10.1186/1743-8977-7-1. [DOI] [PMC free article] [PubMed] [Google Scholar]
- 10.Garrido C GL BM, Puig PE, Didelot C, Kroemer G. Mechanisms of cyt C release from mitochondria. Cell Death Differ. 2006;13:1423–1433. doi: 10.1038/sj.cdd.4401950. [DOI] [PubMed] [Google Scholar]
- 11.Lu X, Tian Y, Zhao Q, Jin T, Xiao S, Fan X. Integrated metabonomics analysis of the size-response relationship of silica nanoparticles-induced toxicity in mice. Nanotechnology. 2011;22:055101. doi: 10.1088/0957-4484/22/5/055101. [DOI] [PubMed] [Google Scholar]
- 12.Shim W, Paik MJ, Nguyen DT, et al. Analysis of changes in gene expression and metabolic profiles induced by silica-coated magnetic nanoparticles. ACS Nano. 2012;6:7665–7680. doi: 10.1021/nn301113f. [DOI] [PubMed] [Google Scholar]
- 13.Nishimori H KM, Isoda K, Tsunoda S, Tsutsumi Y, Yagi K. Silica nanoparticles as hepatotoxicants. Eur J Pharm Biopharm. 2009;72:496–501. doi: 10.1016/j.ejpb.2009.02.005. [DOI] [PubMed] [Google Scholar]
- 14.Hoek JB, Pastorino JG. Ethanol, oxidative stress, and cytokine-induced liver cell injury. Alcohol. 2002;27:63–68. doi: 10.1016/s0741-8329(02)00215-x. [DOI] [PubMed] [Google Scholar]
- 15.Kmiec Z. Cooperation of liver cells in health and disease. Adv Anat Embryol Cell Biol. 2001;161:III–XIII. 1–151. doi: 10.1007/978-3-642-56553-3. [DOI] [PubMed] [Google Scholar]
- 16.Tukov FF, Maddox JF, Amacher DE, Bobrowski WF, Roth RA, Ganey PE. Modeling inflammation-drug interactions in vitro: a rat Kupffer cell-hepatocyte coculture system. Toxicol In Vitro. 2006;20:1488–1499. doi: 10.1016/j.tiv.2006.04.005. [DOI] [PubMed] [Google Scholar]
- 17.Hatefi Y RJ. Preparation and properties of DPNH-coenzyme Q reductase (complex I of the respiratory chain) Methods Enzymol. 1967;10:235–239. [Google Scholar]
- 18.Hatefi Y, Stiggall DL. Preparation and properties of succinate: ubiquinone oxidoreductase (complex II) Methods Enzymol. 1978;53:21–27. doi: 10.1016/s0076-6879(78)53008-5. [DOI] [PubMed] [Google Scholar]
- 19.Shimomura Y, Nishikimi M, Ozawa T. Isolation and reconstitution of the iron-sulfur protein in ubiquinol-cytochrome c oxidoreductase complex. Phospholipids are essential for the integration of the iron-sulfur protein in the complex. J Biol Chem. 1984;259:14059–14063. [PubMed] [Google Scholar]
- 20.Wharton DC, Tzagoloff A. Studies on the Electron Transfer System. Lvii. The near infrared absorption band of cytochrome oxidase. J Biol Chem. 1964;239:2036–2041. [PubMed] [Google Scholar]
- 21.Griess P. About some azo compounds. Chemische Berichte. 1879;12:426–428. [Google Scholar]
- 22.Chen Q, Xue Y, Sun J. Kupffer cell-mediated hepatic injury induced by silica nanoparticles in vitro and in vivo. Int J Nanomedicine. 2013;8:1129–1140. doi: 10.2147/IJN.S42242. [DOI] [PMC free article] [PubMed] [Google Scholar]
- 23.Wang F, Gao F, Lan M, Yuan H, Huang Y, Liu J. Oxidative stress contributes to silica nanoparticle-induced cytotoxicity in human embryonic kidney cells. Toxicol In Vitro. 2009;23:808–815. doi: 10.1016/j.tiv.2009.04.009. [DOI] [PubMed] [Google Scholar]
- 24.Eom HJ, Choi J. Oxidative stress of silica nanoparticles in human bronchial epithelial cell, Beas-2B. Toxicol In Vitro. 2009;23:1326–1332. doi: 10.1016/j.tiv.2009.07.010. [DOI] [PubMed] [Google Scholar]
- 25.Choi SJ, Oh JM, Choy JH. Toxicological effects of inorganic nanoparticles on human lung cancer A549 cells. J Inorg Biochem. 2009;103:463–471. doi: 10.1016/j.jinorgbio.2008.12.017. [DOI] [PubMed] [Google Scholar]
- 26.Liu X, Sun J. Endothelial cells dysfunction induced by silica nanoparticles through oxidative stress via JNK/P53 and NF-kappaB pathways. Biomaterials. 2010;31:8198–8209. doi: 10.1016/j.biomaterials.2010.07.069. [DOI] [PubMed] [Google Scholar]
- 27.Sun L, Li Y, Liu X, et al. Cytotoxicity and mitochondrial damage caused by silica nanoparticles. Toxicol In Vitro. 2011;25:1619–1629. doi: 10.1016/j.tiv.2011.06.012. [DOI] [PubMed] [Google Scholar]
- 28.Leroueil PR, Hong S, Mecke A, Baker JR, Jr, Orr BG, Banaszak Holl MM. Nanoparticle interaction with biological membranes: does nanotechnology present a Janus face? Acc Chem Res. 2007;40:335–342. doi: 10.1021/ar600012y. [DOI] [PMC free article] [PubMed] [Google Scholar]
- 29.Parveen A, Rizvi SH, Gupta A, et al. NMR-based metabonomics study of sub-acute hepatotoxicity induced by silica nanoparticles in rats after intranasal exposure. Cell Mol Biol (Noisy-le-grand) 2012;58:196–203. [PubMed] [Google Scholar]
- 30.Costa CS, Ronconi JV, Daufenbach JF, et al. In vitro effects of silver nanoparticles on the mitochondrial respiratory chain. Mol Cell Biochem. 2010;342:51–56. doi: 10.1007/s11010-010-0467-9. [DOI] [PubMed] [Google Scholar]
- 31.Tseng MT, Lu X, Duan X, et al. Alteration of hepatic structure and oxidative stress induced by intravenous nanoceria. Toxicol Appl Pharmacol. 2012;260:173–182. doi: 10.1016/j.taap.2012.02.008. [DOI] [PubMed] [Google Scholar]
- 32.Laskin DL, Laskin JD. Role of macrophages and inflammatory mediators in chemically induced toxicity. Toxicology. 2001;160:111–118. doi: 10.1016/s0300-483x(00)00437-6. [DOI] [PubMed] [Google Scholar]
- 33.Labib R, Turkall R, Abdel-Rahman MS. Endotoxin potentiates cocaine-mediated hepatotoxicity by nitric oxide and reactive oxygen species. Int J Toxicol. 2003;22:305–316. doi: 10.1080/10915810305117. [DOI] [PubMed] [Google Scholar]
- 34.Garrabou G, Moren C, Lopez S, et al. The effects of sepsis on mitochondria. J Infect Dis. 2012;205:392–400. doi: 10.1093/infdis/jir764. [DOI] [PubMed] [Google Scholar]
- 35.Pandya JD, Sullivan PG, Pettigrew LC. Focal cerebral ischemia and mitochondrial dysfunction in the TNFalpha-transgenic rat. Brain Res. 2011;1384:151–160. doi: 10.1016/j.brainres.2011.01.102. [DOI] [PMC free article] [PubMed] [Google Scholar]
- 36.Choumar A, Tarhuni A, Letteron P, et al. Lipopolysaccharide-induced mitochondrial DNA depletion. Antioxid Redox Signal. 2011;15:2837–2854. doi: 10.1089/ars.2010.3713. [DOI] [PubMed] [Google Scholar]


