

Abstract
The bHLH transcription factor Olig2 is expressed in cycling neural progenitor cells but also in terminally differentiated, myelinating oligodendrocytes. Sustained expression of Olig2 is counterintuitive because all known functions of the protein in expansion of neural progenitors and specification of oligodendrocyte progenitors are completed with the formation of mature white matter. How are the biological functions of Olig2 suppressed in terminally differentiated oligodendrocytes? In previous studies, we have shown that a triple serine motif in the amino terminus of Olig2 is phosphorylated in cycling neural progenitors but not in their differentiated progeny. We now show that phosphorylation of the triple serine motif regulates intranuclear compartmentalization of murine Olig2. Phosphorylated Olig2 is preferentially localized to a transcriptionally active “open” chromatin compartment together with coregulator proteins essential for regulation of gene expression. Unphosphorylated Olig2, as seen in mature white matter, is localized mainly within a transcriptionally inactive, chromatin fraction characterized by condensed and inaccessible DNA. Of special note is the observation that the p53 tumor suppressor protein is confined to the open chromatin fraction. Proximity ligation assays show that phosphorylation brings Olig2 within 30 nm of p53 within the open chromatin compartment. The data thus shed light on previously noted promitogenic functions of phosphorylated Olig2, which reflect, at least in part, an oppositional relationship with p53 functions.
Keywords: bHLH, intranuclear localization, NuRD complex, Olig2, p53, phosphorylation
Introduction
During embryonic CNS development, the bHLH transcription factor Olig2 functions to prevent premature cell cycle exit and sustains the replication of multipotent progenitor cells that give rise to neurons, such as motor neurons of the spinal cord (Lu et al., 2002; Zhou and Anderson, 2002). At later developmental stages, Olig2 is required for specification of the oligodendrocyte lineage in spinal cord and brain (Lu et al., 2002; Zhou and Anderson, 2002). Curiously, Olig2 is expressed at all stages of oligodendrocyte development from replication-competent progenitor cells to terminally differentiated, myelinating oligodendrocytes of the postnatal brain (Lu et al., 2000; Takebayashi et al., 2000; Zhou et al., 2000). Sustained expression of Olig2 in mature white matter is in marked contrast to other, purely neurogenic, bHLH transcription factors that are expressed in progenitor cells but never in mature neurons (Ross et al., 2003). How are the early functions of Olig2 in cell cycle control and fate choice of neural progenitors suppressed in mature white matter?
In previous studies, we described a developmentally regulated phosphorylation motif at positions S10, S13, and S14 in the amino terminus of Olig2 (Sun et al., 2011). This triple serine motif of Olig2 is phosphorylated in cycling neural stem cells and oligodendrocyte progenitor cells, but not in mature oligodendrocytes of postnatal white matter. Developmental control of this phosphorylation motif provides a potential means of regulating transcriptional functions of Olig2 during development. However, the location of the triple serine motif relative to the canonical, DNA-targeting bHLH motif of Olig2 gives rise to a mechanistic issue. Transcription factors within the bHLH family typically function as homodimers or heterodimers to bind canonical E-box promoter elements at target loci. Olig2 and also other bHLH factors (e.g., Neurogenin and Twist) have phosphorylation sites within the bHLH domain that regulate dimerization and interactions with key coregulator proteins (Firulli et al., 2007; Ma et al., 2008; Li et al., 2011). However, it is not self-evident how the phosphorylation state of the Olig2 triple serine motif, located >100 amino acids proximal to the DNA-targeting bHLH domain, might regulate these functions.
Beyond merely marking replication-competent, developmentally uncommitted, neural progenitors, phosphorylation of Olig2 at S10, S13, and S14 stimulates proliferation of these cells (Sun et al., 2011). The mitogenic function of the triple phosphoserine motif reflects, at least in part, an oppositional relationship to p53 (Mehta et al., 2011). Wild-type Olig2 and a triple phosphomimetic Olig2 (wherein negatively charged aspartate or glutamate residues are substituted for the three serines) suppress p53-mediated responses to γ irradiation and genotoxic drugs. By contrast, a triple phospho-null mutant of Olig2 (wherein neutral glycine or alanine residues replace the three serine residues) is equivalent to the Olig2-null state with respect to p53 function (Sun et al., 2011). The oppositional relationship between phosphorylated Olig2 and p53 has practical overtones for malignant glioma. We and others have shown that Olig2 is expressed in multiple grades of human glioma (Lu et al., 2001; Marie et al., 2001; Bouvier et al., 2003; Ohnishi et al., 2003; Ligon et al., 2004) and is essential for gliomagenesis in murine models of glioma (Ligon et al., 2007; Bao et al., 2008; Appolloni et al., 2012; Barrett et al., 2012). Studies with a “genetically relevant” murine model of high-grade human glioma point to the phosphorylated Olig2 as the active isoform in tumor formation and suppression of p53 function. Moreover, phosphorylated Olig2 is present in human gliomas (Sun et al., 2011).
In studies summarized here, we address a fundamental question about the promitogenic, anti-p53 functions of phosphorylated Olig2. Are these phosphorylation state-dependent biological activities of Olig2 actually linked to its bHLH-mediated activities as an E-box binding transcription factor? We first show that the promitogenic, anti-p53 functions of phosphorylated Olig2 do indeed require its transcriptional functions. However, the major impact of the triple serine motif phosphorylation state is not on E-box binding, but rather, on segregation of Olig2 within the nucleus into separate compartments of transcriptionally active (open) and relatively inactive (condensed) chromatin.
Materials and Methods
Animal procedures, tissue harvest, and cell culture.
Animal husbandry was performed according to Dana-Farber Cancer Institute guidelines under Institutional Animal Care and Use Committee-approved protocols. The strains used have been described previously (Lu et al., 2002). Neural progenitor cells were isolated from the lateral ganglionic eminence of E13.5 embryos of either sex from timed-pregnant mice using techniques previously described (Qian et al., 1998). Cells were expanded as spheres in tissue culture dishes coated with poly(2-hydroxyethyl methacrylate) (Sigma) or grown as adherent cultures on laminin (Sigma) in DMEM and F12 supplemented with B27 and N2 (Invitrogen) in the presence of 20 ng/ml EGF (Millipore) and 20 ng/ml bFGF (Millipore) (Ligon et al., 2007; Sun et al., 2011). To induce neural progenitor cell differentiation, EGF and bFGF were withdrawn and cells were allowed to differentiate for 16 h in media containing DMEM, F12, and B27 supplement. Neural progenitor cell lines transduced with retroviruses containing various constructs of Olig2 were maintained in media as described above, in the presence of 2 μg/ml blasticidin.
Retroviral vectors and virus production.
Olig2 constructs containing triple phosphorylation motif variants and DNA binding mutations were generated using QuikChange Site-Directed Mutagenesis (Stratagene) (Sun et al., 2011). Full-length mouse Olig2, its various mutants, or eGFP were cloned into the pWZL-BLAST retroviral vector as previously described (Sun et al., 2011). Retroviruses were generated in 293T cells by transfection with packaging plasmids encoding VSVG, gag-pol, and the retroviral vector (pWZL) encoding the Olig2 construct of interest.
Secondary neurosphere assay.
Olig2-null neural progenitor cells were transduced with retroviruses containing various mutants of Olig2. Transduced cells were selected with blasticidin for 7 d. Primary transduced neurospheres were dissociated into single cells and replated at 10 cells/μl in 6-well plates for secondary neurosphere formation assays. Total viable cells were counted with hemocytometer using 0.2% trypan blue exclusion. The neurosphere images were taken using a 2× objective on a Nikon Eclipse TE200.
Immunoblotting.
Immunoblotting was performed according to standard protocols using rabbit polyclonal Olig2 antibody (Arnett et al., 2004), monoclonal mouse Olig2 antibody (Arnett et al., 2004), phospho Olig2 antibody (Sun et al., 2011), and antibodies directed against p21 (BD Biosciences Pharmingen), acetyl-p53 (Lys379, 2570, Cell Signaling Technology), phospho-p53 (Ser15, 9284, Cell Signaling Technology), total p53 (2524, Cell Signaling Technology), Olig1 (our laboratory), histone H3 (Ab1791, Abcam), p300 (05–257, Millipore), LDH (Ab103804, Abcam), Histone deacetylase 1 (Hdac1) (2062, Cell Signaling Technology), Metastasis-associated protein 2 (Mta2) (Ab8106, Abcam), Nuclear factor 1 (Nf1) (Ab72602, Abcam), and Vinculin (V9131, Sigma-Aldrich).
Chromatin immunoprecipitation (ChIP).
Mouse neural progenitor cells transduced with various mutants of Olig2 were plated at a density of 10 cells μl and cultured on laminin-coated 6-well plates (Pollard et al., 2009). Cells were crosslinked with 1% formaldehyde for 10 min at room temperature, and the reaction was quenched with 125 mm glycine for 5 min at room temperature. Cells were harvested in ice-cold PBS and sonicated in 300 μl SDS lysis buffer. For immunoprecipitation, 50 μl protein A Dynabeads (Invitrogen) were incubated with Olig2 or control antibody for at least 4 h at 4°C. Precleared chromatin and antibody-bound beads were incubated overnight at 4°C. Beads were washed six times in RIPA wash buffer and twice in tris-EDTA. After overnight reverse crosslinking at 65°C in reverse crosslinking buffer (200 mm NaCl, 1% SDS, and 0.1 m NaHCO3), immunoprecipitated DNA was subjected to PCR cleanup (QIAGEN) and eluted in ddH2O. Chromatin-immunoprecipitated DNA was analyzed by quantitative PCR in a real-time PCR system (Applied Biosystems) using SYBR Green mix. Presented data are ΔCT values normalized for WT promoter occupancy. The following primers were used: Egfr, 5′-GTGGTCCCAATTTCCTGCTG-3′ and 5′-ATGGAGCTCATGGACCTCATTG-3′; Fgfr3, 5′-TAGACCCCCACCGAAGTCAA-3′ and 5′-GACTGTCTACCAGCACGCTT-3′; Wnt5a, 5′-TCTCGCTCTGTTCTCTCTGGA-3′ and 5′-CTTGAGCGGTTGATGGACAG-3′; p21 (Olig2), 5′-AGGTCAGCTAAATCCGAGGAGGAA-3′ and 5′-TCCTGCTTTGGAGAAGCTGTGAGT-3′; Tgfβ2, 5′-CTCCTGCAGCTCTGTTGTGA-3′ and 5′-TTTATTTCTTTGCTTGCTTGCTTT-3′; Epha2, 5′-ATCCCATTCACCCCACACAC-3′ and 5′-GTCACCAGGCTTTCAGCTCT-3′; p21 (p53), 5′-GGTCCCTTGGATTTCCTTTC-3′ and 5′-CTTCAATTCCAGGGCTGAAC-3′.
Quantitative PCR.
For qPCR analysis, RNA was isolated using Trizol. After RNeasy Mini kit (QIAGEN) cleanup, 1 μg of RNA was used for cDNA synthesis with Superscript III reverse transcriptase (Invitrogen). TaqMan assays were performed for target genes and controls (beta-actin and ubiquitin C) on 100× diluted cDNA template.
ChIP library construction and sequencing.
Library construction and sequencing on immunopurified DNA fragments and control (input) samples were performed according to standard guidelines of Bejing Genomics Institute. Briefly, the end repair of ChIP-enriched DNA was performed using T4 DNA polymerase, Klenow DNA polymerase, and T4 polynucleotide kinase to generate blunt ended fragments. The addition of ‘A’ bases was done using Klenow fragments (3′ to 5′ exo minus) to generate DNA fragments for ligation with adapters, which have single ‘T’ base overhangs at their 3′ end. Adapters were ligated to the DNA fragments using DNA ligase. Adapter-modified DNA fragments were amplified by PCR (15 cycles) and size selected (200 ± 25 bp) by running PCR products on 2% agarose gel and purifying using QIAGEN Gel Extraction Kit (QIAGEN). The libraries were validated, and clusters generated on flow cells were sequenced using a HiSeq 2000 analyzer (Illumina).
ChIP-Seq analysis.
Sequence reads were aligned to the mouse genome (mm9) using Bowtie (“bowtie -m 1 –S”). Peak calling was performed using MACS2 (Model-based Analysis of Chip-Seq) using default parameters (Zhang et al., 2008) on alignment results. MACS2 indicated ChIP DNA fragment size as 136 bp for TPM, 167 bp for TPN, and 164 bp for WT. Predicted peaks were then assigned to genes within 30,000 bases of transcription start sites using Peak2Gene tool in the Cistrome platform (Liu et al., 2011). Motif analysis was performed in 600 bp windows with a p value cutoff of 0.001 on top 5000 peaks for WT, TPN, and TPM ChIP-Seq samples using SeqPos motif tool in Cistrome (He et al., 2010). Quality control on sequencing reads was performed using FastQC. In addition, reads mapping ratio, redundant ratio (ratio of multiple reads mapped to the same genomic location), and conservation at predicted Olig2 binding sites were analyzed to further ensure ChIP-Seq data quality.
RNA-Seq library preparation and sequencing.
RNA was isolated from ∼10 million cells using Trizol followed by RNeasy Mini kit (QIAGEN). Samples were subjected to hybridization with Locked Nucleic Acid probes specific for abundant ribosomal RNA molecules. Unwanted rRNA was separated using RiboMinus Magnetic Beads. The RiboMinus- enriched RNA sample was then used for cDNA library preparation using GenomePlex Complete WGA Kit (Sigma). Each cDNA library was sequenced at the Dana-Farber Center for Cancer Computational Biology on an Illumina Genome Analyzer II following the manufacturer's protocol.
RNA-Seq analysis.
Raw 50 bp paired-end sequence data were quality controlled with FastQC using Galaxy platform. Sequence reads were groomed and trimmed to increase per base sequence quality by Trim Sequences tool and Filter By Quality tool using a cutoff for quality score of >30. Sequences were mapped to NCBI37/mm9 using Tophat 1.4.1 with min anchor 8, splice mismatches 0, min report intron 50, max report intron 500,000, min isoform fraction 0.15, max multihits 20, segment length 19, segment mismatches 2, min closure exon 100, min closure intron 50, max closure intron 5000, min coverage intron 50, max coverage intron 20,000, min segment intron 50, and max segment intron 500,000 with the exception of segment length of half the average read length of cleaned data (Langmead et al., 2009). Aligned reads were then processed by RNA-Seq analysis program Cufflinks using the Cistrome platform (Trapnell et al., 2010; Liu et al., 2011). Assuming the total transcriptional activity is comparable between different datasets, the obtained data (data units in RPKM, reads per kilobase exon model per million mapped reads) were analyzed using Cuffdiff to find significant changes in transcript expression (settings: Perform quartile normalization and bias correction, FDR = 0.05). The output file “gene differential expression testing” was used to sort for significant differentially expressed genes.
Electrophoretic mobility shift assay (EMSA).
Double-tagged Olig2 protein was purified from Cos7 cells by immunoprecipitation with V5 antibody (Sigma) and V5 peptide (Sigma) elution, followed by immunoprecipitation with Ni-NTA beads (QIAGEN) and elution in 200 mm imidazole. Purified Olig2 protein was quantified by silver stain against known concentrations of BSA protein. Oligonucleotides used for EMSA were as follows: AGCTAATTTCCCAGATGGGCCAA and AGCTTTGGCCCATCTGGGAAATT (Hb9), AGCTAGAAGACAGCTGTTGGAAG and AGCTCTTCCAACAGCTGTCTTCT (Mycn). Oligonucleotides were annealed in annealing buffer (10 mm Tris HCl pH 7.5, 50 mm NaCl, 1 mm EDTA) using a thermocycler for 5 min at 95°C, and allowed to cool to room temperature for 1 h. Annealed probe was labeled with [α-32p] 6000 Ci/mmol dCTP (PerkinElmer) using Klenow (New England Biolabs). Radioactive DNA probe was incubated with 2 ng Olig2 protein in binding buffer (20 mm Tris-HCl pH 7.5, 5 mm MgCl2, 0.1% NP40, 0.5 mm DTT, 10% glycerol) for 30 min at 4°C. Protein:DNA complexes were analyzed on 4% nondenaturing PAGE for 30 min at 4°C.
Subcellular fractionation.
Primary mouse neural progenitor cells were centrifuged at 1000 rpm to collect cell pellets. Cell pellets were treated with hypotonic buffer (10 mm HEPES, pH 7.9, 1.5 mm MgCl2, 10 mm KCl) and centrifuged at 5000 × g to collect nuclei. Supernatant was treated with 0.11 volume 10× cytoplasmic extract buffer (0.3 m HEPES, 1.4 m KCl, 30 mm MgCl2). Cell nuclei were incubated in mild salt buffer (20 mm HEPES, pH 7.9, 10% glycerol, 1.5 mm MgCl2, 0.2 mm EDTA, 150 mm KCl) for 10 min and rotated for 10 min at 4°C. The open nuclear protein fraction was collected by centrifugation at 10,000 × g. Chromatin-bound proteins were extracted from the resulting pellet by incubation with 4 units/ml micrococcal nuclease (Sigma) in MNase buffer (20 mm Tris-HCl, pH 7.5, 100 mm KCl, 3 mm MgCl2, 1 mm CaCl2) for 10 min on ice. The reaction was quenched by addition of 2 mm EDTA in buffer B (50 mm Tris-HCl, pH 7.5, 0.05% NP40, 100 mm KCl, 10% glycerol), followed by centrifugation at 20,000 × g for 10 min to separate chromatin-bound proteins from the insoluble fraction. All buffers were supplemented with EDTA-free protease inhibitors (Roche), 1 mm NaVO4, 5 mm NaF, 1 mm Na4P2O7, 25 mm β-glycerophosphate, and 0.5 mm PMSF.
Tandem affinity purification and mass spectrometry analysis.
Subcellular fractions from Olig2-null mouse neural progenitor cells transduced with Flag and HA-tagged Olig2 were prepared as described above. Tandem affinity purification (TAP) was performed by M2 Flag affinity gel-based purification and 0.5 mg/ml 3× Flag peptide (Sigma) elution in buffer B (see above), followed by HA affinity gel capture (Santa Cruz Biotechnology). Finally, protein complexes were eluted in 0.5 mg/ml HA peptide (Covance) in elution buffer (50 mm Tris-HCl, pH 7.5, 0.01% NP40, 100 mm KCl, 10% glycerol), and 10% of the eluted fraction was separated on SDS 4–12% Bis-Tris polyacrylamide gradient gels (Invitrogen) and visualized by silver stain with Silver Quest staining kit (Invitrogen) (Nakatani and Ogryzko, 2003). Purified protein complexes were analyzed by mass spectrometry as described previously (Ficarro et al., 2009; Adelmant et al., 2012). Proteins identified across three independent tandem-affinity purifications were filtered against a list of contaminants identified in 108 negative control TAP experiments (Rozenblatt-Rosen et al., 2012). Proteins identified in a control TAP experiment performed on extracts prepared from control WT cells were also removed. Finally, the list of specific Olig2 binding partners was annotated to identify proteins associated with the GO term “regulation of transcription, DNA-dependent” (GO 0006355) and its children.
Immunoprecipitation.
Olig2-null mouse neural progenitor cells were transduced with a retrovirus encoding V5-tagged Olig2 constructs. Subcellular fractions were generated as described above, and each fraction was incubated with V5 (Sigma) or Myc (Sigma) antibodies overnight at 4°C. Antibody-bound fractions were washed four times in buffer B (see above) over a bio-spin column (Bio-Rad) and incubated with 0.5 mg/ml V5 peptide for 30 min at 4°C. Immunopurified fractions were collected by centrifugation at 5000 × g for 1 min at 4°C and size-separated by standard SDS-PAGE followed by immunoblotting.
Endogenous pulldown from mouse neural progenitor cells was performed using protein A Dynabeads (Invitrogen) incubated with antibodies directed against Hdac1 (Ab7028, Abcam), Mta2 (Ab8106, Abcam), or control rabbit IgG (12–370, Millipore). Beads were washed twice in buffer B and once in buffer B supplemented with 300 mm KCl. After washing, protein complexes were eluded from the beads with 1× SDS-PAGE sample buffer.
Immunofluorescence.
Mouse neural progenitor cells transduced with retrovirus encoding various Olig2 constructs were plated on poly-l-ornithine coated coverslips in 24-well plate at 20 cells/μl per well. After 72 h, cells were fixed with 4% paraformaldehyde. Coverslips were incubated with 5% normal goat serum (NGS) and 0.2% Tween 20. Primary antibody solutions were applied for 1 h at room temperature, followed by secondary antibody staining for 30 min at room temperature, and briefly exposed to DAPI for nuclear staining. Coverslips were mounted on slides with fluoromount G and analyzed with a Zeiss Axio Observer Z1.
Proximity ligation assay.
Cells were seeded on laminin-coated coverslips at a density of 20 cells/μl in 24-well plates in growth factor containing media. The following day, media was removed and wells were rinsed twice with PBS to remove any residual growth factors. Fresh media containing DMEM, F12, and B27 supplement without N2 supplement or growth factors was added. After 16 h, cells were fixed with 4% PFA for 10 min. The coverslips were then rinsed twice with PBS and blocked for 35 min at room temperature in blocking buffer containing 5% NGS and 0.2% Triton X-100 in PBS. The coverslips were incubated with rabbit polyclonal Olig2 antibody (Arnett et al., 2004) and mouse monoclonal p53 antibody (2524, Cell Signaling Technology). The next day, coverslips were incubated with Duolink PLA Rabbit Plus and PLA Mouse Minus proximity probes (Olink Bioscience), and proximity ligation was performed using Duolink Red detection reagents as per the manufacturer's protocol. Fluorescence was detected using Leica TCS SPE confocal microscope. Z-section images were acquired using the Leica digital camera and LAS AF software. Z-stack images were reconstructed using maximum projection to obtain all proximity ligation assay (PLA) foci distributed throughout the nucleus. Individual foci were counted using ImageJ software. Total number of fluorescent signal from proximity ligation were counted per image and divided by the total number of nuclei to obtain the total foci/nucleus value. Experiments were repeated three times, and for each condition between 80 and 400 nuclei were counted.
Statistical analysis.
For each experiment, data were collected from at least three biological repeats and analyzed by one-way ANOVA with post hoc Tukey test or Student's t test, as indicated.
Results
Promitogenic, anti-p53 functions of the N-terminal triple phosphoserine motif in Olig2 require E-box binding
To determine whether the promitogenic and/or anti-p53 functions of the triple phosphoserine motif depend on Olig2 DNA binding, we mutated a single amino acid in the basic domain of Olig2 (N114H or ΔOlig2; Fig. 1A). We used retroviral expression vectors to reintroduce either WT Olig2 or ΔOlig2 into proliferating Olig2-null neural progenitor cells. As shown by immunoblot analysis with a pan-Olig2 antibody, ΔOlig2 is expressed at levels comparable with WT Olig2 (Fig. 1B). Moreover, immunoblotting with a specific antibody targeted to the triply phosphorylated serine motif (Sun et al., 2011) showed that the triple serine motif on the ΔOlig2 mutant is phosphorylated at levels comparable with WT Olig2 (Fig. 1B). In addition, ΔOlig2 is correctly targeted to the cell nucleus as shown by immunofluorescence staining with the pan-Olig2 antibody (Fig. 1C). However, as shown by EMSA, ΔOlig2 cannot bind to canonical E-box promoter/enhancer elements (Fig. 1D).
Figure 1.

Single amino acid mutation abrogates DNA binding. A, Schematic representation of mouse Olig2 protein. Asparagine residue N114 is located in the basic domain. B, Olig2-null mouse neural progenitor cells expressing Olig2 WT or N114H mutation (ΔOlig2) show comparable levels of triple phosphorylation, as shown by immunoblot with phosphorylation state-specific antibody. C, Olig2-null mouse neural progenitor cells were transduced with Olig2 WT or ΔOlig2. Immunofluorescence staining shows that ΔOlig2 (green) maintains nuclear localization (DAPI, blue). Scale bar, 10 μm. D, ΔOlig2 was purified from Cos7 cells and incubated with radioactive DNA probe containing E-box element CAGATG from the Hb9 promoter. Olig2 WT shifts Hb9 probe in a dose-dependent matter. In contrast, ΔOlig2 is not able to shift Hb9 probe.
The transduced neural progenitor cells together with vector controls were then challenged with γ irradiation. Total cells in irradiated and control cultures were counted at 6 d after irradiation. As shown (Fig. 2A,B), WT Olig2 protects from γ irradiation as noted previously (Mehta et al., 2011), but ΔOlig2 does not. On a mechanistic level, WT Olig2, but not ΔOlig2, suppresses the interaction of p53 with the p21 promoter as shown by ChIP-PCR assay (Fig. 2C). We note that ΔOlig2 actually promotes the p53:p21 interaction compared with eGFP control cells. A potential mechanism whereby ΔOlig2 extends its effects to Olig2 dimerization partners might be in play here.
Figure 2.
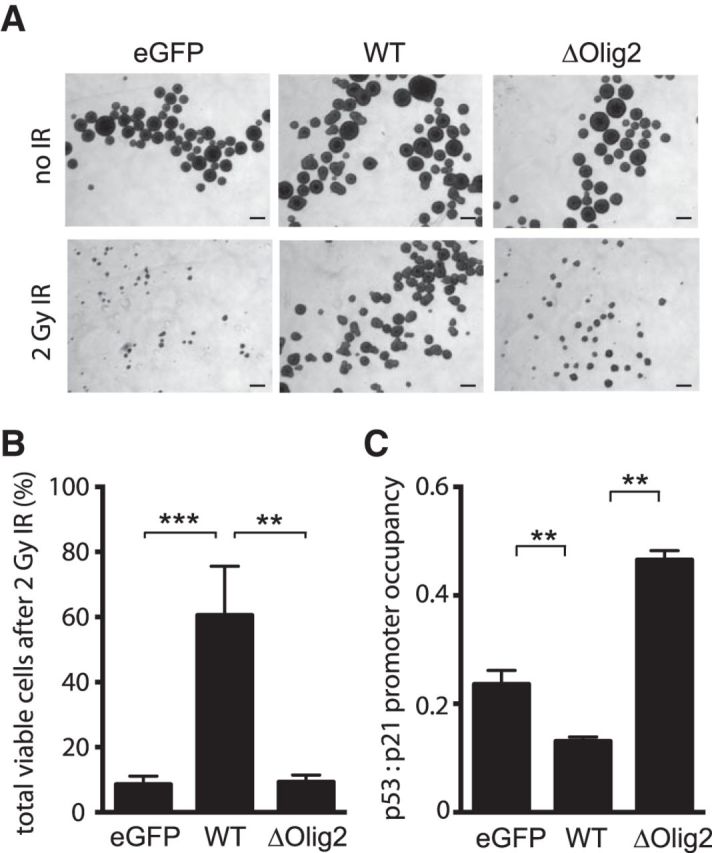
Anti-p53 functions are dependent on Olig2:DNA interaction. A, Radiation-induced cell death. Olig2-null mouse neural progenitor cells were transduced with Olig2 WT, ΔOlig2, or eGFP (control). Cells were plated at 10 cells μl in 6-well plates and treated with or without 2 Gy irradiation. Images were taken 6 d after plating. Scale bar, 100 μm. B, Quantification of radiation-induced cell death. Viable cell counts, after 2 Gy irradiation, are normalized to cells without irradiation treatment, as an index for neurosphere proliferation. Data presented are from three independent experiments. Error bars indicate SD. **p < 0.01 (one-way ANOVA). ***p < 0.001 (one-way ANOVA). C, Suppression of p53 transcription function. Cell lysates from mouse neural progenitor cells expressing Olig2 WT, ΔOlig2, or control vector (eGFP) were processed for ChIP with p53 antibody. Bar graph represents qPCR analysis of p53 binding to p21 promoter region, calculated over ChIP input. Data shown are three independent repeats. Error bars indicate SEM. **p < 0.01 (Tukey's test).
To further probe the link between amino terminal phosphorylation and Olig2 transcriptional functions, we cloned the DNA binding mutation into Olig2 constructs containing a WT, triple phospho-null (TPN) or triple phospho-mimetic (TPM) element at the N-terminal. These various constructs were transduced into Olig2-null neural progenitors, and the resulting cell lines were assessed for proliferation in culture. As shown in Figure 3A, B, the phosphorylation state of the N-terminal triple serine motif is irrelevant to cell proliferation when Olig2 cannot bind to E-box elements. Collectively, these studies show that the promitogenic and anti-p53 functions of the triple phosphorylation motif noted in previous studies are intimately linked to the ability of Olig2 to recognize canonical E-box promoter/enhancer elements.
Figure 3.

Mitogenic function of the triple phosphorylation motif requires DNA binding. A, Olig2-null neural progenitor cells were transduced with retroviral vectors encoding eGFP, WT, TPN, TPM or ΔWT, ΔTPN, ΔTPM constructs of Olig2. Cells were plated at 10 cells μl in 6 well plates, and representative images were taken 6 d after plating. Scale bar, 100 μm. B, Cell counts from neurosphere assays were normalized to control (eGFP). Inset, Total and phospho-Olig2 protein levels in all cell lines analyzed. Data represent average from three independent repeats. tOlig2, Total Olig2; pOlig2, phospho-Olig2. Error bar indicates SD. p < 0.001 (one-way ANOVA). **p < 0.01 (Tukey's multiple-comparisons test). ***p < 0.001 (Tukey's multiple-comparisons test). n.s., Not significant.
Differential expression profiles dictated by TPN and TPM mutants of Olig2
Does the phosphorylation state of the triple serine motif impact gene expression? To address this question, we again used Olig2-null neural progenitors that had been transduced with the WT, TPN, or TPM variants of Olig2 (Fig. 4A). Cells were cultured in the presence of EGF and bFGF, and expression profiles were then captured by RNA-Seq. Relative to Olig2 TPN-expressing progenitors, we identified 526 genes that were repressed by the Olig2 TPM mutant and another 400 genes that were upregulated (Fig. 4B; raw data in FASTQ format are available on NCBI Sequence Read Archive, accession number SRP040688). A subset of target genes identified by RNA-Seq as being activated by Olig2 TPM is associated with enhanced growth/proliferation (Doetsch et al., 2002; Young et al., 2010). The activation of this subset by Olig2 TPM was independently validated by quantitative PCR (Fig. 4E, red). Likewise, we used quantitative PCR for independent validation of a subset of target genes that are potentially antiproliferative (Aoki et al., 2004; Roussa et al., 2006) and are repressed by Olig2 TPM (Fig. 4E, blue). The latter list includes the p53-response gene, p21, shown previously to be repressed by Olig2 TPM relative to TPN (Sun et al., 2011). We conclude that the phosphorylation state of the amino terminal motif regulates the expression profile of Olig2 target genes in ways that are consistent with the promitogenic function of phosphorylated Olig2.
Figure 4.
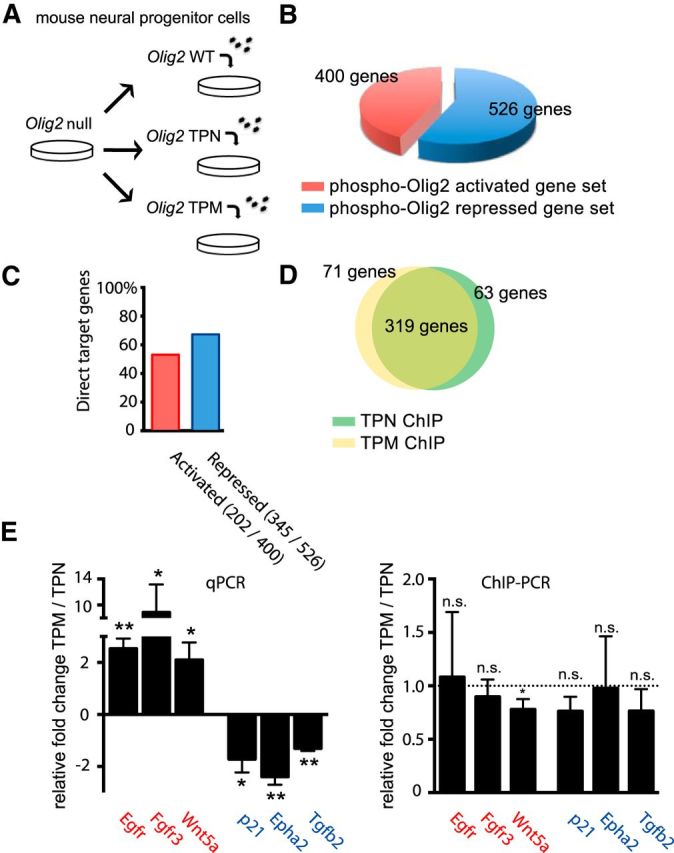
Olig2 phosphorylation regulates gene expression but not DNA targeting in mouse neural progenitor cells. A, Schematic overview of experimental design. Olig2-null mouse neural progenitor cells were transduced with Olig2 WT, TPN, or TPM. Cells were plated at 10 cells/μl and harvested under proliferating conditions. B, Expression profiles are a function of phosphorylation state. RNA was isolated from TPN or TPM mouse neural progenitor cells using Trizol and sequenced on Hiseq 2000 (Illumina). Sequencing results were directly compared using Cuffcompare, part of Cufflinks (Trapnell et al., 2010). Genes shown are upregulated or downregulated between TPN and TPM in a statistically significant manner. C, A majority of phosphorylation state-dependent genes are direct target genes of Olig2. Olig2 WT cell lysates were processed for ChIP with total-Olig2 antibody. Sequencing was performed on Hiseq 2000 (Illumina). Comparison of direct Olig2 target gene sets and differentially expressed gene sets (B) shows >50% overlap for activated and repressed genes. D, Direct genetic targets of Olig2 TPN and Olig2 TPM are largely equivalent. Olig2 TPN and Olig2 TPM cells were harvested and processed for Olig2 ChIP. Venn diagram represents overlapping direct target genes for TPN and TPM using the differentially expressed genes (C). As indicated, ∼80% (319/(319 + 71) genes) of the Olig2 TPM targets are also recognized by Olig2 TPN and vice versa. E, Validation of RNA-Seq and ChIP-Seq targets. Directed qRT-PCR (left graph) and ChIP-PCR (right graph) results confirm set of direct targets that are activated (i.e., Egfr, Fgfr3, Wnt5a) or repressed (i.e., p21, Epha2, Tgfb2) by Olig2 triple phosphorylation. Bar graphs represent fold change of TPM over TPN of three independent repeats. Error bar indicates SD. n.s., Not significant. *p < 0.05 (unpaired t test, two-tailed). **p < 0.01 (unpaired t test, two-tailed).
Target gene binding is unaffected by Olig2 triple phosphorylation
To determine whether Olig2 phosphorylation regulates gene expression through differential binding to its target genes, we performed genome-wide ChIP-Seq analysis on the WT, TPM, and TPN cell lines. Of note, our high-affinity pan-Olig2 antibody used for the ChIP step of this work reacts equally well with all three variants of Olig2 (data not shown). The absolute number of target genes detected in ChIP protocols is somewhat arbitrary and contingent upon thresholds set for peak calling. Using an established peak-calling algorithm (Feng, et al., 2012), we arrived at a list of candidate target genes where more than half of the TPN/TPM differentially expressed genes from Figure 4B are encoded by loci that also possess Olig2 binding sites (Fig. 4C). As with our RNA-Seq data, the full cohort of Olig2 binding genes detected by ChIP-Seq is available online in the NCBI Sequence Read Archive (accession number SRP040688).
As shown in Figure 4D, >80% of the TPN direct target genes are shared by TPM. To validate the ChIP-Seq dataset, we performed directed ChIP-PCR on a subset of genes that are differentially expressed in the TPN cells relative to TPM. As shown in Figure 4E, six genes, which are clearly differentially regulated in TPM cells relative to TPN, show no difference in target gene DNA-binding between TPN and TPM.
The bHLH group of transcription factors typically recognizes the E-box motif (CANNTG) in promoter/enhancer regions of their target genes. In a final test of whether Olig2 phosphorylation changes target gene binding, we analyzed direct protein:DNA interaction using EMSAs. Our ChIP-Seq data suggest that the preferred E-box for Olig2 in mouse neural progenitor cells is CAGCTG (data not shown). We constructed a gel mobility shift probe containing this preferred E-box derived from the Mycn promoter region. We also constructed a second probe containing a variant E-box (CATCTG) from the Hb9 promoter, a biologically relevant target of Olig2 in the developing spinal cord (Lee et al., 2005). As indicated in Figure 5, purified Olig2 TPN and TPM show comparable affinity for the Hb9 and Mycn probes and no interaction with negative control probes that had been mutated so as to disrupt the canonical E-box elements.
Figure 5.
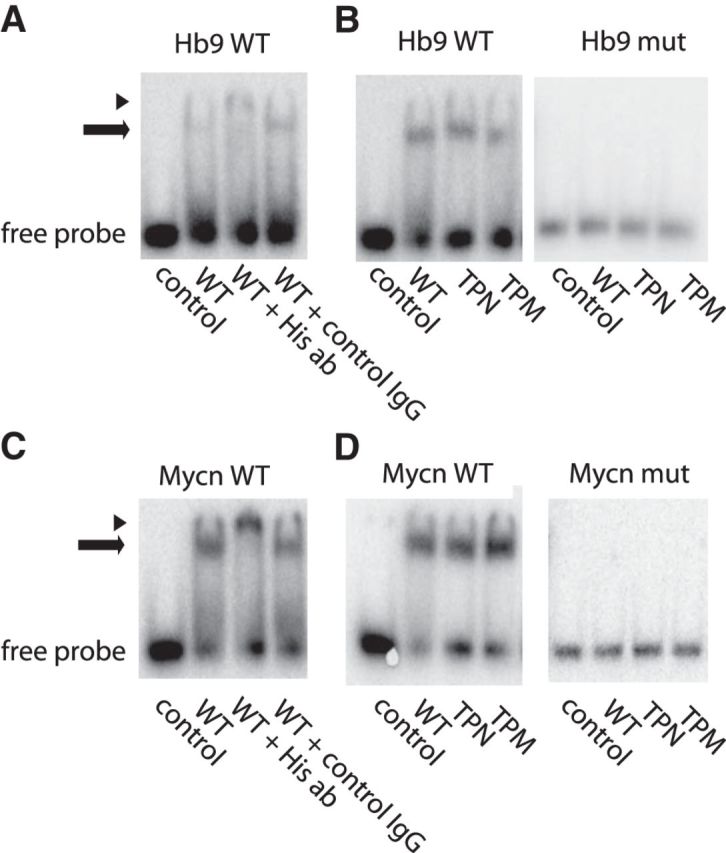
Olig2 phosphorylation does not alter E-box recognition. A, V5 and His-tagged Olig2 WT were transfected into Cos7 cells and subjected to V5 and His tag tandem purification. Purified Olig2 WT protein was incubated with radioactive DNA probe containing E-box element CAGATG from the Hb9 promoter, in the presence of His tag (or control) antibody, and binding was assessed in EMSA. B, Purified Olig2 WT, TPN, or TPM was incubated with Hb9 probe, or Hb9 mutant containing mutated E-box TAGACT, and analyzed in EMSA. The “supershift” with His antibody in A confirms the presence of Olig2 in the shifted band. C, D, Same as in A, B using Mycn instead of Hb9 probe. Arrow indicates shift. Arrowhead indicates supershift.
As noted in Figure 4D, whole-genome ChIP-Seq did show a small percentage of Olig2 binding sites (∼20%) that interact differentially with TPM and TPN. We selected 24 of these sites for closer scrutiny by ChIP-PCR. The dedicated ChIP-PCR studies validated all 24 of these sites as DNA binding targets for Olig2 but did not support differential binding by Olig2 TPM and TPN (data not shown). Collectively, these data demonstrate that phosphorylation of the amino terminal motif does not alter the ability of Olig2 to recognize and interact with canonical E-box elements on target genes.
Triple phosphorylation motif regulates intranuclear compartmentalization
Eukaryotic chromatin exists in two states: open and condensed. These two compartments, and their associated proteins, can be resolved one from the other by salt extraction and enzymatic digestion (Sanders, 1978). The most soluble fraction contains highly accessible chromatin that is transcriptionally active (Davie and Saunders, 1981; Rocha et al., 1984; Henikoff et al., 2009). Transcription factors, their coregulators, and RNA polymerase II are mainly associated with the open chromatin fraction (Kamakaka and Kadonaga, 1994; Orphanides and Reinberg, 2000; Mito et al., 2005).
To determine whether the phosphorylation state of the triple serine motif modulates intranuclear compartmentalization of Olig2, we lysed WT neural progenitor cells in hypotonic buffer to separate cytosol from nuclei. Nuclear proteins were further resolved into open and chromatin-bound pools by fractionation with mild salt buffer and micrococcal nuclease. As indicated (Fig. 6A), total Olig2 is evenly distributed over both intranuclear protein fractions. However, immunoblotting with the phosphorylation state-specific antibody shows that the ratio of phosphorylated Olig2 to total Olig2 is dramatically different in the two nuclear compartments, with phosphorylated Olig2 being enriched in the open compartment (Fig. 6B). We confirmed the impact of the phosphorylation motif on intranuclear localization of Olig2 by transducing Olig2-null neural progenitor cells with Olig2 TPN or TPM. As shown in Figure 6C, the TPM/TPN Olig2 ratios are again quite different in the two nuclear compartments with Olig2 TPM being enriched in the open compartment.
Figure 6.
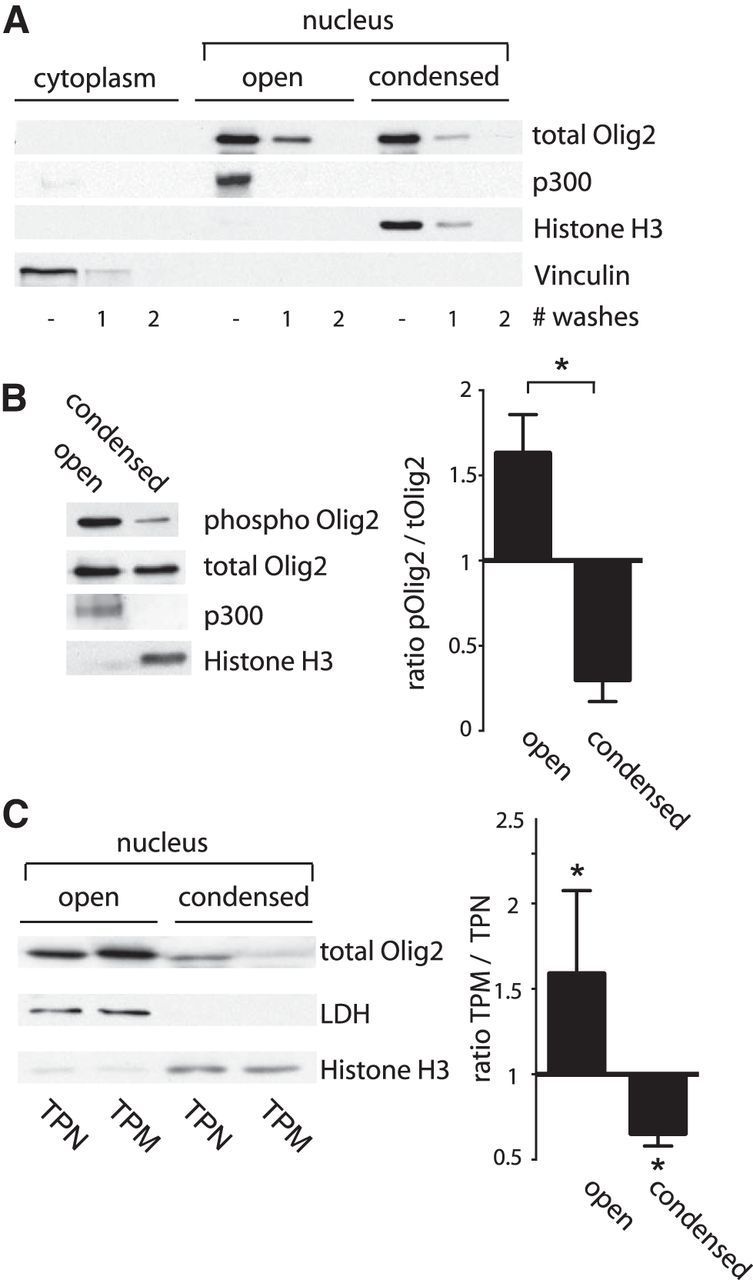
Olig2 phosphorylation regulates intranuclear localization. A, Subcellular distribution of Olig2. Mouse neural progenitor cells (Olig2 WT) were plated at 10 cells/μl and collected under proliferating conditions. Cells were lysed in hypotonic buffer to collect cytoplasmic fraction. Nuclear proteins were separated into open and condensed chromatin fractions using medium salt buffer and micrococcal nuclease. After collecting each fraction, the pellet was washed twice to wash out all residual proteins. Immunoblots were probed with antibodies against p300 (open), histone H3 (condensed), and Vinculin (cytoplasmic fraction) to assess fraction purity. Olig2 is evenly distributed over open and condensed nuclear compartments. B, Western blot analysis with phosphorylation state-specific antibody shows that phosphorylated Olig2 is most abundant in the open chromatin fraction. Most Olig2 protein in condensed fraction is unphosphorylated. Bar graph represents ratio phosphorylated Olig2/total Olig2 in open and condensed fractions. C, Subnuclear fractions were generated from Olig2-null mouse neural progenitor cells transduced with retrovirus encoding TPN or TPM Olig2 construct. Accompanying bar graph represents quantification of three independent experiments. LDH, Lactate dehydrogenase (loading control). Error bar indicates SD. *p < 0.05 (unpaired t test, two-tailed).
Phosphorylated Olig2 and nonphosphorylated Olig2 have differential access to compartment-specific coregulator proteins
In complex with E-box elements, dimers or heterodimers of bHLH transcription factors associate with coregulator proteins to regulate expression of their target genes. To identify potential Olig2 coregulator proteins, we transduced Olig2-null mouse neural progenitor cells with a doubly tagged (FLAG and HA) Olig2 WT construct (Nakatani and Ogryzko, 2003). Using tandem affinity purification, we obtained highly purified preparations of Olig2 and associated proteins (Fig. 7A). Importantly, this material was prepared from cell nuclei that had been processed to include proteins from both the open and condensed chromatin fractions. Proteins associated with Olig2 in the antibody pulldown preparations were identified by mass spectrometry. To identify high-confidence Olig2 binding partners, we only considered proteins identified in at least 2 of 3 purifications. We further excluded proteins identified in a control purification performed during this study, as well as any protein identified in >1% of a large set of negative control TAP experiments. To focus on Olig2 binding partners involved in transcription, we further restricted this candidate list to proteins annotated as DNA-dependent transcriptional regulators.
Figure 7.
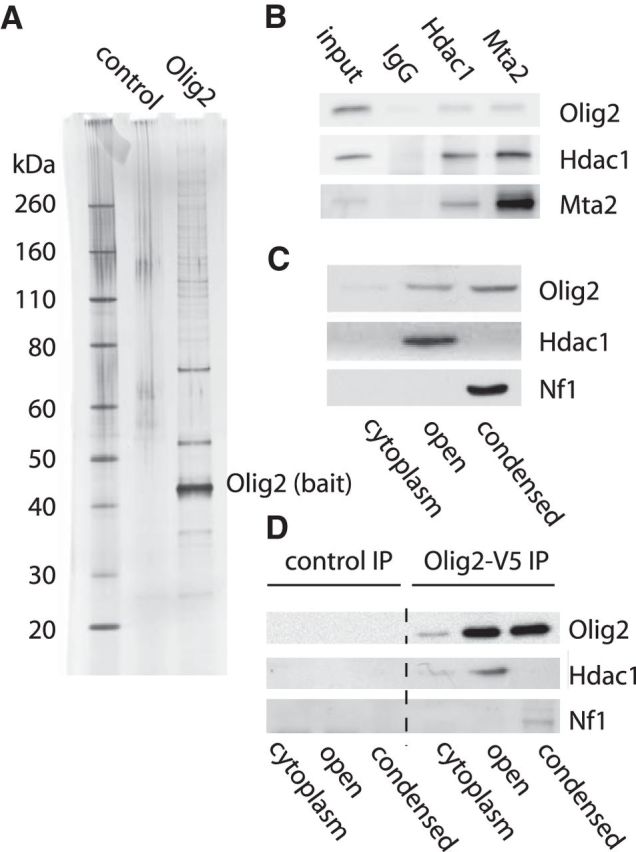
Olig2 triple phosphorylation controls access to coregulator proteins. A, Purification of Olig2 and associated coregulators by tandem antibody purification. Olig2-null mouse neural progenitor cells were transduced with a double-epitope tagged (FLAG and HA) Olig2 construct. Cell lysates were collected under proliferating conditions and subjected to FLAG pulldown followed by HA pulldown. Silver stain shows Olig2 and its protein coregulator complex separated on 4%–12% SDS-PAGE gel. B, Cell lysates of WT mouse neural progenitors were processed for immunoprecipitation with control IgG, Hdac1, or Mta2 antibody. The immunprecipitated samples were analyzed by Western blotting for interaction with endogenous Olig2. C, Intranuclear distribution of Olig2-associated proteins. Hdac1 is mainly present in the open compartment, as demonstrated by immunoblot. Nf1 is preferentially localized in the condensed pool. D, Olig2 interacts with coregulator proteins in open and also condensed chromatin fractions. Olig2-null mouse neural progenitor cells were transduced with WT Olig2–V5. Antibody pulldown followed by Western blotting for Hdac1 shows that Olig2 interacts with Hdac1 in open chromatin compartment. Olig2 interacts with NF1 in the condensed chromatin. Control, Control IgG.
As indicated in Table 1, the high-confidence Olig2 interactors include Hdac1 and multiple other members of the nucleosome remodeling and histone deacetylase (NuRD) complex. Transcription repressor functions are implemented by the NuRD complex (Lai and Wade, 2011). The NuRD complex is relevant to Olig2 transcriptional functions because key developmental responses to Olig2 are channeled through its activity as a repressor of gene expression (Mizuguchi et al., 2001; Novitch et al., 2001; Zhou et al., 2001). In particular, suppression of gene transcription requires histone deacetylases (Hdacs) (Carew et al., 2008; Haberland et al., 2009), and targeted disruption of Hdac1 suppresses formation of oligodendrocytes in zebrafish (Cunliffe and Casaccia-Bonnefil, 2006) and in mice (Ye et al., 2009). Another high-confidence interactor with links to the Olig2 literature is Nf1a, a member of the CCAAT-box family of transcription factors that promotes the terminal differentiation of astrocytes during development. Olig2 opposes the proastrocytic function of Nf1a and prior studies by Deneen et al. (2006) suggest that this oppositional relationship may reflect a direct physical interaction.
Table 1.
Mass spectrometry analysis of Olig2 interacting partners across three independent tandem-affinity purificationsa
| Name | Protein description | 1 | 2 | 3 | Score |
|---|---|---|---|---|---|
| Olig2 | Oligodendrocyte transcription factor 2 | 12 | 18 | 18 | +++ |
| Parp1 | Poly [ADP-ribose] polymerase 1 | 11 | 15 | 24 | +++ |
| Olig1 | Oligodendrocyte transcription factor 1 | 4 | 1 | 11 | +++ |
| Top2a | DNA topoisomerase 2-α | 7 | 8 | 3 | +++ |
| Ddx39b | Spliceosome RNA helicase Ddx39b | 5 | 7 | 4 | +++ |
| Xrcc5 | X-ray repair cross-complementing protein 5 | 3 | 4 | 13 | +++ |
| Zfp384 | Zinc finger protein 384 | 2 | 4 | 4 | +++ |
| Rbbp4b | Histone-binding protein RBBP4 | 2 | 4 | 2 | +++ |
| Mtab | Metastasis-associated protein MTA2 | 1 | 2 | 3 | +++ |
| Mybbp1a | myb-binding protein 1A | 3 | 2 | 1 | +++ |
| Nfib | Nuclear factor 1 B-type isoform 3 | 2 | 2 | 1 | +++ |
| Hmga2 | High mobility group protein HMGI-C | 1 | 2 | 1 | +++ |
| Mecp2 | Methyl-CpG-binding protein 2 isoform 2 | 1 | 2 | 1 | +++ |
| Xrcc6 | X-ray repair cross-complementing protein 6 | 8 | 2 | 9 | +++ |
| Ogt | UDP-N-acetylglucosamine-peptide N-acetylglucosaminyltransferase 110 kDa subunit | 1 | 1 | 3 | +++ |
| Adnp | Activity-dependent neuroprotector homeobox protein | 1 | 1 | 2 | +++ |
| Creb1 | cAMP-responsive element-binding protein 1 isoform B | 1 | 1 | 1 | +++ |
| Trps1 | Zinc finger transcription factor Trps1 | 6 | 3 | ++ | |
| Hdx | Highly divergent homeobox | 5 | 1 | ++ | |
| Tmpo | Lamina-associated polypeptide 2 isoform α | 3 | 5 | ++ | |
| Smarca5 | SWI/SNF-related matrix-associated actin-dependent regulator of chromatin subfamily A member 5 | 3 | 4 | ++ | |
| Sox2 | Transcription factor SOX-2 | 1 | 2 | ++ | |
| Tcf12 | Transcription factor 12 | 1 | 2 | ++ | |
| Hdac1b | Histone deacetylase 1 | 1 | 2 | ++ | |
| Chd4b | Chromodomain-helicase-DNA-binding protein 4 | 1 | 2 | ++ | |
| Eif4a3 | Eukaryotic initiation factor 4A-III | 2 | 1 | ++ | |
| Nfia | Nuclear factor 1 A-type isoform 2 | 1 | 3 | ++ | |
| Ruvbl2 | ruvB-like 2 | 1 | 2 | ++ | |
| Kdm1a | Lysine-specific histone demethylase 1A | 1 | 1 | ++ | |
| Mta1b | Metastasis-associated protein MTA1 | 1 | 1 | ++ | |
| Nacc1 | Nucleus accumbens-associated protein 1 | 1 | 1 | ++ | |
| Cand1 | Cullin-associated NEDD8-dissociated protein 1 | 1 | 1 | ++ | |
| Psip1 | PC4 and SFRS1-interacting protein | 1 | 1 | ++ | |
| Mbd1 | Methyl-CpG-binding domain protein 1 | 1 | 1 | ++ | |
| Snd1 | Staphylococcal nuclease domain-containing protein 1 | 2 | 1 | ++ | |
| Rbm39 | RNA-binding protein 39 | 2 | 3 | ++ | |
| Khdrbs1 | KH domain-containing, RNA-binding, signal transduction-associated protein 1 | 1 | 1 | ++ |
aThe list shows the subset of Olig2 binding partners involved in regulation of transcription (GO 0006355 and children). Columns 3–5 represents the number of peptides specific to the indicated protein that was identified in each pulldown. Score: +++, detected in 3 of 3 repeats; ++, detected in 2 of 3 repeats.
bMembers of the NuRD complex.
For validation of the Table 1 dataset, we focused on Nf1 and two members of the NURD complex, Hdac1 and Mta2 (Zhang et al., 1999). Endogenous interaction of Olig2 with Hdac1 and Mta2 was independently confirmed by coimmunoprecipitation (Fig. 7B). Furthermore, Hdac1 is preferentially localized in the open compartment of our neural progenitor cells, whereas Nf1 is localized exclusively to the condensed chromatin fraction (Fig. 7C). We performed coimmunoprecipitation experiments with HA or control IgG and confirmed that Olig2 in the open fraction binds to Hdac1, whereas Olig2 in the chromatin fraction interacts with Nf1a (Fig. 7D). These data indicate that key Olig2 coregulator proteins are differentially sequestered to open and condensed chromatin wherein, as a consequence, they enjoy differential access to phosphorylated and nonphosphorylated Olig2.
Intranuclear compartmentalization of Olig2 is developmentally regulated
Studies summarized in Figure 8 highlight developmental relevance of Olig2 compartmentalization and shed light on the role of phosphorylation in the anti-p53 functions of Olig2. Figure 8A recapitulates previous observations on developmental control of Olig2 phosphorylation (Sun et al., 2011). As indicated, phosphorylation of Olig2 undergoes a dramatic decrease when cycling progenitor cells are plated in factor-free medium and allowed to differentiate. Against this backdrop, the phosphorylation state of Olig2 in terminally differentiated, myelinating oligodendrocytes of the postnatal spinal cord resembles that of differentiating progenitor cells, rather than cycling progenitors.
Figure 8.
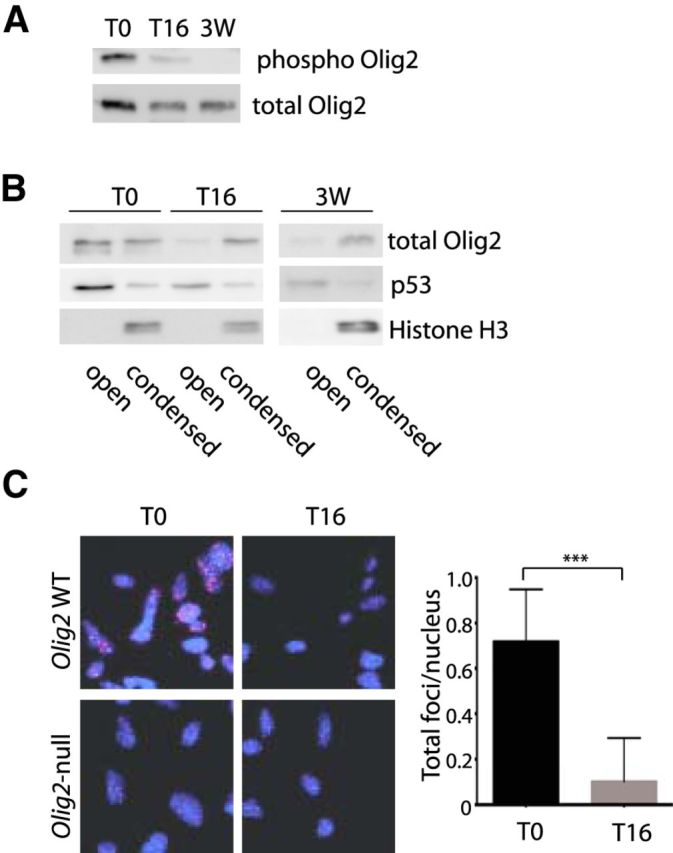
Developmentally regulated localization of Olig2 protein controls close proximity with p53. A, Mouse neural progenitor cells were cultured in cycling (T0) or differentiating (16 h after growth factor withdrawal, T16) conditions. In addition, spinal cord was dissected from adult mice (three weeks, 3W) to obtain a mature white matter sample. After subnuclear fractionation of cell and tissue lysates, phosphorylated and total Olig2 levels were assessed in the open compartment. B, Subnuclear fractions of cell and tissue lysates as in A were analyzed for total Olig2 and p53 protein distribution in open and condensed compartment. Histone H3 is used as a marker for the condensed fraction. C, Olig2-null and Olig2 WT mouse neural progenitor cells were cultured under cycling (T0) and differentiating (T16) conditions on laminin-coated coverslips. Proximity ligation with mouse p53 and rabbit Olig2 antibody and appropriate secondary antibodies was performed to count total foci per cell nucleus as shown in the bar graph. ***p < 0.001 (unpaired t test, two-tailed).
As shown in Figure 8B, the phosphorylation state of Olig2 correlates with intranuclear compartmentalization. Virtually all of the Olig2 in differentiating progenitor cell cultures and in postnatal spinal cord is found within the condensed chromatin fraction. By contrast, Olig2 in the cycling progenitor cells is evenly partitioned between the open and condensed chromatin fractions (as shown also in Fig. 6A wherein the nuclear extracts were likewise prepared from cycling progenitor cells).
The p53 protein is found within the open chromatin compartment of all three sample sets (Fig. 8B). Notably, p53 is conspicuous by its absence in the list of Olig2 interacting proteins identified by TAP pulldown (Table 1). The failure to capture p53 in Olig2 immune precipitates is consistent with previous studies wherein exhaustive efforts to demonstrate an Olig2:p53 protein complex by antibody pulldown protocols were unsuccessful (Mehta et al., 2011). PLAs constitute an alternate approach to visualization of protein:protein relationships (Fredriksson et al., 2002). In PLA assays, antibodies to a protein pair of interest enable formation of a duplex oligonucleotide template. DNA polymerase can then amplify this template, and the DNA product can be visualized by hybridization to complementary fluorescence-labeled oligonucleotides. However, the key to the assay is that the protein pairs recognized by the antibodies must be within ∼30 nm of each other to enable formation of the oligonucleotide template (Soderberg et al., 2006). As indicated in Figure 8C, antibodies to p53 and Olig2 are reactive in PLA assays in cycling neural progenitors but not in differentiating neural progenitors.
Collectively, these data suggest that phosphorylated Olig2 in cycling neural progenitors is in a transcriptionally active nuclear compartment where it comes into close proximity to p53. Conversely, dephosphorylated Olig2 as seen in differentiating neural progenitors, and mature white matter is sequestered within in a relatively inert compartment of condensed chromatin.
Discussion
Transcription factors with bHLH domains play a pervasive role in the fate-choice decision of neural progenitors to replicate or to exit the cell cycle and differentiate (Ross et al., 2003). Most neurogenic bHLH transcription factors are expressed only at early stages of development. However, the bHLH transcription factor Olig2 is an exception to this rule. Early expression of Olig2 in cycling oligodendrocyte progenitor cells is maintained throughout development and sustained in terminally differentiated, myelinating oligodendrocytes (hence the name “Olig”) (Lu et al., 2000; Zhou et al., 2000). Clearly, the functions of Olig2 in cycling neural progenitors must be suppressed in terminally differentiated oligodendrocytes. How is this achieved? In studies summarized here, we show that a developmentally regulated phosphorylation event specifies intranuclear localization of Olig2 into open chromatin or into condensed chromatin. Decisions to promote or suppress gene transcription are made in open chromatin, whereas condensed chromatin is transcriptionally inert (Weintraub and Groudine, 1976; Bloom and Anderson, 1978; Simonis et al., 2006; Patel et al., 2013). Thus, the dephosphorylation of Olig2 that occurs in postnatal white matter (Fig. 8A) could serve to attenuate transcriptional functions by moving Olig2 into condensed chromatin.
As indicated in Figures 4 and 5, the phosphorylation state of Olig2 has little, if any, impact on target gene binding. However, our ChIP-Seq analysis of Olig2 WT, TPN, and TPM in cycling neural progenitor cells adds to a prior database on Olig2 target elements and transcription functions. Previously, Olig2 WT ChIP-Seq experiments have been performed in motor neuron progenitor cells and oligodendrocyte progenitor cells (Mazzoni et al. 2011; Yu et al., 2013). Olig2 has traditionally been known as transcriptional repressor because of its function in the developing CNS (Novitch et al., 2001; Lee et al., 2005). Specifically, by repressing Hb9 gene expression, the replication-competent state of motor neuron progenitors is sustained in the developing spinal cord (Lee et al., 2005). Importantly, by combining our ChIP-Seq study with RNA sequencing, we do not see a bias for direct target genes that are transcriptionally repressed. Thus, we propose that Olig2 can function both as a transcriptional repressor and activator in neural progenitor cells. Our ChIP-Seq/RNA-Seq data identify a subset of promitogenic genes that are direct targets of Olig2 and are upregulated by Olig2 TPM. At the same time, the data highlight a second set of antiproliferative direct target genes that are repressed by Olig2 TPM. In the context of stimulating or suppressing gene expression in the open chromatin compartment, the Olig2 interaction with Nf1a in the transcriptionally inert condensed chromatin chromatin fraction is of some interest. As noted above, Olig2 opposes the proastrocytic function of Nf1a (Deneen et al., 2006). It is tempting to speculate that dephosphorylated Olig2 suppresses Nf1a transcription functions by binding to the protein and sequestering it within transcriptionally inactive chromatin.
Most members of the bHLH transcription factor family function in a dimeric state. The choice of dimerization partner depends on developmental stage and tissue type. Cell type-specific bHLH proteins, such as Olig2 (termed class B factors), often form heterodimers with ubiquitously expressed class A bHLH proteins such as E12/E47 (also known as Tcf3) (Ross et al., 2003). In addition, bHLH transcription factors can heterodimerize with Id proteins (possessing the HLH motif but lacking the canonical basic domain) so as to inhibit their transcription functions. Prior studies have shown that that Olig2 can heterodimerize with all of these above named factors and also function in a homodimeric state. However, most of the published interactions with Olig2 have been identified through Cos7 cell overexpression protocols or via yeast two-hybrid trapping assays (Meijer et al., 2012). Here, we used TAP followed by mass spectrometry to identify two bHLH proteins as potential interacting partners for Olig2 in mouse neural progenitor cells, namely, Tcf12 (class A) and Olig1 (Table 1). Proteins in the bHLH transcription factor family frequently interact with homeodomain proteins to regulate tissue-specific development (Poulin et al., 2000; Babu et al., 2008; Makarenkova et al., 2009), and our TAP pulldown assays identify the homeodomain proteins Adnp and Hdx as potential Olig2 coregulators. Homeodomain protein Nkx2.2, a well-established binding partner of Olig2 in the neural tube (Sun et al., 2003) was not detected in our TAP pulldowns. The absence of Nkx2.2 most likely reflects context because Nkx2.2 is not expressed in cycling neural progenitor cells (Qi et al., 2001). Our Olig2 TAP pulldowns also identified Rcor2, a very interesting transcription corepressor that just failed to make the Table 1 list “high confidence” interactors (data not shown). Recent studies have shown that Rcor2 functions downstream of Olig2 and can replace the essential functions of Olig2 in formation of human glioma tumor initiating cells (Suva et al., 2014). The studies of Suva et al. (2014) indicate that Olig2 binds to upstream promoter/enhancer elements of Rcor2, an observation confirmed in our whole-genome ChIP-Seq assays. In our mouse neural progenitors, however, we could not detect differential expression of Rcor2 in wild-type and Olig2-null cells.
Finally, the distribution of Olig2 within two distinct nuclear compartments sheds light on the mechanism underlying an oppositional relationship between Olig2 and p53 (Mehta et al., 2011). In both normal and malignant neural progenitors, Olig2 suppresses p53-mediated responses to radiation and genotoxic drugs (Mehta et al., 2011), and these anti-p53 functions are exerted by the phosphorylated form of Olig2 (Sun et al., 2011). How does the phosphorylation state of the Olig2 triple serine motif (located >100 amino acids proximal to the DNA-targeting bHLH motif) regulate p53 functions? To date, there has been no evidence that the anti-p53 activity of phosphorylated Olig2 is actually linked to its function as an E-box binding transcription factor. For example, key genetic functions of the p53 protein are regulated by acetylation (Barlev et al., 2001; Li et al., 2002), and a differential acetylation state of p53 was noted in wild-type relative to Olig2-null neural progenitors. This differential acetylation state would be consistent with a model wherein Olig2 simply competes with p53 for an important coregulator protein that facilitates acetylation (Mehta et al., 2011).
As shown in Figure 8, a key role of phosphorylation is to localize Olig2 to the open chromatin compartment where p53 is also sequestered. Beyond placing Olig2 into the same nuclear compartment as p53, the proximity ligation assay results indicate that Olig2 and p53 are very close to each other (within 30 nm) in the open chromatin compartment. As shown in Figure 2, the anti-p53 functions of Olig2 clearly require a form of the protein that can recognize canonical E-box promoter/enhancers and bind to them. Putting these observations together, a model can be envisioned wherein promoter/enhancer elements for p53 and Olig2 are colocalized to common genetic targets. Phosphorylated Olig2 in complex with an Hdac protein as shown in Figure 7 could suppress expression of the gene that p53 is attempting to activate. At the same time, the Hdac activity associated with Olig2 could deacetylate nascent p53. In accord with this model, a canonical p53 binding site in p21 is bracketed by a pair of E-box elements located within a few hundred base pairs to either side (Ligon et al., 2007).
Data from multiple laboratories (Lu et al., 2001; Marie et al., 2001; Bouvier et al., 2003; Ohnishi et al., 2003; Ligon et al., 2004) plus the TCGA consortium (Cancer Genome Atlas Research Network, 2008) document expression of OLIG2 in human glioma. Beyond merely marking glioma cells, OLIG2 is essential for intracranial tumor formation with genetically relevant murine models of glioblastoma (Ligon et al., 2007) and with freshly isolated human glioma cells (Mehta et al., 2011). Finally, OLIG2 is expressed only within the CNS and only within a selected subset of cells in the CNS (Lu et al., 2000; Takebayashi et al., 2000; Zhou et al., 2000). For all these reasons, small-molecule inhibitors of Olig2 function might serve as attractive therapeutics for glioma. Transcription factors per se are generally unattractive targets for drug development because their functional interactions with DNA and coregulator proteins involve large surface areas. Data shown here document the essential role of phosphorylation as an enabler of Olig2 transcription functions, and protein kinases lend themselves readily to drug development. In the fullness of time, the protein kinase(s) that phosphorylate Olig2 might serve as surrogate targets for drug discovery and development.
Footnotes
This work was supported by National Institutes of Health Grants NS047572 and NS057727 to C.D.S. and Grant NS040511 to D.H.R. and the Pediatric Low-Grade Astrocytoma Foundation (to C.D.S.). D.H.M. was supported by VSB fonds and Prins Bernard Cultuurfonds. We thank Dr. Alexander Gimelbrant at Dana-Farber Cancer Institute for helpful conversations.
The authors declare no competing financial interests.
References
- Adelmant G, Calkins AS, Garg BK, Card JD, Askenazi M, Miron A, Sobhian B, Zhang Y, Nakatani Y, Silver PA, Iglehart JD, Marto JA, Lazaro JB. DNA ends alter the molecular composition and localization of Ku multicomponent complexes. Mol Cell Proteomics. 2012;11:411–421. doi: 10.1074/mcp.M111.013581. [DOI] [PMC free article] [PubMed] [Google Scholar]
- Aoki M, Yamashita T, Tohyama M. EphA receptors direct the differentiation of mammalian neural precursor cells through a mitogen-activated protein kinase-dependent pathway. J Biol Chem. 2004;279:32643–32650. doi: 10.1074/jbc.M313247200. [DOI] [PubMed] [Google Scholar]
- Appolloni I, Calzolari F, Barilari M, Terrile M, Daga A, Malatesta P. Antagonistic modulation of gliomagenesis by Pax6 and Olig2 in PDGF-induced oligodendroglioma. Int J Cancer. 2012;131:E1078–E1087. doi: 10.1002/ijc.27606. [DOI] [PubMed] [Google Scholar]
- Arnett HA, Fancy SP, Alberta JA, Zhao C, Plant SR, Kaing S, Raine CS, Rowitch DH, Franklin RJ, Stiles CD. bHLH transcription factor Olig1 is required to repair demyelinated lesions in the CNS. Science. 2004;306:2111–2115. doi: 10.1126/science.1103709. [DOI] [PubMed] [Google Scholar]
- Babu DA, Chakrabarti SK, Garmey JC, Mirmira RG. Pdx1 and BETA2/NeuroD1 participate in a transcriptional complex that mediates short-range DNA looping at the insulin gene. J Biol Chem. 2008;283:8164–8172. doi: 10.1074/jbc.M800336200. [DOI] [PMC free article] [PubMed] [Google Scholar]
- Bao S, Wu Q, Li Z, Sathornsumetee S, Wang H, McLendon RE, Hjelmeland AB, Rich JN. Targeting cancer stem cells through L1CAM suppresses glioma growth. Cancer Res. 2008;68:6043–6048. doi: 10.1158/0008-5472.CAN-08-1079. [DOI] [PMC free article] [PubMed] [Google Scholar]
- Barlev NA, Liu L, Chehab NH, Mansfield K, Harris KG, Halazonetis TD, Berger SL. Acetylation of p53 activates transcription through recruitment of coactivators/histone acetyltransferases. Mol Cell. 2001;8:1243–1254. doi: 10.1016/S1097-2765(01)00414-2. [DOI] [PubMed] [Google Scholar]
- Barrett LE, Granot Z, Coker C, Iavarone A, Hambardzumyan D, Holland EC, Nam HS, Benezra R. Self-renewal does not predict tumor growth potential in mouse models of high-grade glioma. Cancer Cell. 2012;21:11–24. doi: 10.1016/j.ccr.2011.11.025. [DOI] [PubMed] [Google Scholar]
- Bloom KS, Anderson JN. Fractionation of hen oviduct chromatin into transcriptionally active and inactive regions after selective micrococcal nuclease digestion. Cell. 1978;15:141–150. doi: 10.1016/0092-8674(78)90090-9. [DOI] [PubMed] [Google Scholar]
- Bouvier C, Bartoli C, Aguirre-Cruz L, Virard I, Colin C, Fernandez C, Gouvernet J, Figarella-Branger D. Shared oligodendrocyte lineage gene expression in gliomas and oligodendrocyte progenitor cells. J Neurosurg. 2003;99:344–350. doi: 10.3171/jns.2003.99.2.0344. [DOI] [PubMed] [Google Scholar]
- Cancer Genome Atlas Research Network. Comprehensive genomic characterization defines human glioblastoma genes and core pathways. Nature. 2008;455:1061–1068. doi: 10.1038/nature07385. [DOI] [PMC free article] [PubMed] [Google Scholar]
- Carew JS, Giles FJ, Nawrocki ST. Histone deacetylase inhibitors: mechanisms of cell death and promise in combination cancer therapy. Cancer Lett. 2008;269:7–17. doi: 10.1016/j.canlet.2008.03.037. [DOI] [PubMed] [Google Scholar]
- Cunliffe VT, Casaccia-Bonnefil P. Histone deacetylase 1 is essential for oligodendrocyte specification in the zebrafish CNS. Mech Dev. 2006;123:24–30. doi: 10.1016/j.mod.2005.10.005. [DOI] [PubMed] [Google Scholar]
- Davie JR, Saunders CA. Chemical composition of nucleosomes among domains of calf thymus chromatin differing in micrococcal nuclease accessibility and solubility properties. J Biol Chem. 1981;256:12574–12580. [PubMed] [Google Scholar]
- Deneen B, Ho R, Lukaszewicz A, Hochstim CJ, Gronostajski RM, Anderson DJ. The transcription factor NFIA controls the onset of gliogenesis in the developing spinal cord. Neuron. 2006;52:953–968. doi: 10.1016/j.neuron.2006.11.019. [DOI] [PubMed] [Google Scholar]
- Doetsch F, Petreanu L, Caille I, Garcia-Verdugo JM, Alvarez-Buylla A. EGF converts transit-amplifying neurogenic precursors in the adult brain into multipotent stem cells. Neuron. 2002;36:1021–1034. doi: 10.1016/S0896-6273(02)01133-9. [DOI] [PubMed] [Google Scholar]
- Feng J, Liu T, Qin B, Zhang Y, Liu XS. Identifying ChIP-Seq enrichment using MACS. Nat Protoc. 2012;7:1728–1740. doi: 10.1038/nprot.2012.101. [DOI] [PMC free article] [PubMed] [Google Scholar]
- Ficarro SB, Zhang Y, Lu Y, Moghimi AR, Askenazi M, Hyatt E, Smith ED, Boyer L, Schlaeger TM, Luckey CJ, Marto JA. Improved electrospray ionization efficiency compensates for diminished chromatographic resolution and enables proteomics analysis of tyrosine signaling in embryonic stem cells. Anal Chem. 2009;81:3440–3447. doi: 10.1021/ac802720e. [DOI] [PubMed] [Google Scholar]
- Firulli BA, Redick BA, Conway SJ, Firulli AB. Mutations within helix I of Twist1 result in distinct limb defects and variation of DNA binding affinities. J Biol Chem. 2007;282:27536–27546. doi: 10.1074/jbc.M702613200. [DOI] [PMC free article] [PubMed] [Google Scholar]
- Fredriksson S, Gullberg M, Jarvius J, Olsson C, Pietras K, Gústafsdóttir SM, Ostman A, Landegren U. Protein detection using proximity-dependent DNA ligation assays. Nat Biotechnol. 2002;20:473–477. doi: 10.1038/nbt0502-473. [DOI] [PubMed] [Google Scholar]
- Haberland M, Montgomery RL, Olson EN. The many roles of histone deacetylases in development and physiology: implications for disease and therapy. Nat Rev Genet. 2009;10:32–42. doi: 10.1038/nrg2485. [DOI] [PMC free article] [PubMed] [Google Scholar]
- He HH, Meyer CA, Shin H, Bailey ST, Wei G, Wang Q, Zhang Y, Xu K, Ni M, Lupien M, Mieczkowski P, Lieb JD, Zhao K, Brown M, Liu XS. Nucleosome dynamics define transcriptional enhancers. Nat Genet. 2010;42:343–347. doi: 10.1038/ng.545. [DOI] [PMC free article] [PubMed] [Google Scholar]
- Henikoff S, Henikoff JG, Sakai A, Loeb GB, Ahmad K. Genome-wide profiling of salt fractions maps physical properties of chromatin. Genome Res. 2009;19:460–469. doi: 10.1101/gr.087619.108. [DOI] [PMC free article] [PubMed] [Google Scholar]
- Kamakaka RT, Kadonaga JT. The soluble nuclear fraction, a highly efficient transcription extract from Drosophila embryos. Methods Cell Biol. 1994;44:225–235. doi: 10.1016/S0091-679X(08)60916-4. [DOI] [PubMed] [Google Scholar]
- Lai AY, Wade PA. Cancer biology and NuRD: a multifaceted chromatin remodelling complex. Nat Rev Cancer. 2011;11:588–596. doi: 10.1038/nrc3091. [DOI] [PMC free article] [PubMed] [Google Scholar]
- Langmead B, Trapnell C, Pop M, Salzberg SL. Ultrafast and memory-efficient alignment of short DNA sequences to the human genome. Genome Biol. 2009;10:R25. doi: 10.1186/gb-2009-10-3-r25. [DOI] [PMC free article] [PubMed] [Google Scholar]
- Lee SK, Lee B, Ruiz EC, Pfaff SL. Olig2 and Ngn2 function in opposition to modulate gene expression in motor neuron progenitor cells. Genes Dev. 2005;19:282–294. doi: 10.1101/gad.1257105. [DOI] [PMC free article] [PubMed] [Google Scholar]
- Li H, de Faria JP, Andrew P, Nitarska J, Richardson WD. Phosphorylation regulates OLIG2 cofactor choice and the motor neuron-oligodendrocyte fate switch. Neuron. 2011;69:918–929. doi: 10.1016/j.neuron.2011.01.030. [DOI] [PMC free article] [PubMed] [Google Scholar]
- Li M, Luo J, Brooks CL, Gu W. Acetylation of p53 inhibits its ubiquitination by Mdm2. J Biol Chem. 2002;277:50607–50611. doi: 10.1074/jbc.C200578200. [DOI] [PubMed] [Google Scholar]
- Ligon KL, Alberta JA, Kho AT, Weiss J, Kwaan MR, Nutt CL, Louis DN, Stiles CD, Rowitch DH. The oligodendroglial lineage marker OLIG2 is universally expressed in diffuse gliomas. J Neuropathol Exp Neurol. 2004;63:499–509. doi: 10.1093/jnen/63.5.499. [DOI] [PubMed] [Google Scholar]
- Ligon KL, Huillard E, Mehta S, Kesari S, Liu H, Alberta JA, Bachoo RM, Kane M, Louis DN, Depinho RA, Anderson DJ, Stiles CD, Rowitch DH. Olig2-regulated lineage-restricted pathway controls replication competence in neural stem cells and malignant glioma. Neuron. 2007;53:503–517. doi: 10.1016/j.neuron.2007.01.009. [DOI] [PMC free article] [PubMed] [Google Scholar]
- Liu T, Ortiz JA, Taing L, Meyer CA, Lee B, Zhang Y, Shin H, Wong SS, Ma J, Lei Y, Pape UJ, Poidinger M, Chen Y, Yeung K, Brown M, Turpaz Y, Liu XS. Cistrome: an integrative platform for transcriptional regulation studies. Genome Biol. 2011;12:R83. doi: 10.1186/gb-2011-12-8-r83. [DOI] [PMC free article] [PubMed] [Google Scholar]
- Lu QR, Yuk D, Alberta JA, Zhu Z, Pawlitzky I, Chan J, McMahon AP, Stiles CD, Rowitch DH. Sonic hedgehog-regulated oligodendrocyte lineage genes encoding bHLH proteins in the mammalian central nervous system. Neuron. 2000;25:317–329. doi: 10.1016/S0896-6273(00)80897-1. [DOI] [PubMed] [Google Scholar]
- Lu QR, Park JK, Noll E, Chan JA, Alberta J, Yuk D, Alzamora MG, Louis DN, Stiles CD, Rowitch DH, Black PM. Oligodendrocyte lineage genes (OLIG) as molecular markers for human glial brain tumors. Proc Natl Acad Sci U S A. 2001;98:10851–10856. doi: 10.1073/pnas.181340798. [DOI] [PMC free article] [PubMed] [Google Scholar]
- Lu QR, Sun T, Zhu Z, Ma N, Garcia M, Stiles CD, Rowitch DH. Common developmental requirement for Olig function indicates a motor neuron/oligodendrocyte connection. Cell. 2002;109:75–86. doi: 10.1016/S0092-8674(02)00678-5. [DOI] [PubMed] [Google Scholar]
- Ma YC, Song MR, Park JP, Henry Ho HY, Hu L, Kurtev MV, Zieg J, Ma Q, Pfaff SL, Greenberg ME. Regulation of motor neuron specification by phosphorylation of neurogenin 2. Neuron. 2008;58:65–77. doi: 10.1016/j.neuron.2008.01.037. [DOI] [PMC free article] [PubMed] [Google Scholar]
- Makarenkova HP, Gonzalez KN, Kiosses WB, Meech R. Barx2 controls myoblast fusion and promotes MyoD-mediated activation of the smooth muscle alpha-actin gene. J Biol Chem. 2009;284:14866–14874. doi: 10.1074/jbc.M807208200. [DOI] [PMC free article] [PubMed] [Google Scholar]
- Marie Y, Sanson M, Mokhtari K, Leuraud P, Kujas M, Delattre JY, Poirier J, Zalc B, Hoang-Xuan K. OLIG2 as a specific marker of oligodendroglial tumour cells. Lancet. 2001;358:298–300. doi: 10.1016/S0140-6736(01)05499-X. [DOI] [PubMed] [Google Scholar]
- Mazzoni EO, Mahony S, Iacovino M, Morrison CA, Mountoufaris G, Closser M, Whyte WA, Young RA, Kyba M, Gifford DK, Wichterle H. Embryonic stem cell-based mapping of developmental transcriptional programs. Nat Methods. 2011;8:1056–1058. doi: 10.1038/nmeth.1775. [DOI] [PMC free article] [PubMed] [Google Scholar]
- Mehta S, Huillard E, Kesari S, Maire CL, Golebiowski D, Harrington EP, Alberta JA, Kane MF, Theisen M, Ligon KL, Rowitch DH, Stiles CD. The central nervous system-restricted transcription factor Olig2 opposes p53 responses to genotoxic damage in neural progenitors and malignant glioma. Cancer Cell. 2011;19:359–371. doi: 10.1016/j.ccr.2011.01.035. [DOI] [PMC free article] [PubMed] [Google Scholar]
- Meijer DH, Kane MF, Mehta S, Liu H, Harrington E, Taylor CM, Stiles CD, Rowitch DH. Separated at birth? The functional and molecular divergence of OLIG1 and OLIG2. Nat Rev Neurosci. 2012;13:819–831. doi: 10.1038/nrn3386. [DOI] [PMC free article] [PubMed] [Google Scholar]
- Mito Y, Henikoff JG, Henikoff S. Genome-scale profiling of histone H3.3 replacement patterns. Nat Genet. 2005;37:1090–1097. doi: 10.1038/ng1637. [DOI] [PubMed] [Google Scholar]
- Mizuguchi R, Sugimori M, Takebayashi H, Kosako H, Nagao M, Yoshida S, Nabeshima Y, Shimamura K, Nakafuku M. Combinatorial roles of olig2 and neurogenin2 in the coordinated induction of pan-neuronal and subtype-specific properties of motoneurons. Neuron. 2001;31:757–771. doi: 10.1016/S0896-6273(01)00413-5. [DOI] [PubMed] [Google Scholar]
- Nakatani Y, Ogryzko V. Immunoaffinity purification of mammalian protein complexes. Methods Enzymol. 2003;370:430–444. doi: 10.1016/S0076-6879(03)70037-8. [DOI] [PubMed] [Google Scholar]
- Novitch BG, Chen AI, Jessell TM. Coordinate regulation of motor neuron subtype identity and pan-neuronal properties by the bHLH repressor Olig2. Neuron. 2001;31:773–789. doi: 10.1016/S0896-6273(01)00407-X. [DOI] [PubMed] [Google Scholar]
- Ohnishi A, Sawa H, Tsuda M, Sawamura Y, Itoh T, Iwasaki Y, Nagashima K. Expression of the oligodendroglial lineage-associated markers Olig1 and Olig2 in different types of human gliomas. J Neuropathol Exp Neurol. 2003;62:1052–1059. doi: 10.1093/jnen/62.10.1052. [DOI] [PubMed] [Google Scholar]
- Orphanides G, Reinberg D. RNA polymerase II elongation through chromatin. Nature. 2000;407:471–475. doi: 10.1038/35035000. [DOI] [PubMed] [Google Scholar]
- Patel NS, Rhinn M, Semprich CI, Halley PA, Dollé P, Bickmore WA, Storey KG. FGF signalling regulates chromatin organisation during neural differentiation via mechanisms that can be uncoupled from transcription. PLoS Genet. 2013;9:e1003614. doi: 10.1371/journal.pgen.1003614. [DOI] [PMC free article] [PubMed] [Google Scholar]
- Pollard SM, Yoshikawa K, Clarke ID, Danovi D, Stricker S, Russell R, Bayani J, Head R, Lee M, Bernstein M, Squire JA, Smith A, Dirks P. Glioma stem cell lines expanded in adherent culture have tumor-specific phenotypes and are suitable for chemical and genetic screens. Cell Stem Cell. 2009;4:568–580. doi: 10.1016/j.stem.2009.03.014. [DOI] [PubMed] [Google Scholar]
- Poulin G, Lebel M, Chamberland M, Paradis FW, Drouin J. Specific protein-protein interaction between basic helix-loop-helix transcription factors and homeoproteins of the Pitx family. Mol Cell Biol. 2000;20:4826–4837. doi: 10.1128/MCB.20.13.4826-4837.2000. [DOI] [PMC free article] [PubMed] [Google Scholar]
- Qian X, Goderie SK, Shen Q, Stern JH, Temple S. Intrinsic programs of patterned cell lineages in isolated vertebrate CNS ventricular zone cells. Development. 1998;125:3143–3152. doi: 10.1242/dev.125.16.3143. [DOI] [PubMed] [Google Scholar]
- Qi Y, Cai J, Wu Y, Wu R, Lee J, Fu H, Rao M, Sussel L, Rubenstein J, Qiu M. Control of oligodendrocyte differentiation by the Nkx2.2 homeodomain transcription factor. Development. 2001;128:2723–2733. doi: 10.1242/dev.128.14.2723. [DOI] [PubMed] [Google Scholar]
- Rocha E, Davie JR, van Holde KE, Weintraub H. Differential salt fractionation of active and inactive genomic domains in chicken erythrocyte. J Biol Chem. 1984;259:8558–8563. [PubMed] [Google Scholar]
- Ross SE, Greenberg ME, Stiles CD. Basic helix-loop-helix factors in cortical development. Neuron. 2003;39:13–25. doi: 10.1016/S0896-6273(03)00365-9. [DOI] [PubMed] [Google Scholar]
- Roussa E, Wiehle M, Dünker N, Becker-Katins S, Oehlke O, Krieglstein K. Transforming growth factor beta is required for differentiation of mouse mesencephalic progenitors into dopaminergic neurons in vitro and in vivo: ectopic induction in dorsal mesencephalon. Stem Cells. 2006;24:2120–2129. doi: 10.1634/stemcells.2005-0514. [DOI] [PubMed] [Google Scholar]
- Rozenblatt-Rosen O, Deo RC, Padi M, Adelmant G, Calderwood MA, Rolland T, Grace M, Dricot A, Askenazi M, Tavares M, Pevzner SJ, Abderazzaq F, Byrdsong D, Carvunis AR, Chen AA, Cheng J, Correll M, Duarte M, Fan C, Feltkamp MC, et al. Interpreting cancer genomes using systematic host network perturbations by tumour virus proteins. Nature. 2012;487:491–495. doi: 10.1038/nature11288. [DOI] [PMC free article] [PubMed] [Google Scholar]
- Sanders MM. Fractionation of nucleosomes by salt elution from micrococcal nuclease-digested nuclei. J Cell Biol. 1978;79:97–109. doi: 10.1083/jcb.79.1.97. [DOI] [PMC free article] [PubMed] [Google Scholar]
- Simonis M, Klous P, Splinter E, Moshkin Y, Willemsen R, de Wit E, van Steensel B, de Laat W. Nuclear organization of active and inactive chromatin domains uncovered by chromosome conformation capture-on-chip (4C) Nat Genet. 2006;38:1348–1354. doi: 10.1038/ng1896. [DOI] [PubMed] [Google Scholar]
- Soderberg O, Gullberg M, Jarvius M, Ridderstråle K, Leuchowius KJ, Jarvius J, Wester K, Hydbring P, Bahram F, Larsson LG, Landegren U. Direct observation of individual endogenous protein complexes in situ by proximity ligation. Nat Methods. 2006;3:995–1000. doi: 10.1038/nmeth947. [DOI] [PubMed] [Google Scholar]
- Sun T, Dong H, Wu L, Kane M, Rowitch DH, Stiles CD. Cross-repressive interaction of the Olig2 and Nkx2.2 transcription factors in developing neural tube associated with formation of a specific physical complex. J Neurosci. 2003;23:9547–9556. doi: 10.1523/JNEUROSCI.23-29-09547.2003. [DOI] [PMC free article] [PubMed] [Google Scholar]
- Sun Y, Meijer DH, Alberta JA, Mehta S, Kane MF, Tien AC, Fu H, Petryniak MA, Potter GB, Liu Z, Powers JF, Runquist IS, Rowitch DH, Stiles CD. Phosphorylation state of Olig2 regulates proliferation of neural progenitors. Neuron. 2011;69:906–917. doi: 10.1016/j.neuron.2011.02.005. [DOI] [PMC free article] [PubMed] [Google Scholar]
- Suvà ML, Rheinbay E, Gillespie SM, Patel AP, Wakimoto H, Rabkin SD, Riggi N, Chi AS, Cahill DP, Nahed BV, Curry WT, Martuza RL, Rivera MN, Rossetti N, Kasif S, Beik S, Kadri S, Tirosh I, Wortman I, Shalek AK, et al. Reconstructing and reprogramming the tumor-propagating potential of glioblastoma stem-like cells. Cell. 2014;157:580–594. doi: 10.1016/j.cell.2014.02.030. [DOI] [PMC free article] [PubMed] [Google Scholar]
- Takebayashi H, Yoshida S, Sugimori M, Kosako H, Kominami R, Nakafuku M, Nabeshima Y. Dynamic expression of basic helix-loop-helix Olig family members: implication of Olig2 in neuron and oligodendrocyte differentiation and identification of a new member, Olig3. Mech Dev. 2000;99:143–148. doi: 10.1016/S0925-4773(00)00466-4. [DOI] [PubMed] [Google Scholar]
- Trapnell C, Williams BA, Pertea G, Mortazavi A, Kwan G, van Baren MJ, Salzberg SL, Wold BJ, Pachter L. Transcript assembly and quantification by RNA-Seq reveals unannotated transcripts and isoform switching during cell differentiation. Nat Biotechnol. 2010;28:511–515. doi: 10.1038/nbt.1621. [DOI] [PMC free article] [PubMed] [Google Scholar]
- Weintraub H, Groudine M. Chromosomal subunits in active genes have an altered conformation. Science. 1976;193:848–856. doi: 10.1126/science.948749. [DOI] [PubMed] [Google Scholar]
- Ye F, Chen Y, Hoang T, Montgomery RL, Zhao XH, Bu H, Hu T, Taketo MM, van Es JH, Clevers H, Hsieh J, Bassel-Duby R, Olson EN, Lu QR. HDAC1 and HDAC2 regulate oligodendrocyte differentiation by disrupting the beta-catenin-TCF interaction. Nat Neurosci. 2009;12:829–838. doi: 10.1038/nn.2333. [DOI] [PMC free article] [PubMed] [Google Scholar]
- Young KM, Mitsumori T, Pringle N, Grist M, Kessaris N, Richardson WD. An Fgfr3-iCreER(T2) transgenic mouse line for studies of neural stem cells and astrocytes. Glia. 2010;58:943–953. doi: 10.1002/glia.20976. [DOI] [PMC free article] [PubMed] [Google Scholar]
- Yu Y, Chen Y, Kim B, Wang H, Zhao C, He X, Liu L, Liu W, Wu LM, Mao M, Chan JR, Wu J, Lu QR. Olig2 targets chromatin remodelers to enhancers to initiate oligodendrocyte differentiation. Cell. 2013;152:248–261. doi: 10.1016/j.cell.2012.12.006. [DOI] [PMC free article] [PubMed] [Google Scholar]
- Zhang Y, Ng HH, Erdjument-Bromage H, Tempst P, Bird A, Reinberg D. Analysis of the NuRD subunits reveals a histone deacetylase core complex and a connection with DNA methylation. Genes Dev. 1999;13:1924–1935. doi: 10.1101/gad.13.15.1924. [DOI] [PMC free article] [PubMed] [Google Scholar]
- Zhang Y, Liu T, Meyer CA, Eeckhoute J, Johnson DS, Bernstein BE, Nusbaum C, Myers RM, Brown M, Li W, Liu XS. Model-based analysis of ChIP-Seq (MACS) Genome Biol. 2008;9:R137. doi: 10.1186/gb-2008-9-9-r137. [DOI] [PMC free article] [PubMed] [Google Scholar]
- Zhou Q, Anderson DJ. The bHLH transcription factors OLIG2 and OLIG1 couple neuronal and glial subtype specification. Cell. 2002;109:61–73. doi: 10.1016/S0092-8674(02)00677-3. [DOI] [PubMed] [Google Scholar]
- Zhou Q, Wang S, Anderson DJ. Identification of a novel family of oligodendrocyte lineage-specific basic helix-loop-helix transcription factors. Neuron. 2000;25:331–343. doi: 10.1016/S0896-6273(00)80898-3. [DOI] [PubMed] [Google Scholar]
- Zhou Q, Choi G, Anderson DJ. The bHLH transcription factor Olig2 promotes oligodendrocyte differentiation in collaboration with Nkx2.2. Neuron. 2001;31:791–807. doi: 10.1016/S0896-6273(01)00414-7. [DOI] [PubMed] [Google Scholar]