Abstract
Centrosome amplification has long been recognized as a feature of human tumors, however its role in tumorigenesis remains unclear1. Centrosome amplification is poorly tolerated by non-transformed cells, and, in the absence of selection, extra centrosomes are spontaneously lost2. Thus, the high frequency of centrosome amplification, particularly in more aggressive tumors3, raises the possibility that extra centrosomes could, in some contexts, confer advantageous characteristics that promote tumor progression. Using a three-dimensional model system and other approaches to culture human mammary epithelial cells, we find that centrosome amplification triggers cell invasion. This invasive behavior is similar to that induced by overexpression of the breast cancer oncogene ErbB24 and indeed enhances invasiveness triggered by ErbB2. We show that, through increased centrosomal microtubule nucleation, centrosome amplification increases Rac1 activity, which disrupts normal cell-cell adhesion and promotes invasion. These findings demonstrate that centrosome amplification, a structural alteration of the cytoskeleton, can promote features of malignant transformation.
The centrosome is the major microtubule-organizing center in mammalian cells and comprises of a pair of centrioles surrounded by the pericentriolar material5. Centrosome abnormalities, usually increased numbers, are common in human tumors1 and have been positively associated with advanced tumor grade and metastasis3, suggesting a possible role in tumor progression. This is somewhat surprising given the well-documented deleterious effects of centrosome amplification on cell proliferation6; in fact such amplification can be lethal if it compromises the ability of cells to organize multiple centrosomes to generate pseudo-bipolar spindles2. These seemingly paradoxical observations suggest that centrosome amplification might enhance other aspects of tumorigenesis.
We have developed orthogonal approaches to generate genetically comparable cells that do or do not carry extra centrosomes2. Here we adapt these methods to determine how centrosome amplification influences epithelial organoid integrity, making use of the well characterized 3-D culture model for MCF10A cells, a non-transformed human mammary epithelial cell line. This model recapitulates many aspects of breast glandular architecture7.
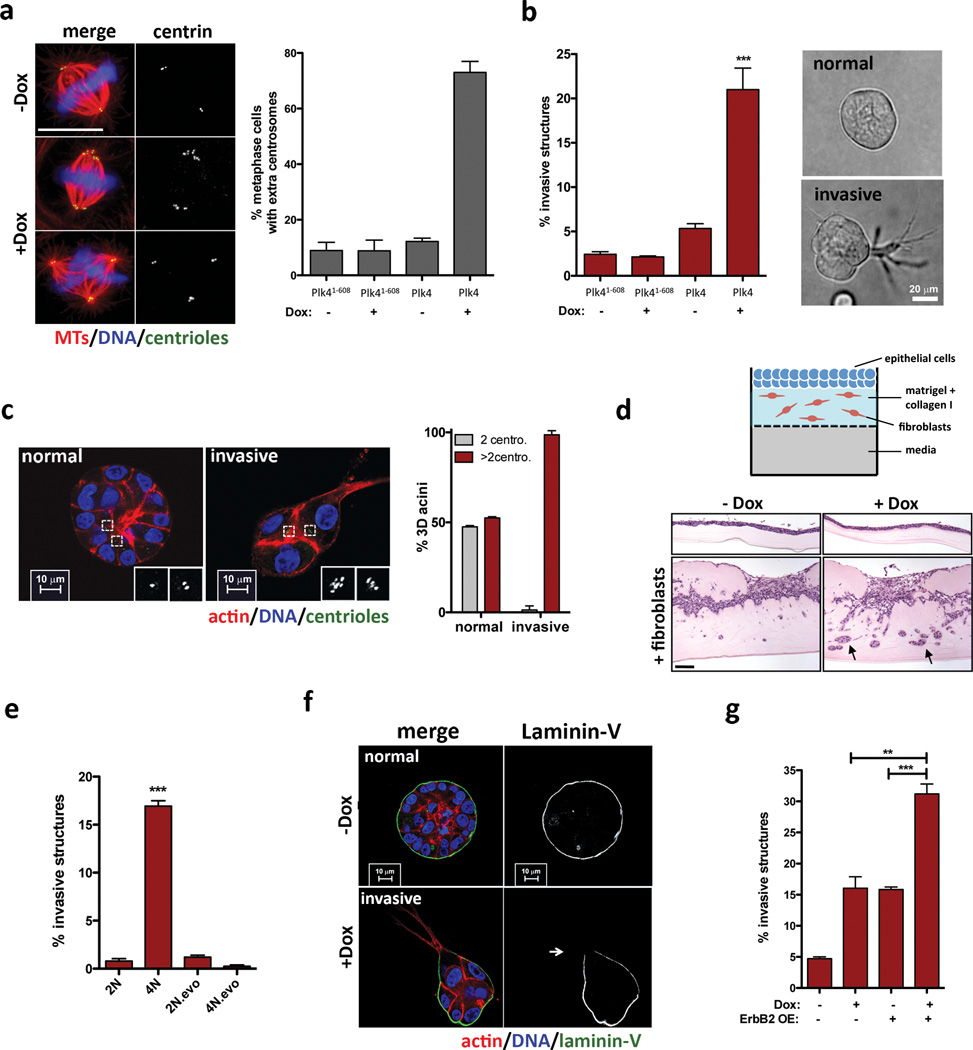
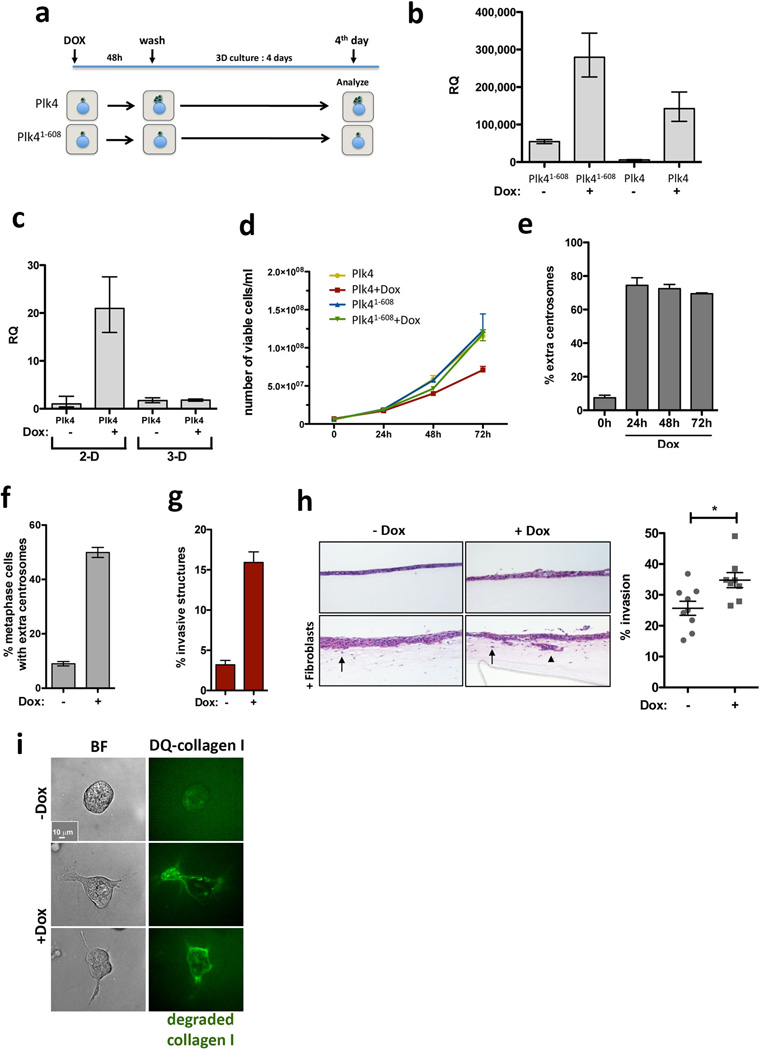
We engineered MCF10A cells to enable the inducible overexpression of Polo-like kinase 4 (Plk4), an essential regulator of centrosome duplication, whose overexpression induces supernumerary centrosomes8,9. As a negative control, we transiently overexpressed a truncated form of Plk4 (Plk41–608) that retains kinase activity but does not induce centrosome amplification10. As expected, transient induction of Plk4, but not of Plk41–608, led to centrosome amplification (Fig. 1a, Extended Data Fig. 1). Strikingly, centrosome amplification induced by Plk4 resulted in the formation of invasive protrusions, cytoplasmatic extensions that invade the surrounding matrix (Fig. 1b and Extended Data Fig. 1f, g). Expression of centrin1-GFP to visualize the centrioles revealed that virtually all cells with invasive protrusions exhibited centrosome amplification (Fig. 1c). An independent approach, using an organotypic culture system to assay for fibroblast-lead collective migration, confirmed that centrosome amplification promotes invasion, both of MCF10A cells and non-transformed keratinocytes (HaCaTs) (Fig. 1d and Extended Data Fig. 1h).
Figure 1. Invasive behavior of epithelial cells triggered by centrosome amplification.
a, Left: cells stained for microtubules (α-tubulin; red), centrioles (centrin2, green) and DNA (blue). Scale bar: 10µm. Right: fraction of cells with centrosome amplification. Error bars represent mean ± SE from 3 independent experiments. b, Left: fraction of invasive acini in 3-D cultures. Right: representative images of normal acinus and acinus with invasive protrusions. Scale bar: 10µm. Error bars represent mean ± SE from 4 independent experiments c, Left: cells stained for F-actin (red), centrioles (centrin1-GFP, green, inset white), and DNA (blue). Scale bar: 10µm. Right: Fraction of acini with centrosome amplification after Plk4 OE. Error bars represent mean ± SE from 3 independent experiments. d, Top: Scheme of the organotypic culture model used to assess invasion. Bottom: H&E staining if sections of MCF10A cells plated on the organotypic model, with and without fibroblasts (black arrows show highly invasive areas). Percentage of invasion: −Dox= 11.7±0.83; +Dox= 26.1±6.5. Scale bar: 100µm. e, Fraction of invasive acini in tetraploids. Error bars represent mean ± SE from 3 independent experiments. f, Acini stained for laminin-V (green), F-actin (red) and DNA (blue). White arrow indicates laminin-V degradation. Scale bar: 10µm. g, Fraction of invasive acini in cells that overexpress ErbB2, with or without centrosome amplification. Error bars represent mean ± SE from 3 independent experiments. All p-values were derived from unpaired two-tailed t-test (***, p<0.0005).
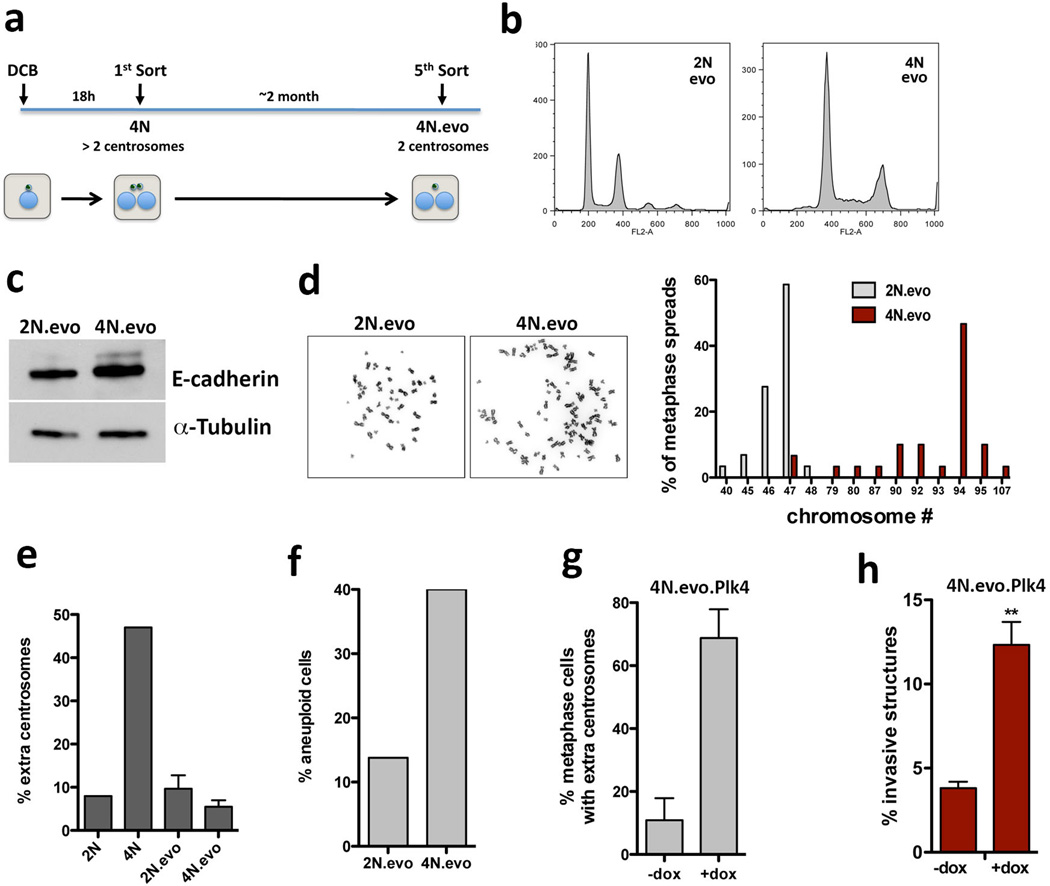
Cytokinesis failure was induced in MCF10A cells with dihydrocytochalasin B (DCB) to generate centrosome amplification without Plk4 overexpression. Newly-generated tetraploid cells, with doubled centrosome content, were isolated by Fluorescence Activated Cell Sorting (FACS). A control population of tetraploid cells where extra centrosomes were spontaneously lost were generated, as previously described2 (evolved tetraploids, 4N.evo, Extended Data Fig. 2a–e). Tetraploid cells with extra centrosomes were invasive in 3-D cultures, whereas 4N.evo cells were not (Fig. 1e). Plk4 overexpression in 4N.evo cells induced centrosome amplification accompanied by invasive protrusions, demonstrating that 4N.evo cells still retained the ability to become invasive (Extended Data Fig. 2g, h).
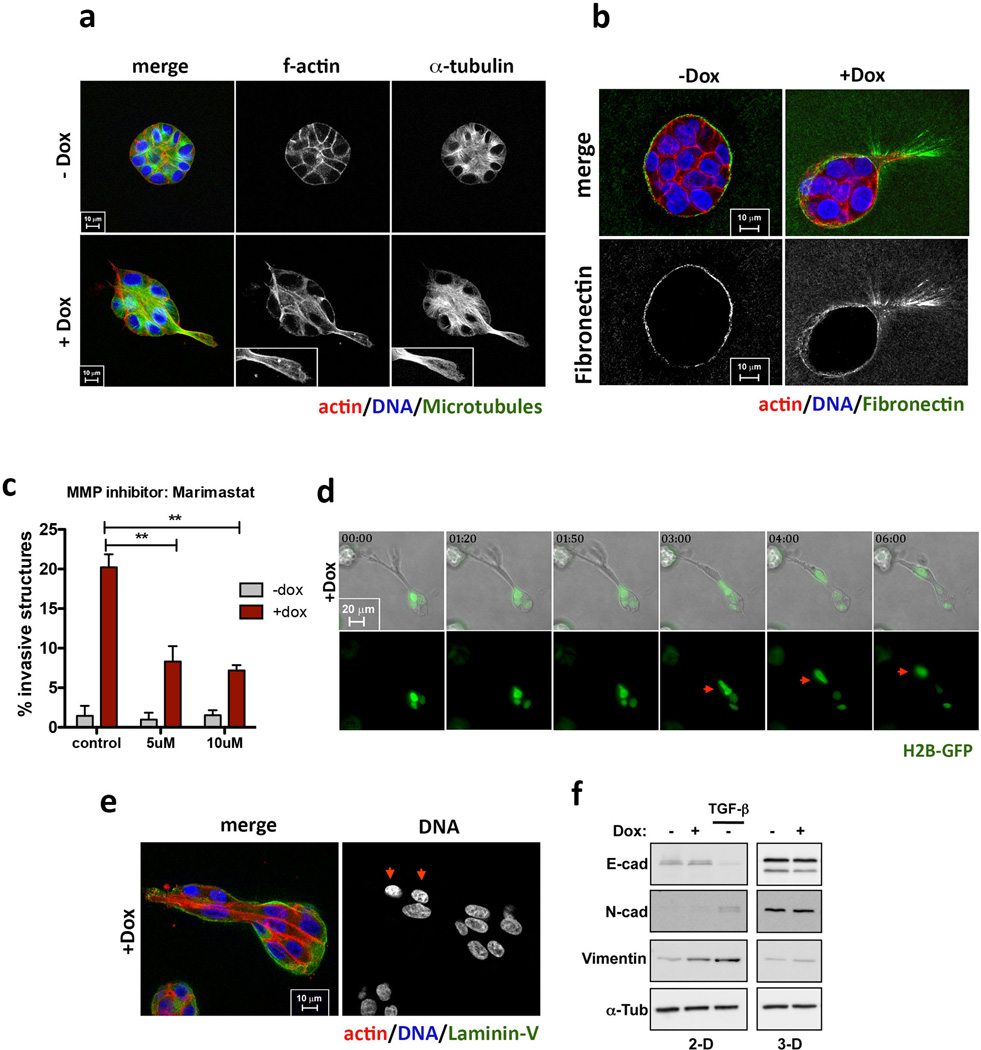
Invasive protrusions are accompanied by the degradation of Laminin-V (Fig. 1f) and collagen-I (DQ-Col-I) (Extended Data Fig. 1i), contain actin and microtubules (Extended Data Fig. 3a) and are surrounded by the extracellular matrix component fibronectin (Extended Data Fig. 3b). Consistent with centrosome amplification promoting matrix degradation, the invasive phenotype was partially suppressed by inhibition of metalloproteinases using Marimastat (Extended Data Fig. 3c). Live cell imaging showed that protrusions are highly dynamic, constantly extending and retracting (Supplementary videos 1 and 2), which may partially explain why only a fraction of acini with extra centrosomes exhibits invasive protrusions at a given time (Fig. 1c). The formation of an initial protrusion provided a track for the collective migration of multiple cells out of the acinus and into the surrounding matrix (Extended Data Fig. 3d, e, Supplementary video 3). Strikingly, this type of collective invasion resembles what has been observed in tumors in vivo. Indeed, many solid tumors typically exhibit collective invasion, which often involves the degradation of the extracellular matrix11.
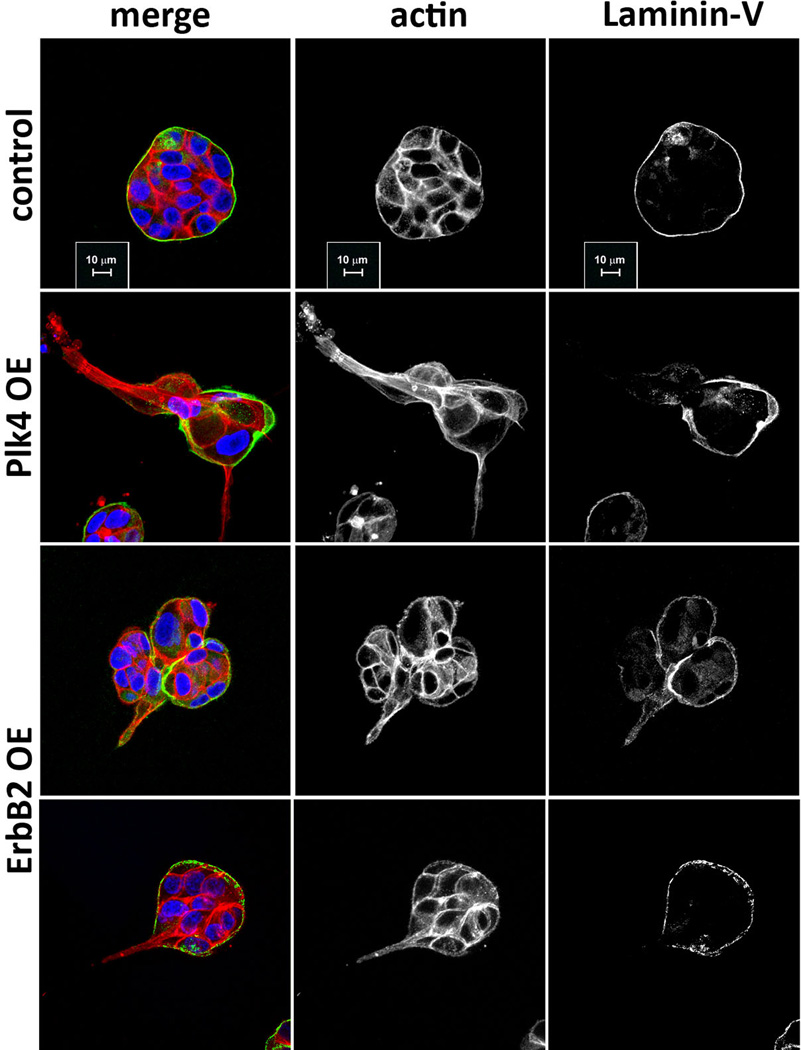
Invasion induced by centrosome amplification strongly resembled that induced by a bona fide breast cancer oncogene, ErbB24 (Extended Data Fig. 4). As in ErbB2 tumors12, cells with extra centrosomes retained the expression of E-cadherin (Extended Data Fig. 3f), suggesting that mechanisms other than a classical epithelial-to-mesenchymal transition account for the invasive phenotype. Importantly, when combined with ErbB2 overexpression, centrosome amplification enhanced the frequency of invasive acini (Fig. 1g).
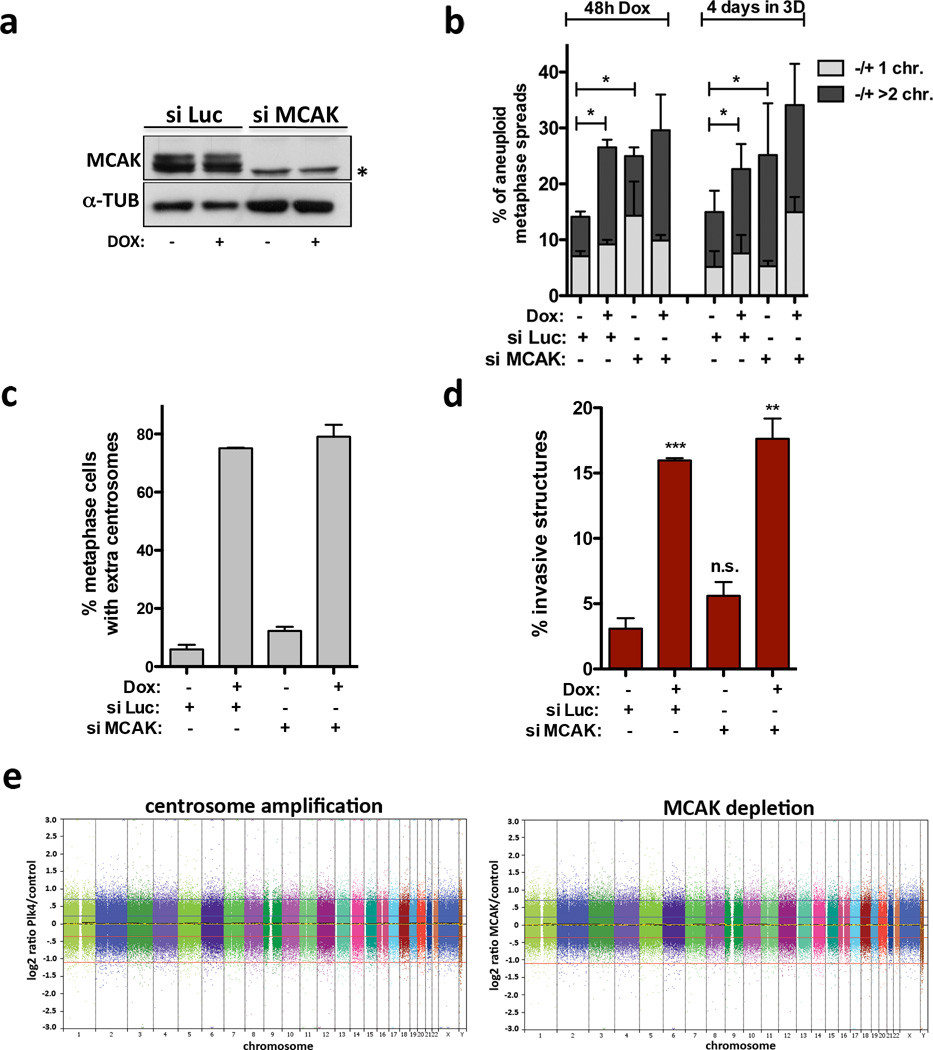
The induction of invasive protrusions by extra centrosomes could be an indirect consequence of aneuploidy that results from chromosome missegregation2,13. To directly test this hypothesis, we depleted MCAK, a kinesin important for chomosome segregation during mitosis14, to induce a comparable degree of aneuploidy before (48hrs post Plk4 induction) and after 4 days in 3-D culture (Fig. 2a, b). Cells depleted of MCAK neither increased centrosome number nor exhibited a significant increase in invasive protrusions (Fig. 2c, d). Similarly, aneuploidy, generated by inhibition of the spindle assembly checkpoint kinase Mps1 (Reversine)15 also failed to induce invasion (Extended Data Fig. 5a–c). In addition, although 4N.evo cells exhibit significant aneuploidy, they did not form invasive acini (Fig. 1e, Extended Data Fig. 2f). Finally, single-nucleotide polymorphism analysis (SNP-arrays) demonstrated that neither cells with extra centrosomes nor depletion of MCAK accumulate a recurrent aneuploidy after 4 days in 3-D culture (Fig. 2e and Extended Data Fig. 5d). Thus, aneuploidy per se is not responsible for the invasive behavior.
Figure 2. The induction of aneuploidy does not generate invasive acini.
a, Western blot showing depletion of MCAK by siRNA (48hrs). *Marks a non-specific band. b, Quantification of chromosome number, shown as the percentage deviation from the mode, in cells before adding to 3-D cultures (48hrs) and after 3-D cultures (~100 spreads were scored per condition). Significance was determined by Chi-squared testing to compare the frequencies of nominal variables (*, p<0.05). c, Fraction of cells with centrosome amplification. Error bars represent mean ± SE from 3 independent experiments. d, Fraction of invasive acini. Error bars represent mean ± SE from 3 independent experiments. p-value derived from unpaired two-tailed t-test (***, p<0.0005; **, p<0.005; n.s. not significant). e, SNP analysis of cells with extra centrosomes and depleted of MCAK. Shown are log2 copy number ratios of the indicated samples relative to their controls.
Centrosome amplification also leads to altered cilia signaling16 and to increased levels of p5317. However, we found that neither the parental MCF10A cells nor the derivatives with extra centrosomes formed cilia after 4 days in 3-D culture. Moreover, depletion of p53 did not alter centrosome amplification-mediated invasion (Extended Data Fig. 6a–d). In a transplant model using asymmetrically dividing neuroblasts from Drosophila, centrosome amplification induces tumors that, interestingly, are capable of metastasis18. Centrosome amplification in this system disrupts asymmetric cell division, resulting in stem cell expansion, potentially contributing to tumorigenesis. Because MCF10A cells do not undergo asymmetric cell division, this mechanism does not apply to our results. In the Drosophila neuroblasts, centrosome amplification may also disrupt cell polarization, which can trigger tumorigenesis in many systems. Although we cannot exclude effects on cell polarization in our system, we do note that MCF10A cells cannot form tight junctions and do not exhibit polarization of the apical Par3-Par6-aPKC complex19. Moreover, centrosome amplification does not impair the ability of MCF10A cells to asymmetrically position centrosomes, the main detectable polarization in these cells (Extended Data Fig. 6e, f).
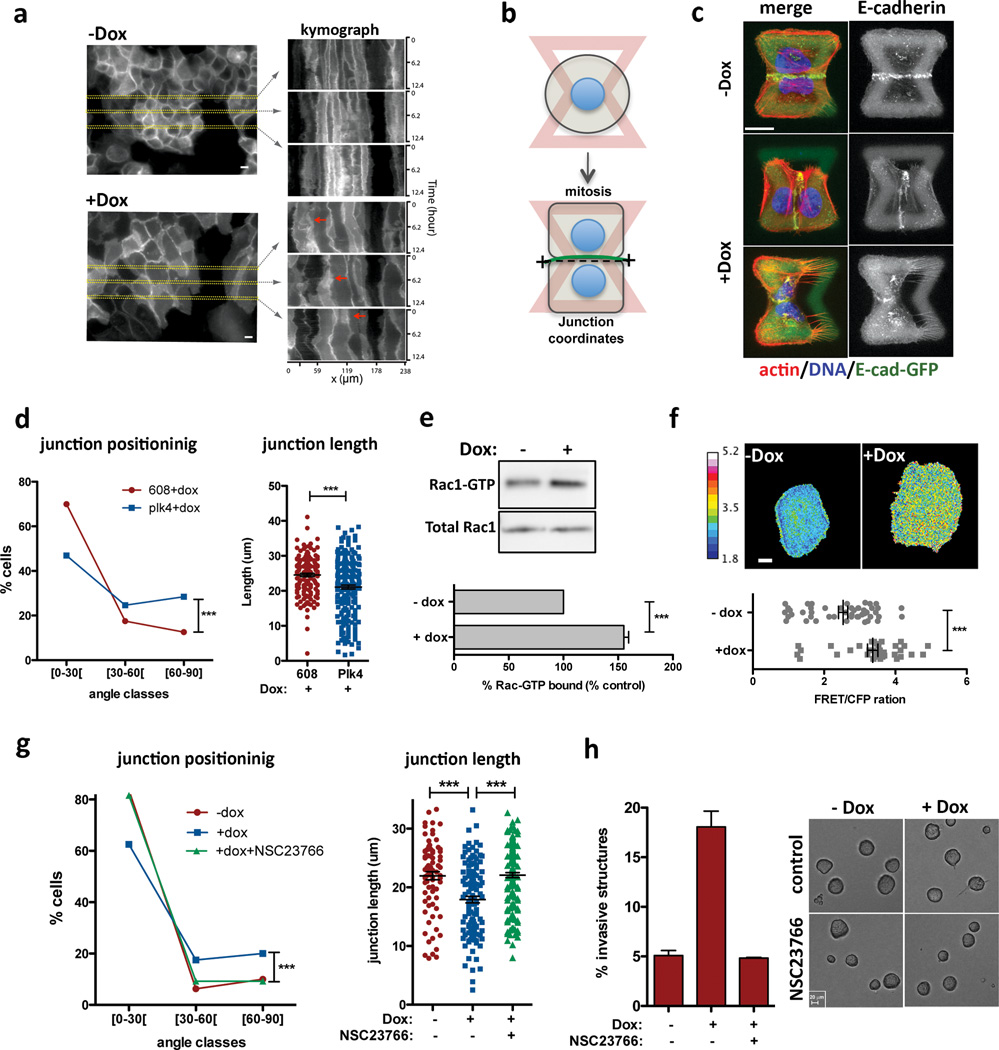
Insight into why cells with extra centrosomes are invasive in 3D cultures first came from observing the adhesive properties of single cells after cell division. As expected because they are epithelial cells, following mitosis, MCF10As formed cell-cell contacts, and remained as apposed cell pairs. By contrast, cells with extra centrosomes “scattered”, resulting in a high fraction of individual cells (Extended Data Fig. 7a, b, Supplementary videos 4 and 5), a characteristic associated with loss of cell-cell adhesion. Furthermore, live cell imaging in cells with a fluorescent membrane marker revealed that cell-cell contacts are not stable and often overlap in cells with extra centrosomes (Fig. 3a, Supplementary videos 6 and 7). As a direct measure of cell-cell junction integrity, we plated cells onto fibronectin micropatterns that were specifically designed to promote the formation of adherens junctions at a stereotypical position between the two cells (Fig. 3b)20. Consistent with the cell scattering effect, centrosome amplification produced marked defects in cell-cell junction positioning and size (Fig. 3c, d). This effect of centrosome amplification is similar to that described for loss of p120 catenin, whose knockdown weakens cell-cell contacts20, although centrosome amplification does not affect p120 levels (Extended Data Fig. 7c).
Figure 3. Centrosome amplification disrupts normal cell-cell adhesion because of Rac1 activation.
a, Kymograph analysis of cell-cell adhesion in live cells visualized with a plasma membrane marker (Rac-Raichu, CFP fluorescence). Red arrows mark areas of overlap. b, Scheme of the micro-pattern used. c, Images of cells (after mitosis) on micro-patterns labeled for E-cadherin (GFP; green), F-actin (red), DNA (blue), and fibronectin micro-pattern (green). Top: normal sized junction with a normal position (narrow angle); middle: abnormal junction position; bottom: smaller junction size. Scale bar: 10µm. d, Distribution of the cell-cell junctions angles (left) and size (right). n−Dox=143; n+Dox=216 Error bars represent mean ± SE. e, Top: Western blot from a pull-down experiment to detect GTP-bound Rac1. Bottom: quantification from 3 independent pull-down experiments. Error bars represent mean ± SE. f, Top: examples of FRET ratiometric images; color coded scale represents the level of Rac1 activation. Scale bar: 10µm. Bottom: levels of active Rac1 measured by FRET. n−Dox=50; n+Dox=38. Error bars represent mean ± SE. g, Inhibition of Rac1 with NSC23766 in cells plated on patterns. n−Dox=80; n+Dox=119; n+NSC23766=162. h, Left: fraction of invasive acini after treatment with NSC23766. Right: Images of control and NSC23766 treated acini. Scale bar: 20µm. Error bars represent mean ± SE from 3 independent experiments. All p-values p-values were derived from unpaired two-tailed t-test (***, p<0.0005).
These phenotypic characteristics induced by centrosome amplification are remarkably similar to what has previously been observed upon activation of Rac121,22, a small GTPase strongly associated with oncogenic signaling, and with the induction of invasiveness and metastasis23,24. This motivated the hypothesis that extra centrosomes might promote invasive-like effects through inappropriate activation of Rac1. Indeed, we found that centrosome amplification induced a consistent ~1.5-fold Rac1 activation using a biochemical pull-down assay to measure GTP-liganded Rac1 in multiple cell lines [Note: maximal Rac1 activity induced by EGF in MCF10A cells is ~2-fold (Fig. 3e and Extended Data Fig. 7d, e)]. This was confirmed by monitoring Rac1 activation in single cells using the Raichu-Rac1 fluorescence resonance energy transfer (FRET) biosensor25 (Fig. 3f and Extended Data Fig. 7f, g). Consistent with the known antagonism between Rac1 and RhoA, we found that cells with extra centrosomes have decreased active RhoA (Extended Data Fig. 7h). Thus, centrosome amplification in MCF10A cells activates Rac1.
Small molecule Rac1 inhibition (NSC23766) inhibited Rac1 activation and rescued defects in cell-cell adhesion, suggesting that Rac1 activation is responsible for the cell-cell adhesion defect in cells with centrosome amplification, (Fig. 3g and Extended Data Fig. 7i). Similar results were obtained in tetraploid MCF10A cells (Extended Data Fig. 8a, b). Furthermore, treatment with CK-666, an inhibitor of the Arp2/3 complex, an actin nucleator and important downstream target of Rac123, also partially rescued the defects in cell-cell adhesion induced by centrosome amplification (Extended Data Fig. 8c–e). These findings demonstrate that the cell-cell adhesion defects in cells with extra centrosomes are, to a significant degree, caused by increased Arp2/3-dependent actin polymerization that occurs downstream of Rac1 signaling. In addition, we found that Rac1 inhibition blocked the formation of invasive acini without impairing the ability of cells to form normal acini (Fig. 3h).
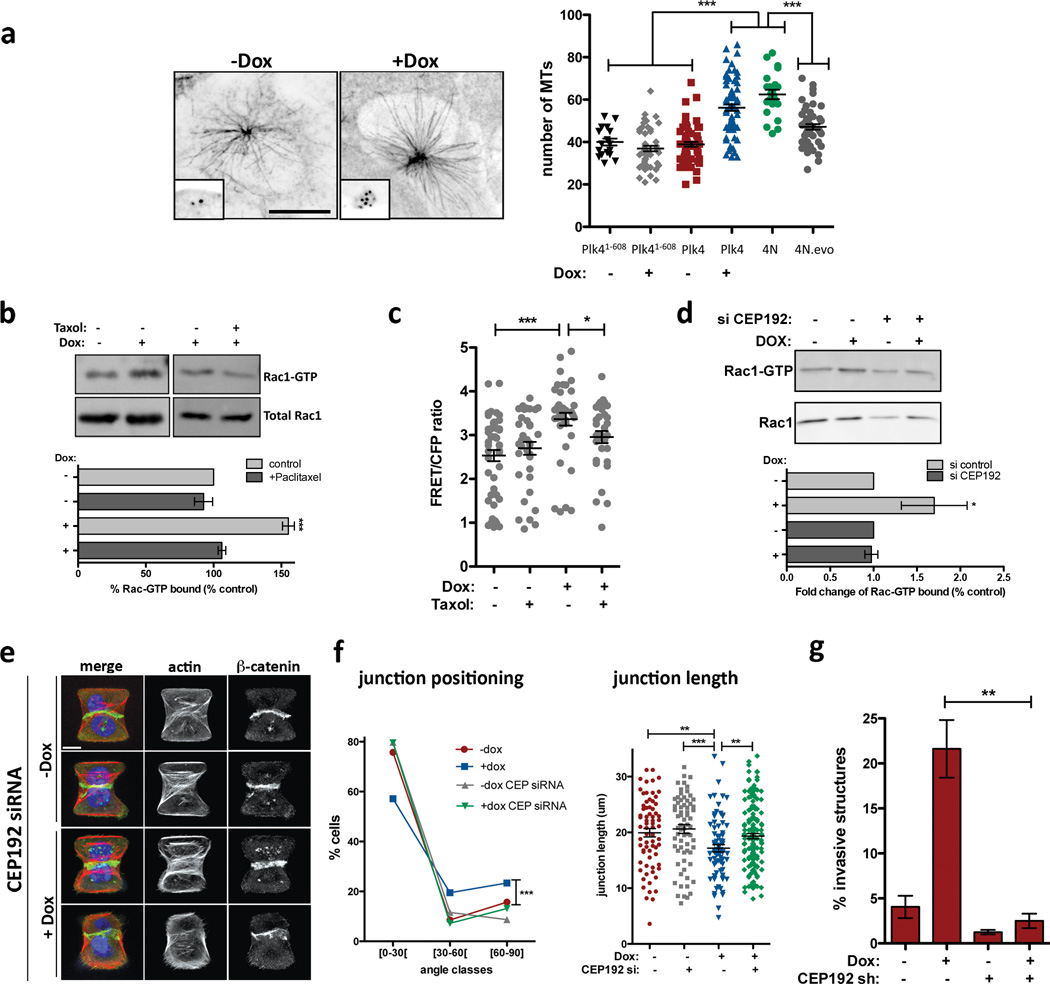
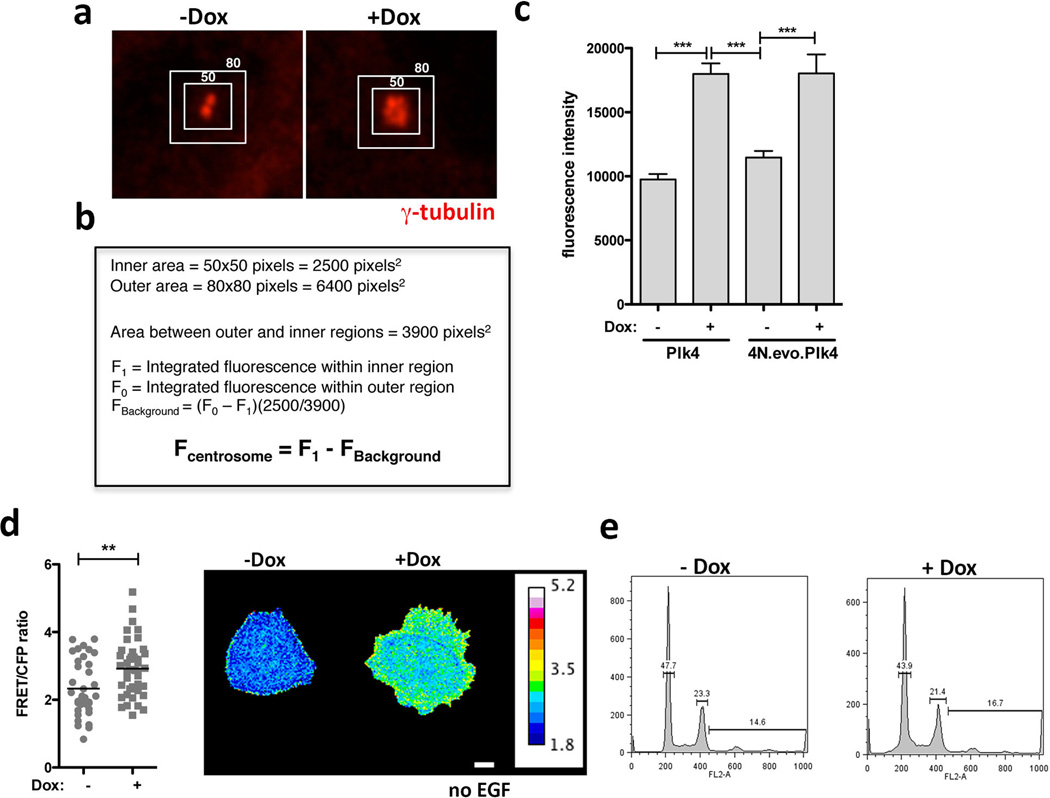
Previous work has established that microtubule polymerization after nocodazole washout induces Rac1 activation. This activation appears to require dynamic microtubules because it is suppressed by the microtubule-stabilizing agent, Paclitaxel26. We considered the possibility that centrosome amplification induces Rac1 activation through effects on centrosomal microtubule nucleation. As expected27, MCF10A cells with extra centrosomes display elevated levels of centrosomal γ-tubulin (Extended Data Fig. 9) and an increased capacity for microtubule-nucleation (Fig 4a, note that amplified centrosomes are almost always clustered in interphase). Moreover, Paclitaxel blocked the activation of Rac1 in cells with extra centrosomes (Fig. 4b), suggesting a similar requirement for dynamic microtubules26. These results were independently confirmed when Rac1 activity was monitored by FRET (Fig. 4c). Finally, Rac1 activation measured by FRET was also observed in cells with extra centrosomes deprived of EGF (Extended Data Fig. 9d), suggesting that this Rac1 activation is independent of any effects on growth factor signaling. Furthermore, induction of centrosome amplification (at 48hrs) does not alter the cell cycle profile (Extended Data Fig. 9e) arguing against cell cycle effects as the cause for Rac1 activation in cells with extra centrosomes.
Figure 4. Effects of centrosome amplification are mediated by increased nucleation of centrosomal microtubules.
a, Left: images of microtubules (α-tubulin; insets: centrioles) in cells after microtubule re-growth. Right: Microtubule numbers from the indicated cells. nPlk4(1–608) −Dox=18; nPlk4(1–608)+Dox=51; nPlk4−Dox=66; nPlk4+Dox=71; n4N=22; n4N.evo=49. Error bars represent mean ± SE. b, Top: Pull-down assay to measure GTP-bound Rac1 after Paclitaxel treatment. Bottom: quantification of the levels of Rac1-GTP. Error bars represent mean ± SE from 3 independent experiments. c, FRET ratios for measuring active Rac1 in cells after the indicated treatments. n−Dox=50; n−Dox+Taxol=38; n+Dox=38; n+Dox+Taxol=32. Error bars represent mean ± SE. d, Top: Pull-down assay to measure GTP-bound Rac1 after CEP192 depletion by siRNA. Bottom: quantification of the levels of Rac1-GTP. Error bars represent mean ± SE from 4 independent experiments. p value derived from Wilcoxon test (*, p<0.05). e, Images of cells depleted of CEP192 on micro-patterns labeled for β-catenin (green), F-actin (red), DNA (blue), and fibronectin micro-pattern (green). Scale bar: 10µm. f, Angles and sizes of cell-cell junctions after depletion of Cep192 by siRNA. nctr.siRNA−Doc=71; nctr.siRNA+Doc=78; nCEP.siRNA−Dox=69; nCEP.siRNA+Dox=150. Error bars represent mean ± SE. g, Fraction of invasive acini seen after depletion of Cep192 by shRNA. Error bars represent mean ± SE from 3 independent experiments. For panels a, b, c, f and g, p-values were derived from unpaired two-tailed t-test (***, p<0.0005; **, p<0.005; *, p<0.05).
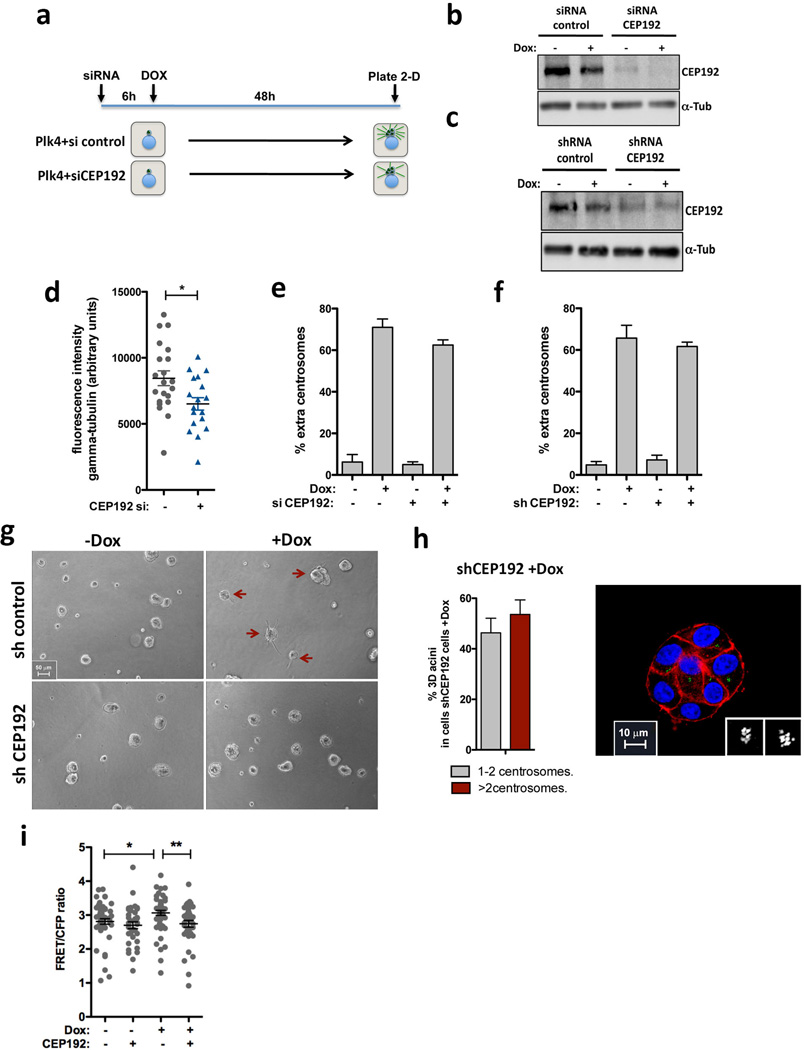
We next examined the impact of increased centrosomal microtubule nucleation on cell-cell adhesion and the development of invasive structures. To do so, centrosomal microtubule nucleation was moderately decreased by RNAi-mediated knockdown of Cep192, which encodes a centrosomal protein required for interphase recruitment of γ-tubulin to the centrosomes28. As described28, this protocol decreases centrosomal γ-tubulin without affecting centrosome number (Extended Data Fig. 10a, b, d, e). Consistent with our hypothesis, the depletion of Cep192 inhibited Rac1 activation and restored normal cell-cell adhesion among cells with centrosome amplification (Fig. 4d–f and Extended Data Fig. 10). Most significantly, partial depletion of Cep192 by shRNA fully suppressed the invasive phenotype in cells with extra centrosomes without compromising cell viability or centrosome amplification, even after 4 days in 3-D cultures (Fig. 4g, Extended Data Fig. 10c, f–h). These results strongly suggest that increased centrosomal microtubule nucleation in cells with extra centrosomes triggers invasion. Although it remains unclear how dynamic microtubules activate Rac129, our data suggests that Rac1 activation downstream of microtubule nucleation plays a central role in this phenomenon.
Deregulated Rac1 activity has been implicated in the pathogenesis of many tumor types and is known to drive tumor invasion and metastasis24. Previous studies have demonstrated that Rac1 activation in tumors can be regulated by multiple mechanisms24. We showed that centrosome amplification is likely another common mechanism for Rac1 activation during tumorigenesis, and that centrosome amplification may augment other oncogenic signals. In addition to Rac1 activation, additional mechanisms contribute to the effects of centrosome amplification. Indeed, gene expression analyses of 3-D cultures showed that TGF-β pathway, involved in metastasis formation and associated with tumor aggressiveness30, is strongly upregulated in cells with extra centrosomes (SAG and DP unpublished data).
Many studies have noted a positive correlation between centrosome amplification and advanced stage tumors, recurrence and poor survival3, yet the mechanistic basis for this correlation has remained unclear. Here we provide the first evidence that centrosome amplification can mimic and accentuate the effects of oncogenes in triggering cellular invasion. These findings illustrate the integral relationship between cellular signaling and the cytoskeleton, underscoring the importance of this relationship to tumor progression.
Full Methods
Cell culture
Human mammary epithelial MCF10A cells were cultured as previously described31. Briefly, MCF10A cells were grown in DMEM/F12 (Invitrogen) supplemented with 5% donor horse serum (Sigma), 20 ng/ml epidermal growth factor (EGF; Sigma), 10 µg/ml insulin (Invitrogen), 100 µg/ml hydrocortisone (Sigma), 1 ng/ml cholera toxin (Sigma), 100 U ml−1 penicillin and streptomycin (Invitrogen). The MCF10A cell line overexpressing the human ERBB2 gene (MCF10A.ErbB2 or MCF10A.NeuN) was previously characterized32,33. For 3-D cultures cells were grown in the same medium with reduced horse serum (2%) and EGF (5 ng/ml). To assay invasion in 3-D cultures, cells were grown in a mix of Matrigel:Collagen-I, as previously described34. The addition of collagen-I to Matrigel facilitates invasion by increasing matrix stiffness35. We used growth factor-reduced Matrigel™ (BD Biosciences) lots with protein concentrations between 9 and 11 mg/ml. Collagen-I (BD Biosciences) was used at 1.6 mg/ml. Cells were grown for 4 days in 3-D cultures before quantification of invasion. Between 200–300 acini were scored per condition for each experiment. To assess collagen-I degradation in 3-D cultures, we added to the Matrigel:Collagen-I mix 25 µg/ml of quenched DQ-collagen-I (Molecular Probes). After degradation, DQ-collagen-I becomes fluorescent.
To collect cells from 3-D cultures we incubated cells with Dispase (BD Biosciences) for 30–60 minutes at 37°C, according to manufacturer’s instructions. Cell aggregates were then trypsinized to obtain single cells suspensions and processed either for western blotting or to prepare chromosome spreads.
The alveolar epithelial cell line 16HBE, provided by Alan Hall, was cultured in MEM (Invitrogen) supplemented with GlutaMAX, Earle’s salts, 10% of FBS and 100 U ml−1 penicillin and streptomycin (REF). The non-transformed keratinocyte line (HaCaT), primary breast fibroblasts (1492N) and skin fibroblasts (HDFs) were provided by John Marshall. HaCats and HDFs were cultured in DMEM supplemented with 10% of FBS and 100 U ml−1 penicillin and streptomycin, 1492N were cultured in 50:50 Ham’s F12:DMEM supplemented with 10% of FBS and 100 U ml−1 penicillin and streptomycin We used Tetracyclin-Free FBS (Hyclone) to grow the 16HBE and HaCaTs cells expressing the Plk4 construct to inhibit Plk4 expression in the absence of Doxycyclin.
Organotypic culture system
The organotypic culture system was adapted from previously described methods36,37. Briefly, 200ul of culture media containing epithelial cells or epithelial cells plus fibroblasts was added on top of the polymerized matrigel:collagen-I mixture in each well. Co-cultured of epithelial cells with fibroblasts was done as follows: HaCats cells were grown with HDF fibroblasts and MCF10A cells were grown with human primary fibroblasts (1492N). 600ul of culture media was added to the bottom of the transwell. Fibroblasts invade the matrigel:collagen-I layer whereas most of the non-invasive epithelial cells grow on top of this layer. Medium was changed every 2 days. Cells were grown for 7 days before samples were fixed and stained.
Cells in transwells were fixed in formalin o.n. at room temperature. Inserts were removed using scalpel and placed in 70% of ethanol and processed for histology. Paraffin embedded inserts were sectioned and stained for H&E (Hematoxylin and Eosin). For both MCF10A and HaCaTs, the percentage invasion was calculated as the number of cells that entered the matrigel:collagen-I layer relative to the total number of cells per each well.
Lenti and Retroviral Vectors
For the generation of the inducible Plk4 overexpression system we used the lentiviral vectors pLenti-CMV-TetR-Blast (17492, Addgene) and pLenti-CMV/TO-Neo-Dest (17292, Addgene)38. WT Plk4 and Plk41–608 cDNAs were cloned using the gateway system into the pLenti-CMV/TO-Neo-Dest vector. Cells were first infected with a lentivirus containing the TetR and selected with Blasticidin (10-5µg/ml). After selection, cells were infected with the lentivirus containing the WT Plk4 or Plk41–608 transgenes and selected with Geneticin (200–100µg/ml). Note that no clones were selected at any point and that all the selected cells were pooled to make a population. All the cell lines generated were induced with 2µg/ml of Doxycyclin for 48hrs to induce the expression of the transgenes. pLKO.1 lentiviral vector containing Cep192 shRNA hairpin sequence was obtained from The RNAi consortium (TCR) at the Broad Institute (5'-CCCGG GAGGCATCAGTTAATACTGAT-CTCGAG-ATCAGTATTAACTGATGCCTC TTTTTTG-3'). pLKO.1 lentiviral vector expressing p53 shRNA was obtained from Addgene (19119)39. Lentilox Centrin1-eGFP construct was a generous gift from J. Loncarek. pLenti6/V5 lentiviral vector expressing H2B-GFP was cloned as previously described2. The Rac1-Raichu biosensor, a generous gift from M. Matsuda, was subcloned into the retroviral vector pWZL-blast using the following restriction sites: EcoR1 and SalI.
Chemicals
Doxycycline (Sigma) was used at 2 µg/ml. The following doses of inhibitors were used: 25 µM NSC23766 (EMD Millipore), 50 µM CK-666 (Sigma), 0.1 µM Riversine (Cayman Chemical), 10 mM Paclitaxel (Sigma), 4 µM of Dihydrocytochalasin B (DCB; Sigma), 200 ng/ml Doxorubicin (Sigma) and 5 µM and 10 µM of Marimastat (BB-2516; Sigma).
Indirect immunofluorescence microscopy
2-D
Cells plated in glass coverslips were washed in PBS and fixed with 4% of PFA for 15 minutes at room temperature (RT). For centriole/centrosome staining, cells were fixed with ice-cold methanol at −20°C for 10 minutes. Following fixation, cells were premeabilized with PBS-0.2% Triton X-100 for 5 minutes, blocked in PBST (PBS-5%BSA-0.1% Triton X-100) for 30 minutes, and then incubated with primary antibodies in PBST for 60 minutes. Cells were washed with PBS and incubated with species-specific fluorescent secondary antibodies (Alexa-conjugated, Molecular Probes). DNA was stained with Hoechst 33342 (1:5000; Invitrogen) for 5 minutes in PBS. Coverslips were mounted with ProLong Antifade mounting medium (Molecular Probes). Antibodies used included anti α-tubulin DM1a (1:500; Sigma-Aldrich), anti-centrin2 (1:100; Santa Cruz), anti γ-tubulin GTU88 (1:500; Sigma-Aldrich) and anti β-catenin (1:500; Abcam). Phalloidin was used to stain F-actin (1:250; Alexa Fluor 568; Invitrogen). Images were collected with a Yokogawa CSU-22 spinning disk confocal mounted on a Zeiss Axiovert microscope using 404, 488 and 561 nm laser light. Captured images from each experiment were analyzed with Slidebook software (Intelligent Imaging Innovations). Measurement of centrosome number was preformed in mitotic cells, ~100 were scored in each experiment.
3-D
Immunofluorescence of 3-D cultures was carried out as previously described31. Briefly, cells grown in 3-D cultures were washed with 1× PBS and fixed in 5% of formalin (Sigma) in PBS for 20 minutes at 37°C. After fixation cells were rinsed 3 times, 10 minutes each, with PBS:Glycine (100 mM) and permeabilized with 0.5% Triton X-100 in PBS for 10 minutes. Cells were blocked with 10% of goat serum (Sigma) in IF buffer for 1hr at RT and primary antibodies were incubated in the same solution over night at 4°C. Cells were washed 3 times, 20 minutes each, with IF buffer. When required, cells were incubated with secondary antibodies for 1hr at RT (Alexa-conjugated, Molecular Probes). Cells were washed 2 times with IF buffer and 1 time with PBS followed by incubation with Hoechst 33342 (1:2500; Invitrogen) for 20 minutes. 3-D cultures were then mounted in ProLong Antifade mounting medium (Molecular Probes). Antibodies used included anti α-tubulin FITC conjugated DM1a (1:100; Sigma), anti Laminin-V Alexa Fluor 488 conjugated (1:100; Millipore), anti acetylated-tubulin 611B-1 (1:100; Sigma), antifibronectin (1:100; BD Biosciences) and anti-Pericentrin (1:100; Abcam). Phalloidin was used to stain F-actin (1:100; Alexa Fluor 568; Invitrogen). Images were collected with a Nikon A1R Laser Scanning Confocal head mounted on a Nikon Ti-E motorized inverted microscope using 404, 488 and 561 nm laser light. Captured images from each experiment were analyzed using NIS-Elements software (Nikon).
Long-term live-cell imaging
H2B-GFP expressing cells were grown on glass-bottom 12-well tissue culture dishes (MatTek) for 2-D imaging or in Lab-Tek chambered coverglass for 3-D imaging. Cells were imaged on a Nikon TE2000-E2 inverted microscope equipped with a cooled CCD camera (TE2000, Orca ER, Hamamatsu; Ti-E, Coolsnap HQ2, Photometrics), a precision motorized stage (Bioprecision, Ludl), and Nikon Perfect Focus. Microscope was enclosed within temperature and CO2-controlled environments that maintained an atmosphere of 37° C and 3–5% humidified CO2. GFP and bright field images were captured at multiple points every 4 minutes for 1–2 days with either 10X (0.3 NA) or 20X (0.5, 0.75 NA) objectives. Captured images from each experiment were analyzed using NIS-Elements software.
Immunofluorescence Quantification
Quantification of γ-tubulin fluorescence intensity associated with the centrosomes was performed as previously described40. Images were acquired with a 100× NA 1.45 Plan Apo objective. Stacks of 6 images with 0.6 µm step size were collected. Step size was calculated to have minimal pixel overlapping between steps. SUM intensity projections of the images were used to quantify fluorescence intensity using ImageJ. Computer generated 50 × 50 and 80 × 80 pixel regions were centered over each centrosomes (as shown in Fig. S10). The intensity value measured for the 50 × 50 pixel region include both centrosome and background fluorescence. Background fluorescence was obtained by subtracting the integrated value of 50 × 50 pixel region from the larger 80 × 80 pixel region. Integrated centrosomal fluorescence intensity was calculated by subtraction of the background fluorescence intensity from total fluorescence intensity (Fig. S10). The advantage of this approach is that it controls for the inhomogeneity in background fluorescence.
2D Cell-Cell Adhesion Analysis
MCF-10A cells expressing the Raichu-Rac (here used just to visualize the cell membrane), with and without centrosome amplification, were plated on glass-bottom tissue culture dishes (MatTek) coated with 20µg/ml Fibronectin (Sigma Aldrich) for 20min. Centrosome amplification was induced by 48 hr Plk4 induction, as described above. To monitor the cell-cell contact dynamics, we acquired timelapse series of images, visualizing the CFP moiety of the Raichu-Rac FRET reporter (Figure 3a and supplementary video 6 and 7) at 5 min intervals over 12.4 hours. To illustrate differences in cell-cell contact dynamics, we generated Kymographs (Figure 3a). The Kymograph was obtained by sequentially mounting a 1×336(pixel) region of interest from the videos, using ImageJ. Timelapse series were collected with a Nikon inverted microscope with epi-fluorescence optics using a 40× plan Apo NA 1.4 objective. The microscope was equipped with a Nikon Perfect Focus System and a Hamamatsu ORCA ER cooled CCD camera and controlled with Nikon NIS-Element software. To reduce illumination intensity, minimizing phototoxicity and photobleaching, we used a ND8 (1/8 transmission) neutral density filter.
Western Blotting
Cells were collected and ressuspended in Laemmli buffer and proteins were separated on sodium dodecyl sulfate-polyacrylamide gel electrophoresis (SDS-PAGE) and transferred onto PVDF membranes. Antibodies used included anti α-tubulin DM1a (1:2000; Sigma), anti-Cep192 (1:1000; generous gift from L. Pelletier), anti-MCAK (1:1000; Bethyl Laboratories), anti-p53 (1:1000, Cell Signaling), anti-P-p53 (1:1000, phospho-Ser15, Cell Signaling), E-cadherin (1:1000, Invitrogen) and anti-Rac1 (1:1000, BD Biosciences). Images were acquired using ImageQuant LAS4000 (GE Healthcare) and when required band intensity was quantified using ImageJ.
siRNA
siRNA was preformed using Lipofectamine RNAiMax (Invitrogen) according to manufacture’s instructions. 50nM of CEP192, MCAK and Luciferase (negative control) siRNA was used per well in a 6-well plate. After 6hrs of incubation, transfected cells were washed and normal growth medium was added. Cells were analyzed at 48hrs after transfection. ON-Target plus SMART pools were used for MCAK and CEP192 siRNA (Dharmacon):
- Human KIF2C/MCAK siRNA (L-004955-00-0005):
- GGCAUAAGCUCCUGUGAAU (J-004955)
- CCAACGCAGUAAUGGUUUA (J-004955-07)
- GCAAGCAACAGGUGCAAGU (J-004955-08)
- UGACUGAUCCUAUCGAAGA (J-004955-09).
- Human CEP192 siRNA (L-032250-01-0005):
- UGUGAAGAAAUACGAGAUA (J-032250-09)
- GCUCAGCGGUAUUUGGGAA (J-032250-10)
- GUCUAGAACUCGAGAAUCA (J-032250-11)
- GGUUGAAGCAGUAGAGAGU (J-032250-12)
Single-nucleotide polymorphism (SNP)
Cells from 3-D cultures were recovered after 4 days as described above (see Cell Culture section for details) and genomic DNA was prepared using DNA purification Kit (Qiagen) according to manufacturer’s instructions. Genomic DNA was used to perform for analysis with genome-wide human SNP 6.0 arrays to determine copy number in MCF10A control cells, MCF10A after induction of centrosome amplification and MCF10A depleted of MCAK. SNP array data was analyzed with the Nexus Copy Number Software (BioDiscovery; http://www.biodiscovery.com/software/nexus-copy-number/), using the “Matched Paired Analysis” module. The SNP data discussed in this publication have been deposited in NCBI’s Gene Expression Omnibus45 and are accessible through GEO Series accession number GSE55042 (http://www.ncbi.nlm.nih.gov/geo/query/acc.cgi?acc=GSE55042).
Microtubule-Polymerization assay
Cells plated in glass coverslips were transferred to ice cold medium and incubated 1hr on ice to depolymerize microtubules. Cells were then incubated with medium at 37°C for 30 seconds to allow microtubules to polymerize and fixed immediately in ice-cold methanol for 10 minutes. Cells were stained for microtubules and centrioles (as described above) and microtubule number was quantified manually. Images of cells used in the analysis were acquired from 2 independent experiments.
qRT-PCR
Plk4 is highly unstable and we were not able to monitor its transient overexpression by western blotting. qRT-PCR was therefore used to determine the extent of its expression. RNA was prepared using Qiagen RNAeasy kit according to manufacturer’s instructions. For 3-D cultures, RNA was initially harvested using Trizol, and after chloroform extraction, the upper aqueous phase was used to purify RNA using the RNAeasy kit. 300 ng of RNA was used to produce cDNA using qScript cDNA SuperMix kit (Quanta Bioscience), according to manufacturer’s instructions. For qRT-PCR, we used Power SYBR Green followed by analysis with ViiA PCR machine (Applied Biosystems). Primers used to assess the levels of Plk4 overexpression only amplify the exogenous WT Plk4 or Plk41–608 sequences.
List of Primers for qRT-PCR:
Plk4-forward: 5’-CAG GAT TTG CCC GGG ATG GCG-3’
Plk4-reverse: 5’-AAC CAG TGT GAA TGG ACT CAG CTC T-3’
GAPDH-forward: 5’-TTA AAA GCA GCC CTG GTG AC-3’
GAPDH-reverse: 5’-CTC TGC TCC TCC TGT TCG AC-3’
Rac1-GTP Pulldown
Rac1-GTP pulldown assay was preformed using the Rac1 activation kit (Cytoskeleton) according to manufacturer’s instructions. We used cells plated in one 10 cm dish per assay. Cells were resuspended in 400 µl of lysis buffer and 15 µl of CRIB/PBD beads were used to pull-down active Rac1. Extracts were incubated with the beads for 30 minutes. All the procedures were done at 4°C and buffers were kept ice-cold. After washing, beads were resuspended in 15 µl of Laemmli buffer and processed for Western blotting. To inhibit MT dynamics, cells were treated with 10mM of Paclitaxel for 1hr26.
Generation of tetraploid cells with normal centrosome number
MCF10A cells were treated with 4 µM DCD for ~18hrs, washed every 5 minutes for 30 minutes, and then FACS sorted by DNA content using Hoechst at 1:2500 (Molecular Probes). Cells with a DNA content of 8c (dividing tetraploid cells) were isolated and cultured for ~8 days before a second FACS sorting to re-isolate 8c cells. By sort 4, nearly 100% of tetraploid cells (as assessed by FACS and karyotyping) had two centrosomes.
Chromosome Spreads
MCF10A cells were treated with 20 ng/ml colcemid (Gibco) for 4hrs, trypsinized, resuspended in 75 mM of KCl and incubated for 30 minutes at 37°C. Cells were then fixed with 3:1 ice-cold methanol:acetic acid, (Carnoy’s solution) pelleted, and then washed three times more with methanol:acetic acid before being dropped on a pre-cleaned glass side. Cells were allowed to dry on the slide and were then stained for 3 minutes with Giemsa stain in 1X Gurr’s buffer (Gibco). Following a wash in Gurr’s buffer, coverslips were added to slides and sealed with Permount (Fisher). Images of spreads were taken with a 100X objective on a Zeiss upright microscope and chromosomes were counted manually using PhotoShop. The Chi square test of independence for nominal variables was used to calculate the p value.
FACS
Cells were fixed with 70% ethanol at 4°C followed by incubation with 250 µg/ml RNaseA and 10 µg/ml propidium iodide (Invitrogen) at 37°C for 30 minutes. FACS analysis was performed with a FACScalibur flow cytometer (Becton Dickinson) and data analysed with CellQuest software.
Micropatterning
Glass coverslip micropatterning was performed as previously described41. Coverslips were first spin-coated with adhesion promoter Ti Prime (MicroChemicals) and then with 1% polystyrene in toluene at 3000 rpm. Polystyrene coated coverslips were oxidized through oxygen plasma (FEMTO; Diener Electronics) 15 seconds at 30W before incubating with 0.1 mg/mL PLL-PEG in 10 mM HEPES pH=7.4 for 30 minutes. After drying, coverslips were exposed to deep UV (UVO cleaner, Jelight) through a photomask (TOPPAN) for 5 minutes. Right after UV activation, coverslips were incubated with 20 µg/mL of fibronectin (Sigma), and 20 µg/mL of fluorescent fibrinogen conjugate (Invitrogen) solution in PBS for 30 minutes. Coverslips were washed 3 times with sterile PBS before plating cells. Approximately 0.5 million cells were seeded onto micropatterned chip and were washed after 30 minutes to remove non-attached cells, which almost always resulted in single cells per micropattern. Cells were allowed to divide for 16hrs and then treated either with NSC27633 (25 µM) or CK-666 (50 µM) for 6hrs, before fixation. For Cep192 siRNA, cells were plated after 48hrs of siRNA treatment. Images of cells used in the analysis were acquired from 2 independent experiments.
Note that when the cells divide on these patterns, spindle orientation is completely random with respect to the geometry of the pattern. The cells also move after division prior to establishing normal cell-cell contacts, further altering the position of the prior division site relative to the site of eventual cell-cell contact. Thus, the final adhesion pattern is completely random relative to the initial (and random) orientation of the spindle, as previously described20.
Rac1 FRET
For FRET experiments we used MCF10A cells stably expressing Raichu-Rac25. Centrosome amplification was induced with Dox for 48hrs and ~10000 cells/ml of control and extra-centrosomes cells were plated onto 20µg/ml fibronectin (Sigma Aldrich) coated glass bottom dishes/plates (MatTek) for 6hrs. For EGF depletion experiments cells incubated without EGF for 15hrs.
FRET acquisition
Before acquisition, to increase the signal to noise, the culture medium was exchanged with 199 medium (Life Technologies) without serum and phenol red. For FRET imaging, cells were excited using a Nikon Intensilight source with a 430/24nm (for CFP) excitation filter with a dual band pass (ECFP/EYFP #89002) dichroic mirror and 470/24 (for CFP) and 535/40 (for FRET and YFP) emission filters from Chroma (Bellows Falls, VT). To reduce illumination intensity and thus minimize phototoxicity and photobleaching, we used a ND8 (1/8 transmission) neutral density filter. All images were collected with Nikon Ti inverted microscope with epi-fluorescence optics equipped with a 40× plan Apo NA 1.4 object lens, perfect focus system and a Hamamatsu ORCA ER cooled CCD camera controlled with Nikon NIS-Element software.
The following steps were taken to calculate the average magnitude and spatial variation of the camera’s noise for image correction of the acquired channels (CFP, FRET): (i) a sequence of 10 dark-current images were taken with 600ms exposure time and 4×4 binning as the experimental images, but with no light incident on the CCD; (ii) a sequence of 10 shade/illumination correction images for each channel (CFP and FRET) were taken with 600ms exposure time and 4×4 binning as the experimental images, but acquired on a blank area without any objects. The average dark-current and shade images were calculated by averaging the acquired 10 images by using ImageJ. Single channel images (CFP, FRET) for each field view visualizing maximum four non-contacting cells were collected by using an exposure time of 600ms, 4×4 binning, a ND8 (1/8 transmission) neutral density filter and illumination light shuttered between acquisitions.
FRET analysis
The Biosensor software from Dr. Gaudenz Danuser’s laboratory (http://lccb.hms.harvard.edu/index.html) along with a series of automated ImageJ macros were used to calculate the FRET ratio images. The acquired CFP and FRET images were corrected for the average dark-current, shading and background subtracted by using Biosensor or ImageJ. Then, single cell images from each channel (CFP and FRET) were segmented by using the ImageJ minimum and mean threshold method, and the relative regions of interest (ROIs) were recorded. Single cell mask images having background and foreground (cell image) pixel values equal to zero and one, respectively, were calculated from each cell ROI by ImageJ. To set the image background pixels to zero, CFP and FRET images were multiplied by the corresponding calculated image masks. Finally the FRET Ratio images are obtained by dividing the processed FRET image by the CFP image.
Single cell average FRET/CFP values representing the Rac1 activation levels were obtained by calculating the mean pixel value of the FRET ratio images for each ROI (single cell). FRET/CFP values were collected from 2 independent experiments. An unpaired two-tail t-test statistical analysis was used to obtain level of significance between different experiment conditions.
Extended Data
Extended Data Figure 1. Characterization of cells after transient overexpression of Plk4 or Plk41–608.
a, Scheme of the experimental design to induce centrosome amplification. Transient overexpression of Plk4 and Plk41–608 is achieved by addition of Dox for 48hrs (2-D culture) followed by removal of Dox and growth in 3-D culture for 4 days in the absence of Dox. b, qRT-PCR showing the levels of induction of the Plk41–608 and WT Plk4 transgenes in cells after 48hrs of Dox. Error bars represent mean ± SE from 3 independent experiments. c, qRT-PCR showing the expression of Plk4 after 48hrs of Dox (2-D) and after 4 days in 3-D cultures (3-D). Note that Plk4 OE after 4 days in 3-D cultures is shut-off. Error bars represent mean ± SE from 3 independent experiments. d, Proliferation curve of cells after induction of Plk4 and Plk41–608 over 72hrs. Centrosome amplification decreases cell proliferation. Error bars represent mean ± SE from 3 independent experiments. e, The fraction of cells with centrosome amplification at the indicated time points after Plk4 induction. Note that, since centrosome number is quantified in mitotic cells, this result demonstrates that cells with extra centrosomes can enter mitosis even after 72hrs of Dox treatment. Error bars represent mean ± SE from 3 independent experiments. f, Fraction of cells with centrosome amplification in a independently generated MCF10A.Plk4 cell line. Error bars represent mean ± SE from 3 independent experiments. g, Corresponding fraction of invasive acini in 3-D cultures. Error bars represent mean ± SE from 3 independent experiments. h, Centrosome amplification (Plk4 OE, +Dox) in non-transformed keratinocytes (HaCaTs) promotes invasion in the organotypic culture model. Left: Images show H&E staining of sections of HaCats cells. Black arrows indicate cells invading the matrix. Note that the invasion of groups of cells was only detected in the +Dox condition (Black arrowhead). Scale bar: 100µm. Right: Quantification of the percentage of cells that invade. Each dot in the graphic represents the percentage of invasion in each individual well/experiment analyzed. p-value was derived from unpaired two-tailed t-test *, p<0.05). i, Collagen-I degradation induced by centrosome amplification (green). Scale bar: 10µm. Please see Methods.
Extended Data Figure 2. Characterization of evolved diploid and tetraploid cells.
a, Scheme of the experimental design to obtain fresh MCF10A tetraploid cells with extra centrosomes (4N) and ‘evolved’ tetraploid cells that lost the extra centrosomes (4N.evo), as previously described2. b, FACS profiles of ‘evolved’ diploid (2N.evo) and tetraploid cells (4N.evo). c, Western blotting to detect E-cadherin in the ‘evolved’ cells indicates that 4N.evo maintain epithelial characteristics. d, Left: representative images of metaphase chromosome spreads of 2N.evo and 4N.evo. Right: quantification of chromosome number by karyotyping (~30 chromosome spreads were quantified in each condition). 4N.evo cells have a near-tetraploid karyotype. e, Centrosome amplification in diploid cells (2N or 2N.evo) newly generated tetraploid cells (4N) and evolve d tetraploid cells (4N.evo). f, Quantification of the percentage of aneuploid cells in the ‘evolved’ cells. The 4N.evo cells are aneuploidy despite their near-tetraploid genomes (~30 chromosome spreads were quantified in each condition). g, Quantification of centrosome amplification of 4N.evo cells overexpressing Plk4. Error bars represent mean ± SE from 3 independent experiments. h, Quantification of the invasive acini in 4N.evo cells after Plk4 OE. This experiment serves as a control to demonstrate that the 4N.evo cells retain their ability to amplify centrosomes and, after centrosome amplification, retain the capacity to form invasive acini. Error bars represent mean ± SE from 3 independent experiments. p-value derived from unpaired two-tailed t-test (**, p<0.005)
Extended Data Figure 3. Characterization of invasive structures in cells with extra centrosomes.
a, F-actin and microtubules in invasive protrusions: F-actin (red), microtubules (α-tubulin, green) and DNA (blue). Insets: higher magnification images of the invasive protrusions. Scale bar: 10µm. b, Fibronectin at invasive protrusions: cells were stained for F-actin (red), fibronectin (green) and DNA (blue). Scale bar: 10µm. c, Fraction of invasive acini in 3-D cultures after treatment with the broad spectrum MMP inhibitor, Marimastat (BB-2516). Error bars represent mean ± SE from 3 independent experiments. p-value derived from unpaired two-tailed t-test (**, p<0.005). d, Images from videos of Plk4 OE cells (Supplementary video 3), showing nuclei (labeled with H2B-GFP) migrating into an invasive protrusion (red arrows). Time scale - hrs:minutes. Scale bar: 20µm. e, Multiple cells can migrate into invasive protrusions: cells were stained for F-actin (red), laminin-V (green) and DNA (blue). Red arrows mark cells that migrated into the invasive protrusion. Scale bar: 10µm. f, Western blot showing levels of E-cadherin, N-cadherin and vimentin in cells with (+Dox) and without (−Dox) extra centrosomes before and after 4 days in 3-D culture. The western blots show that, unlike cells treated with TGF-β, cells with extra centrosomes do not acquire a canonical EMT phenotype. We do note a small increase in the levels of vimentin in cells with extra centrosomes before plating in 3-D cultures. Dox treatment was performed for 48hrs prior to 3-D cultures in all experiments.
Extended Data Figure 4. Similarity between cells with centrosome amplification and cells with oncogene-induced invasion.
Cells were stained for F-actin (red), laminin-V (green) and DNA (blue). Similarity between the invasive protrusions of cells with extra centrosomes and the ones generated by cells overexpressing ErbB2, as previously reported4,42. In both conditions, invasive protrusions are characterized by the formation of actin-rich protrusions that are accompanied by degradation of the basement membrane. Scale bar: 10µm.
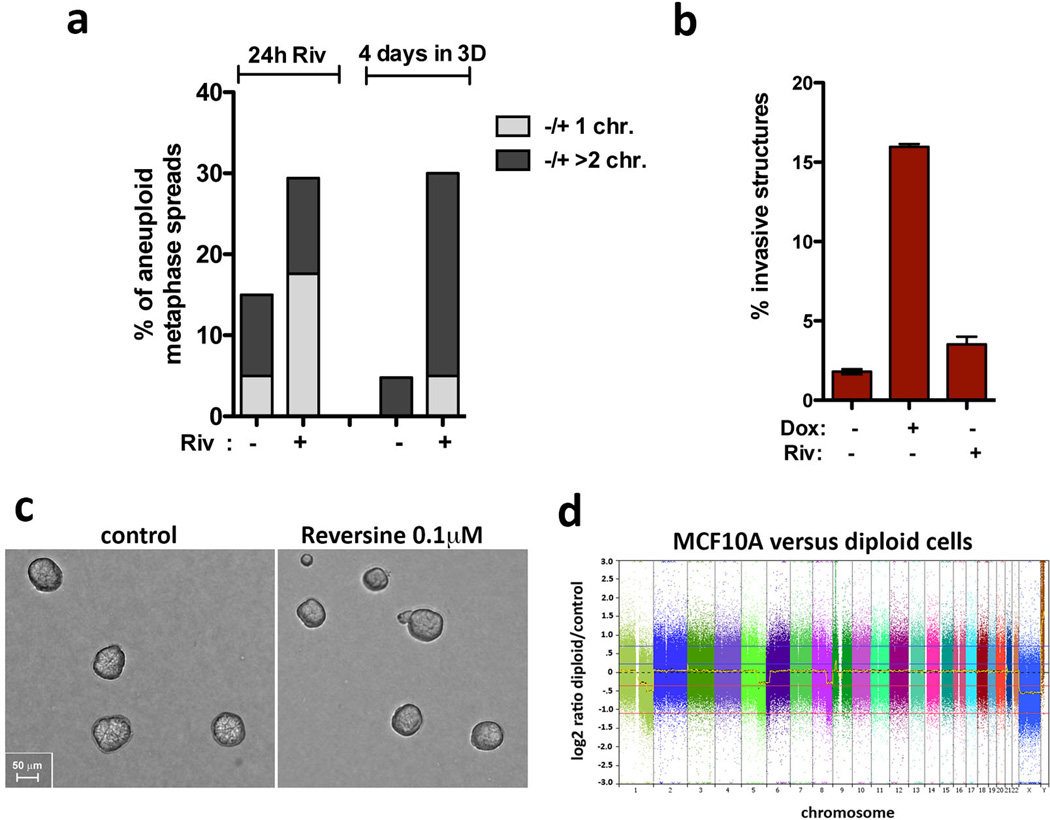
Extended Data Figure 5. Riversine treatment induces aneuploidy but not invasive acini in MCF10A cells.
a, Quantification of the chromosome number in cells after treatment with with 0.1 µM of Reversine (Riv) for 24hrs before and after 4 days in 3-D cultures (~20 chromosome spreads were quantified in each condition). The concentration of Reversine used does not induce cytokinesis failure and therefore would not induce centrosome amplification by inducing tetraploidy. b, Fraction of invasive acini after MCF10A cells are treated with Riversine. Increased aneuploidy from Riversine treatment does not induce invasion. Error bars represent mean ± SE from 3 independent experiments. c, Images of 3-D cultures after treatment with Riversine showing normal appearing acini. Scale bar: 50µm. d, SNP analysis of MCF10A cells (without centrosome amplification) compared with Human Reference Genomic DNA 103 from Affymetrix. Previously reported genomic alterations in MCF10A cells can be detected in our analysis, namely: +5q, +6p and +8q.
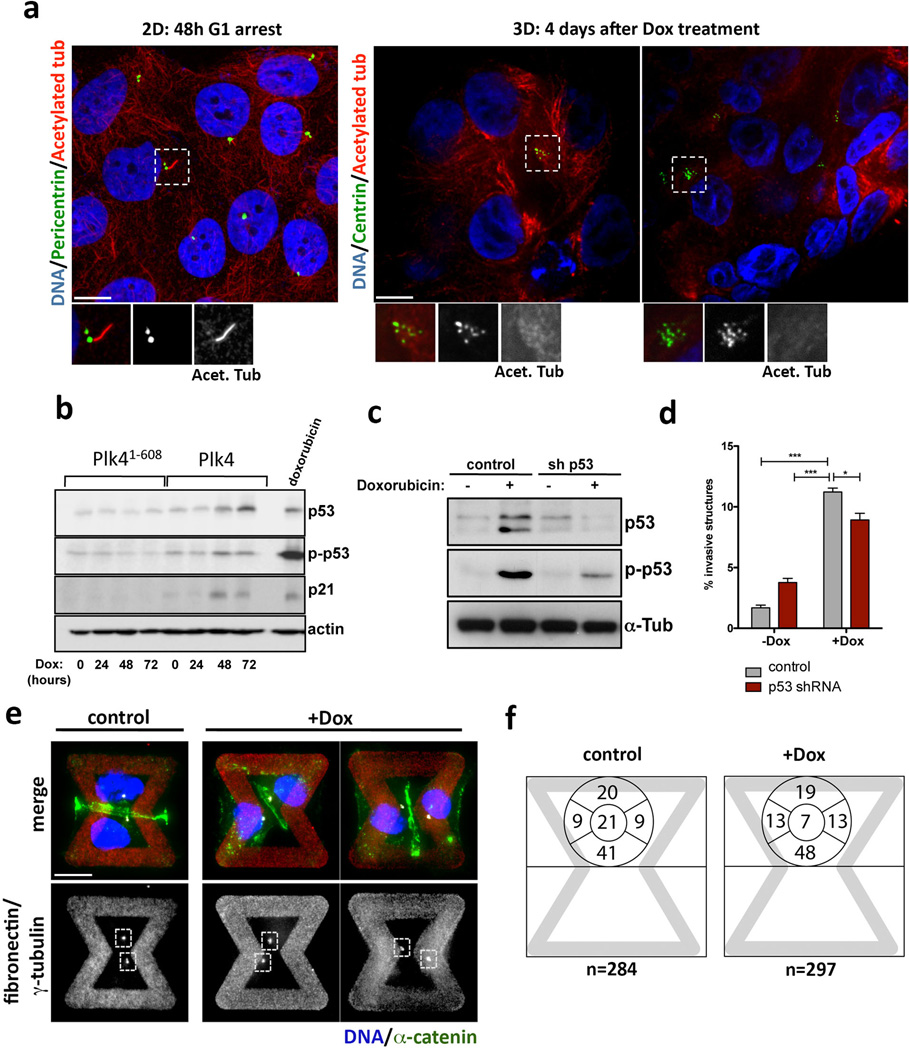
Extended Data Figure 6. Invasive protrusions from 3-D cultures of MCF10A cells with extra centrosomes are not an indirect consequence of altered cilia signaling, increased p53 expression or defects in centrosome polarization.
a, Left: Cells in 2-D were stained for pericentrin (green, inset), acetylated tubulin (red, inset) and DNA (blue). Cells were arrested for 48hrs in G1 to induce primary cilium formation. Note that even in this case most of the cells do not form cilia. This is expected because MCF10A cells have limited proficiency for cilia formation, with only ~7% of the cells assembling cilia even after 7 days of serum starvation43. Right: Cells in 3-D were stained for centrin (GFP, green inset), acetylated tubulin (red, inset) and DNA (blue). Cells do not form cilia after 4 days in 3-D cultures. This is expected because, unlike MDCK cells, MCF10A cells do not have a discernable apical polarity and lumen after 4 days in 3-D cultures and thus unlikely to form primary cilium at this time. b, As expected17, centrosome amplification in MCF10A cells induces modest p53 activation. Note that this degree of p53 activation has a minor impact on the proliferation of MCF10A cells (Fig. S1D). Expression of Plk4 and Plk41–608 was induced by Dox for the indicated times: 0, 24, 48 and 72hrs. c, Western blotting showing the levels of induction of p53 after doxorubicin treatment (200 ng/ml for 4hrs) in control and p53-depleted cells, demonstrating that the p53 shRNA efficiently prevents p53 activation. d, Fraction of acini with invasive protrusions from cells with (+Dox) or without (−Dox) centrosome amplification after depletion of p53. The ability of cells to form invasive acini is not significantly impacted by their p53 status. Error bars represent mean ± SE from 3 independent experiments. p-value derived from unpaired two-tailed t-test (***, p<0.0005; *, p<0.05). e, Cells were stained for α-catenin (green), γ-tubulin (red), DNA (blue) the fibronectin micro-pattern visualized in red. Dashed boxes outline the centrosomes. Note that after Plk4 OE, extra centrosomes (clustered in interphase) are correctly positioned towards the cell-cell junction (similar to the control) even when the junction is defective, suggesting that centrosome amplification is not impairing the polarity axis of these cells. f, Centrosome positioning is not altered in cells with (+Dox) and without (control) extra centrosomes. Left: representative images of cells showing centrosomes (γ-tubulin) in relation to adherens junctions (α-catenin). Right: Scheme with quantification of the fraction of centrosomes at the indicated positions on the micropatterns. (see Fig. 3A). Note that the position of centrosomes in cells with centrosome amplification does not differ from that in control cells. Cells were plated on the patterns 48hrs after induction of centrosome amplification with Plk4.
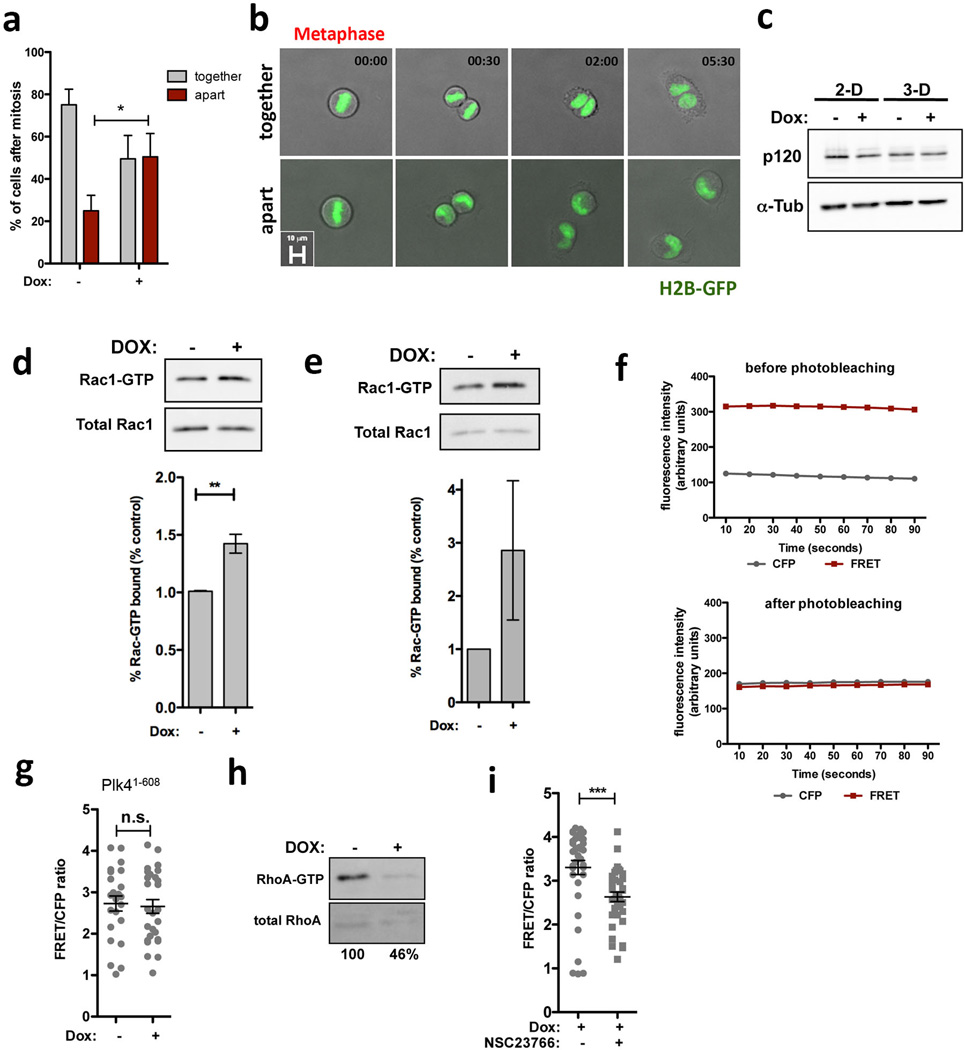
Extended Data Figure 7. Centrosome amplification induces cell scattering and Rac activation.
a, Quantification of number of cells with (+Dox) or without (−Dox) extra centrosomes that remain as pairs within 10hrs time after mitosis (n−Dox=180; n+Dox=98). Cell scattering occurred in most of the cases within the first 2hrs after mitosis. Cells were imaged on 2-D substratum. Similar results were obtained with fixed cells. Error bars represent mean ± SE from 3 independent experiments. b, Still images from videos showing examples of cells that stay together (−Dox) or move apart (+Dox). Time scale - hrs:minutes. c, Western blot showing levels of p120 catenin in cells with (+Dox) and without (−Dox) extra centrosomes in 2-D and 3D cultures. d, Top: Western blot from a pull-down experiment to detect GTP-bound Rac1 in HaCaTs cells. Bottom: quantification of active Rac1 from pull-down experiments. Error bars represent mean ± SE from 3 independent experiments. e, Top: Western blot from a pull-down experiment to detect GTP-bound Rac1 in 16HBE cells. Bottom: quantification of active Rac1 from pull-down experiments. Error bars represent mean ± SE from 2 independent experiments. f, FRET control demonstrating increased CFP emission after photobleaching of the YFP fluorophore at an excitation wavelength of 510 nm for 10 min in MFC-10A cells expressing Raichu-Rac. g, Levels of active Rac1 measured by FRET in cells overexpression Plk41–608. n−Dox=25; n+Dox=22. Error bars represent mean ± SE. h, Western blot from a pull-down experiment to detect GTP-bound RhoA in MCF10A cells showing decrease RhoA activity in cells with extra centrosomes. i, Levels of active Rac1 measured by FRET in cells with extra centrosomes treated with the Rac1 inhibitor NSC23766, demonstrating that NSC23766 inhibits Rac1 activation in cells with extra centrosomes. n−NSC23766=37; n+NSC23766=36. Error bars represent mean ± SE. All the p-values were derived from unpaired two-tailed t-test (***, p<0.0005; **, p<0.005; *, p<0.05). Scale bar: 10µm.
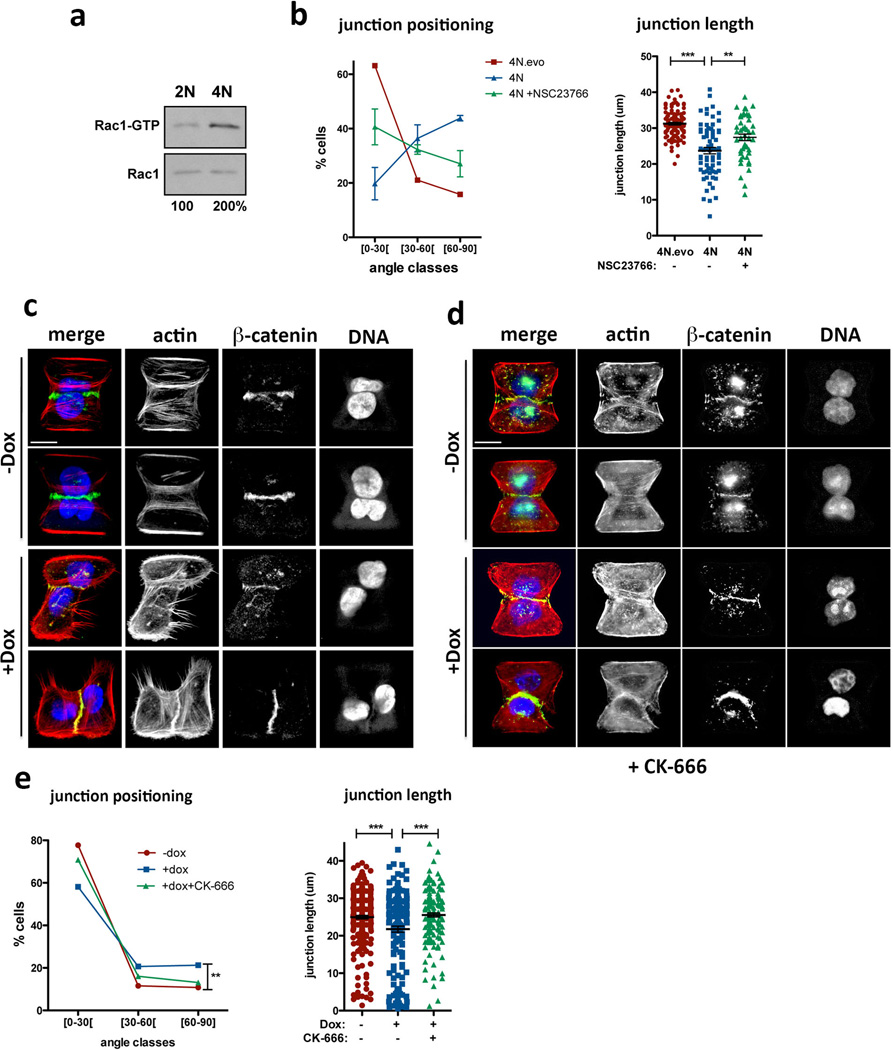
Extended Data Figure 8. Cell-cell adhesion defects caused by centrosome amplification can be observed in tetraploid cells and can be suppressed by Arp2/3 complex inhibition.
a, Western blot from a pull-down experiment to detect GTP-bound Rac1 in tetraploid MCF10A cells. b, Distribution of the cell-cell junction angles (left) and size (right) in the indicated tetraploid cells, with or without treatment with the Rac1 inhibitor, NSC23766. Note that tetraploid cells with extra centrosomes (4N) have a dramatic defect in junction positioning by comparison with tetraploid cells with normal centrosome number (4N.evo). This severe phenotype is only partially rescued by Rac1 inhibition. n4N.evo=106; n4N=70; nNCS23766=47. Error bars represent mean ± SE. c, Examples of cell doublets with (+Dox) or without (−Dox) centrosome amplification on the fibronectin micro-patterns. Cells were stained for F-actin (red), β-catenin (green), DNA (blue). d, Examples of cell doublets with (+Dox) or without (−Dox) centrosome amplification on the fibronectin micro-patterns treated with the Arp2/3 inhibitor (CK-666). Cells were stained for F-actin (red), β-catenin (green), DNA (blue). e, Distribution of the junction angle and quantification of the junction size in cells with extra centrosomes treated with 50 µM of Arp2/3 inhibitor (CK-666) for 6hrs. Cells were analyzed 48hrs after Dox treatment. n−Dox=251; n+Dox=160; nCK666=168. Error bars represent mean ± SE. All the p-values were derived from unpaired two-tailed t-test (***, p<0.0005; **, p=0.005). Scale bar: 10µm.
Extended Data Figure 9.
a, Images of centrosomes from interphase MCF10A cells stained for γ-tubulin. Boxes represent the region for measurement of centrosomal γ-tubulin signal (inside) and background (area between inside-outside boxes). b, Method used to determine the integrated fluorescent intensity of centrosomal γ-tubulin, as previously described40. c, Measurement of γ-tubulin intensity at the centrosomes showing that in interphase, increased centriole number is sufficient to increase γ-tubulin levels at the centrosomes whereas increased ploidy per se does not (4Nevo). nPlk4−Dox=60; nPlk4+Dox=49; n4N.evo.Plk4−Dox=34 n4N.evo.Plk4+Dox=35. Error bars represent mean ± SE. d, Increased Rac1 activity in cells with extra centrosomes can be detected in arrested cells deprived of EGF. Left: Quantification of Rac1 activity by FRET in single cells with (+Dox) and without (−Dox) extra centrosomes in the absence of EGF. Right: FRET images of cells in the absence of EGF. nPlk4−Dox=36; nPlk4+Dox=47. Error bars represent mean ± SE. Scale bar: 10µm. c, FACS profiles of control (−Dox) and cells with extra centrosomes (+dox) after 48hrs of Dox treatment showing that there is not major difference in the cell cycle profiles of these cells. Note that at this time point centrosome amplification does not produce a striking defect in cell proliferation (Extended Data Figure 1d). All the p-values were derived from unpaired two-tailed t-test (**, p<0.005; ***, p<0.0005).
Extended Data Figure 10. Depletion of Cep192 suppresses the invasive properties of cells with centrosome amplification.
a, Scheme of the experimental design to induce centrosome amplification in cells depleted of Cep192 by siRNA. Transient overexpression of Plk4 is induced 6hrs after siRNA to allow efficient centrosome overduplication. As expected, after depletion of Cep192 for 48hrs, cells are partially compromised in their ability to overduplicate centrosomes after Plk4 OE44. b, Western blot showing efficient depletion of Cep192 after 48hrs treatment of cells with Cep192 siRNA. c, Western blot showing partial depletion of Cep192 by shRNA. d, Quantification of centrosomal γ-tubulin after depletion of CEP192 by siRNA for 48hrs. Similar results were observed with Cep192 esiRNA (not shown). Of note, at least for a three-day period, cells remain viable after Cep192 knockdown. nctr.siRNA=22; nCEP.siRNA=20. Error bars represent mean ± SE. Quantification of centrosome amplification after depletion of Cep192 by siRNA (e) or shRNA (f). Error bars represent mean ± SE from 3 independent experiments. g, Bright field images of acini after 4 days in 3-D culture, demonstrating that partial Cep192 depletion by shRNA does not significantly impair cell growth or the formation of acini. Red arrows indicate the invasive acini. h, Right: Quantification of Plk4-mediated centrosome amplification in cells depleted of Cep192 after 4 days in 3-D cultures showing that these cells still carry extra centrosomes. Error bars represent mean ± SE from 3 independent experiments. Left: Normal acini displaying centrosome amplification after partial knockdown of CEP192. Cells were stained for F-actin (red), centrioles (centrin1-GFP, green) and DNA (blue). Scale bar: 10µm. i, Levels of active Rac1 measured by FRET after CEP192 depletion. nctr.siRNA−Doc=51; nctr.siRNA+Doc=35 nCEP.siRNA−Dox=53; nCEP.siRNA+Dox=37. Error bars represent mean ± SE. All the p-values were derived from unpaired two-tailed t-test (*, p<0.05; **, p<0.005).
Supplementary Material
Acknowledgements
We are grateful to S. Jhaveri-Schneider, S. Muthuswamy, M. Bettencourt-Dias, R. Basto, D. Calado, N. Ganem, A. Spektor, M. Kwon and B. Atkins for comments/discussion of the manuscript; the Nikon Imaging Center at Harvard Medical School; J. Waters, J. Rosenberg and Hunter Elliott for their help with FRET microscopy and analysis, Lisa Cameron of the Confocal and Light Microcopy Facility at Dana-Farber Cancer Institute; Hubo Li of SNP analysis, Amy Bui for help establishing the 3-D cultures, Q. Tseng for establishing MCF10A doublets on micropatterns and C. Sproat and J. Marshall for help with the organotypic cultures. Reagents were kindly provided by L. Pelletier, J. Locarek, M. Matsuda, A. Hall and J. Marshall. SAG is supported by an FCT grant HMSPCT/SAU-ICT/0075/2009. MT is supported by the ERC grant 310472 and the ISI program of BPSFrance. DP is an HHMI investigator and is supported by an NIH grant GM083299-1.
Footnotes
Author contributions
S.A.G and D.P. designed the experiments and wrote the manuscript. S.A.G conceived, conducted and performed data analysis for most experiments. R.P. conceived and conducted all FRET experiments and Fig. 3a. M.T and M.B. contributed with micropattern fabrication, Fig. 3d, Extended Data Fig. 6e–d and Extended Data Fig. 8c–e. R.D. contributed with Fig. 2b and Extended Data Fig. 5a. Y.S., K.P., C.L. and J.B. provided assistance with 3-dimentional cultures. All authors contributed with discussions and edited the manuscript.
References
- 1.Zyss D, Gergely F. Centrosome function in cancer: guilty or innocent? Trends Cell Biol. 2009;19:334–346. doi: 10.1016/j.tcb.2009.04.001. [DOI] [PubMed] [Google Scholar]
- 2.Ganem NJ, Godinho SA, Pellman D. A mechanism linking extra centrosomes to chromosomal instability. Nature. 2009;460:278–282. doi: 10.1038/nature08136. [DOI] [PMC free article] [PubMed] [Google Scholar]
- 3.Chan JY. A clinical overview of centrosome amplification in human cancers. Int J Biol Sci. 2011;7:1122–1144. doi: 10.7150/ijbs.7.1122. [DOI] [PMC free article] [PubMed] [Google Scholar]
- 4.Levental KR, et al. Matrix crosslinking forces tumor progression by enhancing integrin signaling. Cell. 2009;139:891–906. doi: 10.1016/j.cell.2009.10.027. [DOI] [PMC free article] [PubMed] [Google Scholar]
- 5.Bettencourt-Dias M, Glover DM. Centrosome biogenesis and function: centrosomics brings new understanding. Nat Rev Mol Cell Biol. 2007;8:451–463. doi: 10.1038/nrm2180. [DOI] [PubMed] [Google Scholar]
- 6.Sluder G, Nordberg JJ. The good, the bad and the ugly: the practical consequences of centrosome amplification. Curr Opin Cell Biol. 2004;16:49–54. doi: 10.1016/j.ceb.2003.11.006. [DOI] [PubMed] [Google Scholar]
- 7.Debnath J, Brugge JS. Modelling glandular epithelial cancers in three-dimensional cultures. Nat Rev Cancer. 2005;5:675–688. doi: 10.1038/nrc1695. [DOI] [PubMed] [Google Scholar]
- 8.Bettencourt-Dias M, et al. SAK/PLK4 is required for centriole duplication and flagella development. Curr Biol. 2005;15:2199–2207. doi: 10.1016/j.cub.2005.11.042. [DOI] [PubMed] [Google Scholar]
- 9.Habedanck R, Stierhof YD, Wilkinson CJ, Nigg EA. The Polo kinase Plk4 functions in centriole duplication. Nat Cell Biol. 2005;7:1140–1146. doi: 10.1038/ncb1320. [DOI] [PubMed] [Google Scholar]
- 10.Guderian G, Westendorf J, Uldschmid A, Nigg EA. Plk4 trans-autophosphorylation regulates centriole number by controlling betaTrCP-mediated degradation. J Cell Sci. 2010;123:2163–2169. doi: 10.1242/jcs.068502. [DOI] [PubMed] [Google Scholar]
- 11.Friedl P, Locker J, Sahai E, Segall JE. Classifying collective cancer cell invasion. Nat Cell Biol. 2012;14:777–783. doi: 10.1038/ncb2548. [DOI] [PubMed] [Google Scholar]
- 12.Gamallo C, et al. Correlation of E-cadherin expression with differentiation grade and histological type in breast carcinoma. Am J Pathol. 1993;142:987–993. [PMC free article] [PubMed] [Google Scholar]
- 13.Silkworth WT, Nardi IK, Scholl LM, Cimini D. Multipolar spindle pole coalescence is a major source of kinetochore mis-attachment and chromosome mis-segregation in cancer cells. PLoS One. 2009;4:e6564. doi: 10.1371/journal.pone.0006564. [DOI] [PMC free article] [PubMed] [Google Scholar]
- 14.Maney T, Hunter AW, Wagenbach M, Wordeman L. Mitotic centromere-associated kinesin is important for anaphase chromosome segregation. J Cell Biol. 1998;142:787–801. doi: 10.1083/jcb.142.3.787. [DOI] [PMC free article] [PubMed] [Google Scholar]
- 15.Santaguida S, Tighe A, D'Alise AM, Taylor SS, Musacchio A. Dissecting the role of MPS1 in chromosome biorientation and the spindle checkpoint through the small molecule inhibitor reversine. J Cell Biol. 2010;190:73–87. doi: 10.1083/jcb.201001036. [DOI] [PMC free article] [PubMed] [Google Scholar]
- 16.Mahjoub MR, Stearns T. Supernumerary centrosomes nucleate extra cilia and compromise primary cilium signaling. Curr Biol. 2012;22:1628–1634. doi: 10.1016/j.cub.2012.06.057. [DOI] [PMC free article] [PubMed] [Google Scholar]
- 17.Holland AJ, et al. The autoregulated instability of Polo-like kinase 4 limits centrosome duplication to once per cell cycle. Genes Dev. 2012;26:2684–2689. doi: 10.1101/gad.207027.112. [DOI] [PMC free article] [PubMed] [Google Scholar]
- 18.Basto R, et al. Centrosome amplification can initiate tumorigenesis in flies. Cell. 2008;133:1032–1042. doi: 10.1016/j.cell.2008.05.039. [DOI] [PMC free article] [PubMed] [Google Scholar]
- 19.Fogg VC, Liu CJ, Margolis B. Multiple regions of Crumbs3 are required for tight junction formation in MCF10A cells. J Cell Sci. 2005;118:2859–2869. doi: 10.1242/jcs.02412. [DOI] [PubMed] [Google Scholar]
- 20.Tseng Q, et al. Spatial organization of the extracellular matrix regulates cell-cell junction positioning. Proc Natl Acad Sci U S A. 2012;109:1506–1511. doi: 10.1073/pnas.1106377109. [DOI] [PMC free article] [PubMed] [Google Scholar]
- 21.Chen X, Macara IG. Par-3 controls tight junction assembly through the Rac exchange factor Tiam1. Nat Cell Biol. 2005;7:262–269. doi: 10.1038/ncb1226. [DOI] [PubMed] [Google Scholar]
- 22.Xue B, Krishnamurthy K, Allred DC, Muthuswamy SK. Loss of Par3 promotes breast cancer metastasis by compromising cell-cell cohesion. Nat Cell Biol. 2013;15:189–200. doi: 10.1038/ncb2663. [DOI] [PMC free article] [PubMed] [Google Scholar]
- 23.Jaffe AB, Hall A. Rho GTPases: biochemistry and biology. Annu Rev Cell Dev Biol. 2005;21:247–269. doi: 10.1146/annurev.cellbio.21.020604.150721. [DOI] [PubMed] [Google Scholar]
- 24.Mack NA, Whalley HJ, Castillo-Lluva S, Malliri A. The diverse roles of Rac signaling in tumorigenesis. Cell Cycle. 2011;10:1571–1581. doi: 10.4161/cc.10.10.15612. [DOI] [PMC free article] [PubMed] [Google Scholar]
- 25.Itoh RE, et al. Activation of rac and cdc42 video imaged by fluorescent resonance energy transfer-based single-molecule probes in the membrane of living cells. Mol Cell Biol. 2002;22:6582–6591. doi: 10.1128/MCB.22.18.6582-6591.2002. [DOI] [PMC free article] [PubMed] [Google Scholar]
- 26.Waterman-Storer CM, Worthylake RA, Liu BP, Burridge K, Salmon ED. Microtubule growth activates Rac1 to promote lamellipodial protrusion in fibroblasts. Nat Cell Biol. 1999;1:45–50. doi: 10.1038/9018. [DOI] [PubMed] [Google Scholar]
- 27.Lingle WL, et al. Centrosome amplification drives chromosomal instability in breast tumor development. Proc Natl Acad Sci U S A. 2002;99:1978–1983. doi: 10.1073/pnas.032479999. [DOI] [PMC free article] [PubMed] [Google Scholar]
- 28.Zhu F, et al. The mammalian SPD-2 ortholog Cep192 regulates centrosome biogenesis. Curr Biol. 2008;18:136–141. doi: 10.1016/j.cub.2007.12.055. [DOI] [PubMed] [Google Scholar]
- 29.Stehbens S, Wittmann T. Targeting and transport: how microtubules control focal adhesion dynamics. J Cell Biol. 2012;198:481–489. doi: 10.1083/jcb.201206050. [DOI] [PMC free article] [PubMed] [Google Scholar]
- 30.Padua D, Massague J. Roles of TGFbeta in metastasis. Cell Res. 2009;19:89–102. doi: 10.1038/cr.2008.316. [DOI] [PubMed] [Google Scholar]
Supplementary References
- 31.Debnath J, et al. The role of apoptosis in creating and maintaining luminal space within normal and oncogene-expressing mammary acini. Cell. 2002;111:29–40. doi: 10.1016/s0092-8674(02)01001-2. [DOI] [PubMed] [Google Scholar]
- 32.Schafer ZT, et al. Antioxidant and oncogene rescue of metabolic defects caused by loss of matrix attachment. Nature. 2009;461:109–113. doi: 10.1038/nature08268. [DOI] [PMC free article] [PubMed] [Google Scholar]
- 33.Gunawardane RN, et al. Novel role for PDEF in epithelial cell migration and invasion. Cancer Res. 2005;65:11572–11580. doi: 10.1158/0008-5472.CAN-05-1196. [DOI] [PMC free article] [PubMed] [Google Scholar]
- 34.Xiang B, Muthuswamy SK. Using three-dimensional acinar structures for molecular and cell biological assays. Methods Enzymol. 2006;406:692–701. doi: 10.1016/S0076-6879(06)06054-X. [DOI] [PubMed] [Google Scholar]
- 35.Paszek MJ, Weaver VM. The tension mounts: mechanics meets morphogenesis and malignancy. J Mammary Gland Biol Neoplasia. 2004;9:325–342. doi: 10.1007/s10911-004-1404-x. [DOI] [PubMed] [Google Scholar]
- 36.Gaggioli C, et al. Fibroblast-led collective invasion of carcinoma cells with differing roles for RhoGTPases in leading and following cells. Nat Cell Biol. 2007;9 doi: 10.1038/ncb1658. [DOI] [PubMed] [Google Scholar]
- 37.Nystrom ML, et al. Development of a quantitative method to analyse tumour cell invasion in organotypic culture. J Pathol. 2005;205:468–475. doi: 10.1002/path.1716. [DOI] [PubMed] [Google Scholar]
- 38.Campeau E, et al. A versatile viral system for expression and depletion of proteins in mammalian cells. PLoS One. 2009;4:e6529. doi: 10.1371/journal.pone.0006529. [DOI] [PMC free article] [PubMed] [Google Scholar]
- 39.Godar S, et al. Growth-inhibitory and tumor-suppressive functions of p53 depend on its repression of CD44 expression. Cell. 2008;134:62–73. doi: 10.1016/j.cell.2008.06.006. [DOI] [PMC free article] [PubMed] [Google Scholar]
- 40.Hoffman DB, Pearson CG, Yen TJ, Howell BJ, Salmon ED. Microtubule-dependent changes in assembly of microtubule motor proteins and mitotic spindle checkpoint proteins at PtK1 kinetochores. Mol Biol Cell. 2001;12:1995–2009. doi: 10.1091/mbc.12.7.1995. [DOI] [PMC free article] [PubMed] [Google Scholar]
- 41.Azioune A, Carpi N, Tseng Q, Thery M, Piel M. Protein micropatterns: A direct printing protocol using deep UVs. Methods Cell Biol. 2010;97:133–146. doi: 10.1016/S0091-679X(10)97008-8. [DOI] [PubMed] [Google Scholar]
- 42.Zhan L, Xiang B, Muthuswamy SK. Controlled activation of ErbB1/ErbB2 heterodimers promote invasion of three-dimensional organized epithelia in an ErbB1-dependent manner: implications for progression of ErbB2-overexpressing tumors. Cancer Res. 2006;66:5201–5208. doi: 10.1158/0008-5472.CAN-05-4081. [DOI] [PubMed] [Google Scholar]
- 43.Yuan K, et al. Primary cilia are decreased in breast cancer: analysis of a collection of human breast cancer cell lines and tissues. J Histochem Cytochem. 2010;58:857–870. doi: 10.1369/jhc.2010.955856. [DOI] [PMC free article] [PubMed] [Google Scholar]
- 44.Sonnen KF, Gabryjonczyk AM, Anselm E, Stierhof YD, Nigg EA. Human Cep192 and Cep152 cooperate in Plk4 recruitment and centriole duplication. J Cell Sci. 2013 doi: 10.1242/jcs.129502. [DOI] [PubMed] [Google Scholar]
- 45.Edgar R, Domrachev M, Lash AE. Gene expression and hybridization array data repository. Nucleic Acids Res. 2002;30:207–210. doi: 10.1093/nar/30.1.207. [DOI] [PMC free article] [PubMed] [Google Scholar]
Associated Data
This section collects any data citations, data availability statements, or supplementary materials included in this article.


