Abstract
The electron density resolution is 1000 times higher for synchrotron-radiation phase-contrast CT imaging than conventional X-ray absorption imaging in light elements, with which high-resolution X-ray imaging of biological soft tissue can be achieved. In the present study, we used phase-contrast X-ray CT to investigate human resected esophagus and esophageal carcinoma specimens. This technology revealed the three-layer structure of the esophageal wall-- mucous, submucosa and muscular layers. The mucous and muscular layers were clearly separated by a loose submucosa layer with a honeycomb appearance. The surface of the mucous layer was smooth. In esophageal carcinoma, because of tumor tissue infiltration, the submucosa layer was absent, which indicated destruction of the submucosa. The boundary between normal tissue and tumor was comparatively fuzzy, the three-layer structure of the esophageal wall was indistinct. The surface of the mucous layer was rugose. The technology might be helpful in tumor staging of esophageal carcinoma.
Esophageal carcinoma is a malignant tumor with high prevalence and mortality worldwide. According to the 2012 annual report of the Chinese Cancer Registry, the 2009 crude incidence rate in registration areas was 22.14 per 100,000 people. The rates were 10.88 per 100,000 people after standardization by the age structures of China. The mortality of esophageal cancer was 16.77 per 100,000 people. The disease ranks 7th and 6th in terms of cancer incidence and mortality rate, respectively, worldwide1. Moreover, nearly 50% of esophageal carcinoma cases in the world occur in China2.
Esophageal squamous cell carcinoma (ESCC), the most common histological subtype, accounts for 90% of all esophageal carcinomas diagnosed in China each year3. In some high-risk regions such as Shantou, the disease incidence ranges from 60 to 150 per 100,000 people and the mortality is as high as 90 to 134 per 100,000 people4,5. Treatment of esophageal carcinoma is not effective, because most patients are diagnosed at a late stage. If early diagnosis and treatment were possible, the 5-year survival rate could be increased to greater than 90%6,7,8.
Therefore, early detection and diagnosis remain crucial to improve the prognosis of esophageal carcinoma. Conventional gas-barium double -contrast X-ray imaging is one of the basic modalities to evaluate esophageal carcinoma. The contrast is increased by oral administration of a double-contrast agent (gas and barium sulfate). Because of the high contrast between the barium sulfate-coating on the esophageal mucosa surface and gas in the esophageal lumen, the shape of the esophageal mucosa is depicted indirectly as highly dense filiform areas. The technique can also be used to visualize stenotic esophageal lumen and mucosal destruction caused by esophageal carcinoma. Esophageal carcinoma can also be diagnosed by fluoroscopic viewing, and esophageal peristalsis can be dynamically observed. The esophageal wall is stiff in esophageal carcinoma. However, conventional X-ray double-contrast imaging involves absorption imaging, which distinguishes different tissues according to the linear attenuation coefficient (μ). The μ values are proportional to tissue density. With 1- to 2-mm spatial resolution with conventional imaging, the lowest density difference that can be detected is only 0.01 g cm−3. Hence, although high contrast can be achieved for tissues with different proportions of light and heavy elements, distinguishing the subtle structure differences in soft tissues that contain only light elements is difficult. The low-density contrast of X-ray absorption imaging is the main obstacle in clinical practice9.
CT and MRI are widely used in staging tumors of the digestive tract. Evaluation of tumor invasion by CT and MRI is based on two criteria: tumor size and loss of the fat layer. When the tumor size is sufficiently large, the adjacent tissues, including trachea or bronchus, arteries and heart, are compressed and displaced. The loss of the fat layer between tumor and adjacent tissues is commonly used to predict adjacent tissue invasion.
Several authors have described the value of MRI and CT in the staging of esophageal carcinoma. The accuracy of CT or MRI in staging the local tumor infiltration ranges from 45% to 73%10,11,12,13,14,15. However, both techniques have the same limitations in evaluating esophageal carcinoma16,17: an inability to discriminate the esophageal wall layer and detect the tumor breaking through the serosa layer into adjacent tissues. In addition, MRI has limited spatial resolution and long acquisition time18,19.
Compared to the traditional absorption based X-ray imaging, hard X-ray SR PCI takes the advantage of partial coherence of SR to image the soft tissues in phase contrast. It uses phase-contrast information, developed by the redistribution of light intensity when penetrating tissues, and depends on the refractive effect of X-ray in sample. According to the refractive index formula, n = 1 − δ + iβ, where δ = reρeλ2/2π and β = μλ/4π; δ is correlated with the phase and β is correlated with the absorption coefficient μ. With C2H4, for example, the phase-correlated index δ of 25 keV X-rays (λ = 0.496 A °) is 3.5 × 10⁻⁷, yet the absorption-correlated index β is 8.1 × 10⁻¹¹. δ is higher than β by about 3 orders of magnitude, and the phase contrast can reach 0.0003 g cm−3. So in theory, the contrast of light elements can reach 1000 times that of conventional absorption imaging20.
The principle of synchrotron-radiation X-ray phase-contrast imaging is based on Fresnel diffraction theory. The experiment setup, when using a synchrotron radiation light source, is simple, requiring only a double-crystal monochromator, a sample stage and a detector. Figure 1 shows the schematics of the experiment setup21.
Figure 1. The schematic of the SR-PCI setup.

From the advantages mentioned above, synchrotron-radiation phase-contrast imaging has broad prospects in domains such as biomedicine and material science. In vitro high-resolution SR-PCI can be used for imaging breast, lung, liver and kidney tissue, and achieves excellent soft-tissue contrast without the use of enhancement agents22. Yet the use of SR-PCI has not been reported for the esophagus and esophageal carcinoma.
We used the BL13W1 beamline at the Shanghai Synchrotron Radiation Facility (SSRF), to investigate the use of phase-contrast X-ray CT imaging for esophagus and esophageal carcinoma In vitro. In addition, we explored the ability of this imaging modality to demonstrate the fine structure in the esophageal wall layering and the border between the normal esophageal wall and esophageal carcinoma.
Results
Imaging of the esophageal wall
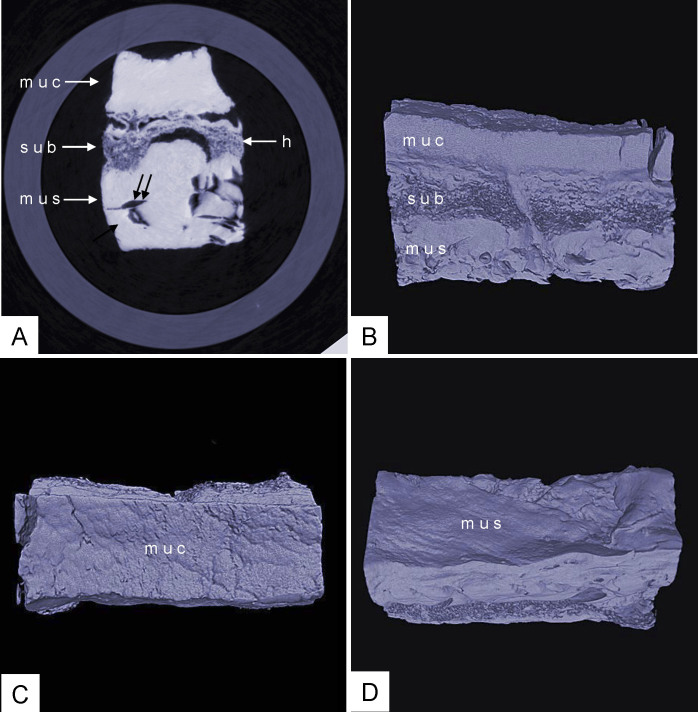
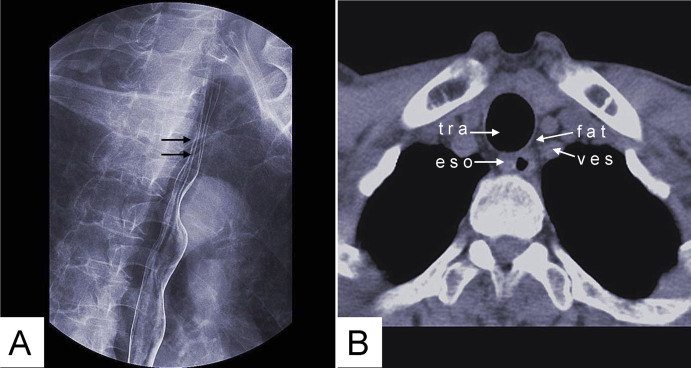
Phase-contrast X-ray CT imaging by synchrotron-radiation broadband monochromatic light clearly depicted normal esophageal wall, including the mucous, submucosa and muscular layers (Figure 2). The mucous and muscular layers were clearly separated by a loose submucosa layer, with a honeycomb appearance. The surface of the mucous layer was smooth. We found many strips of tubular low-density areas in the muscular layer, which were crevices that might be caused by fiber contraction during fixation or open-air drying. For comparison, we show a gas-barium double contrast X-ray image and CT image of normal tissue from the same patient (Figure 3). The gas-barium double contrast X-ray image showed the mucosa, displaying setuliform high-density shadows (caused by the barium sulfate coating on the esophageal mucosa surface), as well as gas filling the esophageal lumen. CT revealed the esophageal wall in relation to adjacent tissues. However, both techniques combined could not discriminate the layers of the esophageal wall.
Figure 2. Phase-contrast X-ray CT imaging of normal the esophageal wall: the submucosa, which is looser, shows a honeycomb appearance.
The surface of the mucous is smooth. ((A): slice image; (B), (C) and (D): 3D image). muc: mucous layer; sub: submucosa layer; mus: muscular layer; h: honeycomb appearance of submucosa layer; double arrow: crevice. (C): surface of the mucous; (D): surface of the muscular.
Figure 3. Gas-barium double contrast X-ray image (A) and CT axial view image (B) of normal esophageal tissue.
(A) Mucosa shows many setuliforms high-density shadow (double arrow). (B) CT demonstrates the esophageal wall and the relation with adjacent tissues. tra: trachea; fat: fat tissue; ves: blood vessel; eso: esophageal wall.
Imaging of esophageal carcinoma
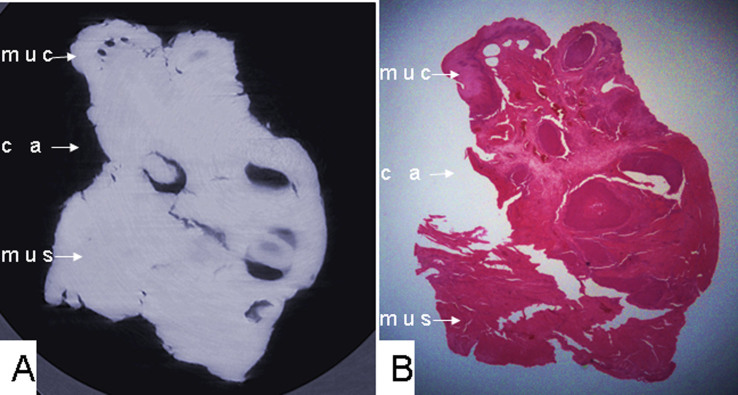
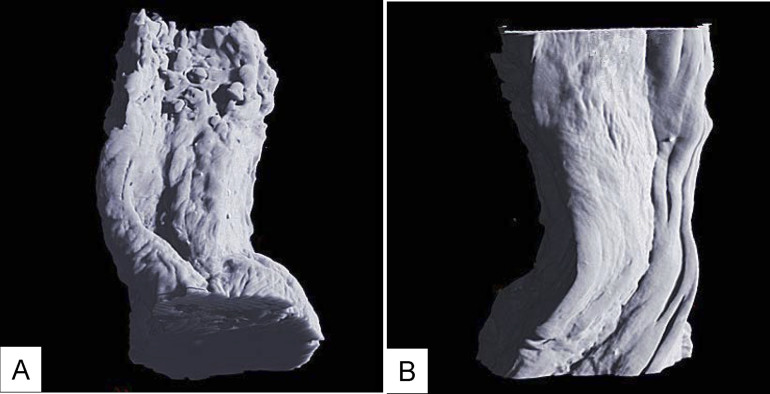
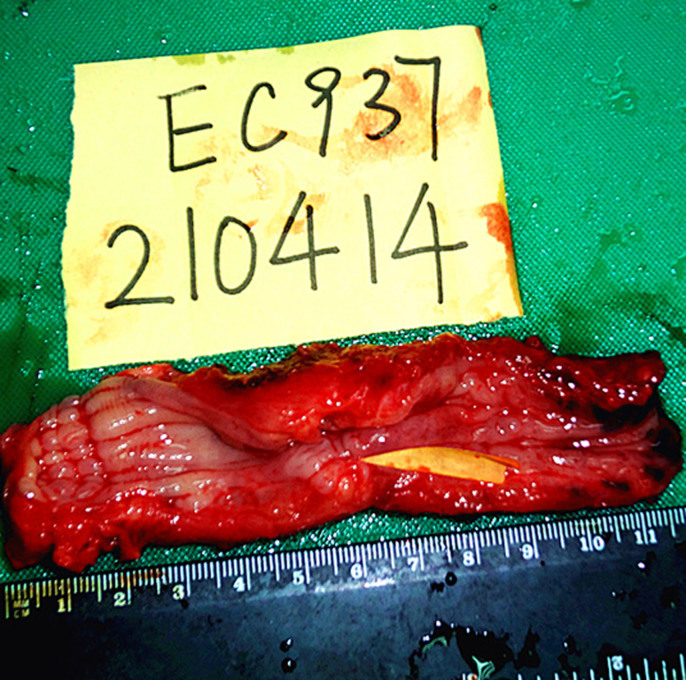
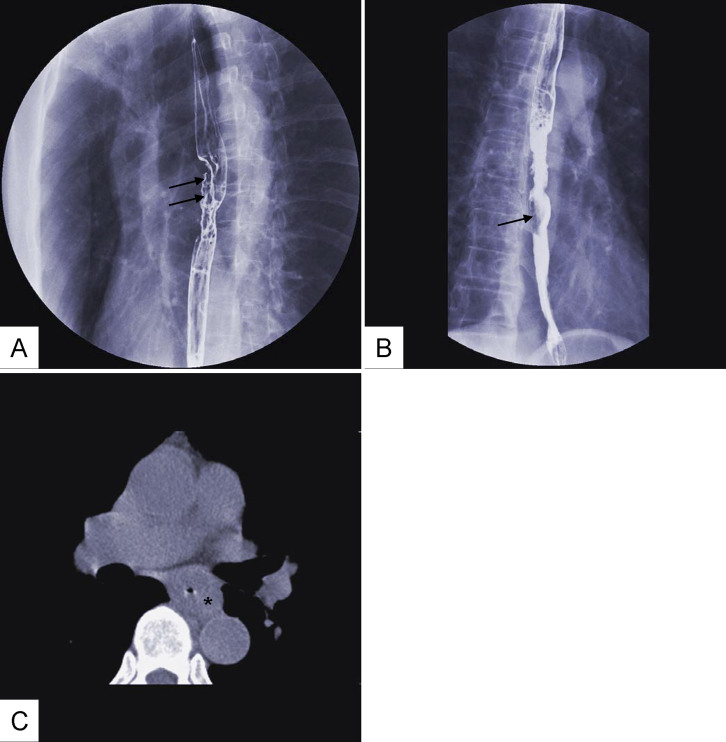
Phase-contrast X-ray CT revealed the esophageal carcinoma specimen as cancerous tissue infiltrating the entire esophageal wall. The subtotal submucosa layer was absent, and the boundary between tumor tissues and a normal esophageal wall was comparatively fuzzy (Figure 4). The esophageal wall became irregularly shaped, and the mucosa surface became rugose. In this esophageal carcinoma specimen, the muscular layer was not penetrated, so the surface of muscular layer remained smooth (Figure 5). Figure 6 shows a human resected esophagus and esophageal carcinoma specimens. The tissue shows many cancer nests, evidenced by round or oval low-density areas due to necrosis (Figure 7). Additional carcinoma tissue images are shown in Figure 8, showing mucosal destruction and intraluminal filling defects. CT revealed an incrassate esophageal wall. However, the 2 modalities could not discriminate tumor infiltration depth in the esophageal wall.
Figure 4. (A) Phase-contrast X-ray CT slice imaging of esophageal carcinoma and (B) histological staining of cancerous tissue infiltrating the esophageal wall, lack of a submucosa layer, and a fuzzy boundary between tumor tissues and the normal esophageal wall, with absent submucosa layer.
muc: mucous layer; ca: tumor; mus: muscular layer.
Figure 5.
(A) 3D image of esophageal carcinoma: the esophageal wall shape becames irregular shaped, and the surface of the mucosa is rugose. (B) The muscular layer is not penetrated by cancer, so the surface of the muscular layer remains smooth.
Figure 6. Resected human esophagus and esophageal carcinoma specimens.
Yellow arrow is tumor.
Figure 7.
(A) Phase-contrast X-ray CT imaging of esophageal carcinoma; cancer nests appear as round or oval low-density areas due to necrosis(arrows). (B) Histology of cancerous tissue.
Figure 8. Gas-barium double-contrast X-ray image (A, B) and CT image (C): mucosal destruction(double arrow in (A)) and intraluminal filling defect(single arrow in (B)).
Incrassate esophageal wall (* in (C)).
Discussion
Our phase-contrast X-ray CT imaging of esophagus and esophageal carcinoma specimens clearly revealed the three-layer structure of the esophageal wall, comprised of the mucous, submucosa and muscular layers. In particular, the submucosa layer was distinctly different from the mucous and muscular layers and had a honeycomb appearance. The mucous surface is smooth. For esophageal carcinoma, the technique showed cancerous tissues infiltrating the esophageal wall and total loss of the submucosa layer. The boundary between tumor tissues and normal esophageal wall was fuzzy, and the esophageal wall was disfigured and the surface of the mucosa rugose. These results imply a possibility for transferring this technique to early diagnosis of esophageal carcinoma.
According to the tumor staging by the Union for International Cancer Control20, primary esophageal carcinomas is classified into 6 stages, as shown in Table 1. When tumor invaded the submucosa (T1), the morphologic features of the submucosa change, and with muscularis propria or adventitia invasion (T2 or T3), the total submucosa is absent. Therefore, phase-contrast CT imaging can provide useful information for qualitative diagnosis of esophageal tumors, and the clarity of the image could allow for tumor staging.
Table 1. Tumor staging of primary esophageal tumors.
| T0 | No evidence of tumor |
| Tis | Carcinoma in situ |
| T1 | Tumor invades lamina propria or submucosa |
| T2 | Tumor invades muscularis propria |
| T3 | Tumor invades adventitia |
| T4 | Tumor invades adjacent structures |
Endoscopy is the only technique that can be used to directly observe the esophageal lumen in vivo; 3 to 4 setuliform longitudinal mucosal folds are clearly observed. However, the downside of endoscopy is the invasiveness and discomfort of patients during examination. In addition, the technique has limitations in discerning esophageal wall layering. With the improvements of phase-contrast CT performance, the possibility of using X-rays to analyze tiny structures of the esophageal wall would be possible with the high flux density of 3rd generation synchrotron radiation. The technology will provide useful information (tumor invading the esophageal wall) for the imaging of esophageal carcinomas. In our experiment, phase-contrast X-ray CT imaging also showed mucosa. However, our specimens were fixed and air-dried, so the shape differed from the original morphologic features. Histological examination is the gold standard of esophageal carcinoma diagnosis, but it is also the invasive and unrepeated.
Our study has several limitations19. First, our specimens were fixed and air-dried, which led to water content loss, so some tissues showed differences in vivo and some useful information might be lost. This imaging technique still cannot be used in vivo. We designed this in vitro study in order to show the potential for future in vivo use. Second, phase-contrast field of view is too narrow to adapt to large sample. Furthermore, we compared the capabilities of phase-contrast CT imaging and conventional X-ray imaging. However, each technique has its strengths. In summary, phase-contrast CT imaging can clearly depict the three-layer structure of the esophageal wall without the need for a contrast agent and can display the mucous plane without the need for barium sulfate. The technique can display the boundary and shape between normal tissue and tumor tissue, along with the disappearance of the submucosa layer, all providing useful information for the diagnosis of esophageal carcinoma. Although this technique is currently not applicable in clinical practice, the potential application proposes a new direction for imaging of esophageal carcinoma.
Methods
Specimen preparation and imaging
We sent one sample of inferior-segment esophageal tissue in which carcinoma tissue had infiltrated the entire esophageal wall to the Pathology Department at Shantou University Medical College for pathological examination. The esophageal tissue was washed with 0.9% sodium chloride repeatedly to remove the coated mucus and blood, then immersed in 10% formalin solution for 1 day. Two specimens, a normal esophageal wall (with mucous, submucosa, muscular and serosa layers) and esophageal carcinoma tissue (including the border of the esophageal carcinoma tissue and the surrounding normal esophageal wall) were extracted from the whole sample. The normal tissue, away from carcinoma tissue, was longitudinally cut into strips of 10 × 4 × 3 mm. The esophageal carcinoma sample was cut longitudinally to the same size as the normal sample. Then the 2 prepared specimens were immersed in 10% formalin for an additional 2 days. The specimens were fixed, air-dried at room temperature, then placed into plastic tubes for imaging. Participants who provided samples gave their written informed consents for use of the tissue. The methods were carried out in accordance with the approved guidelines. Our research has been approved by Ethical Committee of Shantou University Medical College.
Phase-contrast X-ray CT imaging
Synchrotron-radiation phase-contrast X-ray CT of esophageal specimens involved use of the beamline BL13W at the SSRF. The synchrotron radiation source for the BL13W is a hybrid-type wiggler with periodic length was 14 cm and a period number of 8. The fundamental radiation covered from 8.0 to 72.5 keV energy by tuning the gap from 17 to 35 mm. A fixed-exit double-crystal cryogenic-cooling monochromator was placed 28 m from the source point. The monochromator crystal was a combination of a Si(111) orientation crystal and a Si(311) orientation crystal. A high-precision sample stage, allowing for translation along all of the three-space directions with resolution > 1 micron, and rotation in all 3 axes was used for positioning the sample and rotating the sample axis perpendicular to the beam. The total acceptance angle was 1.5 mrad in the horizontal direction and 0.2 mrad in the vertical direction. In our experiment, the electron energy was adjusted to 15 keV.
The highly parallel and monochromatic beam was projected on the object being imaged. When X-ray beams traveled through the object, the downstream beams carry the absorption and phase shift information. After propagating a sufficient 9-cm distance, the phase shifts in the downstream beams are transformed into measurable intensity variations by Fresnel diffraction. An X-ray-sensitive CCD camera, with maximum 2048 × 2048 pixels of 3.7 × 3.7 μm, was used as a 2D detector to transform the beam into an image. During the CT data acquisition, the specimen was rotated around its cylinder axis for 180°. The number of projections was 900, with exposure time 1 s for each projection. Acquired images were reconstructed into 2D and 3D images and compared with histopathology findings. The specific steps of image acquisition and reconstruction are as follows:
Correcting sample rotating platform axis. We must strictly correct the relative position of the sample rotating platform axis and CCD detector plane, which made the former two parallel and reduced the CT reconstruction artifacts as far as possible.
Collecting IL-XPCT projection data. We collected white field images (detector-collecting image as having light in the light-beam station but no sample) and dark field image (detector-collecting image has no light in the light-beam station). Meanwhile, we collected tomography images.
Image processing and CT reconstruction. IL-XPCT projection data were reconstructed with the CT reconfigurable software compiled by the BL13W1 experimental station. 2D images were reconstructed with X-TRACT (A in Figure 2) and 3D images were reconstructed with Amira (B, C, D in Figure 2). The CT reconstruction process included correcting background noise, sample rotating the platform axis position and ring artifacts etc. for each projection data.
Histopathology
The imaged formalin-fixed samples were dehydrated and embedded in paraffin, then cut into 4 μm-thick sections. Samples were stained with hematoxylin and eosin and examined by light microscopy.
Author Contributions
D.P.T. analyzed the data, and wrote the paper; J.F.Z. and R.H.L. carried out the experiments, analyzed the data, and wrote the paper; G.Z.Z. and G.Y.P. carried out the experiments, and wrote the paper; M.S. designed the experiments, analyzed the data.
Acknowledgments
This study was sponsored by NSFC-Guangdong joint fund key project(Certificates U1132004), NSFC(Certificates 31171226), and Guangdong International Cooperative Technical Innovation Platform(Certificates gihz1106). We thank the Shanghai Synchrotron Radiation Facility, Institute of High Energy Physics, Chinese Academy of Sciences, for use of the BL13W1 facility.
References
- Parkin D. M., Bray F., Ferlay J. & Pisani P. Global cancer statistics, 2002. CA Cancer J Clin 55, 74–108 (2005). [DOI] [PubMed] [Google Scholar]
- Holmes R. S. & Vaughan T. L. Epidemiology and pathogenesis of esophageal cancer. Semin Radiat Oncol 17, 2–9 (2007). [DOI] [PubMed] [Google Scholar]
- Li L. W. et al. A novel tumor suppressor gene ECRG4 interacts directly with TMPRSS11A (ECRG1) to inhibit cancer cell growth in esophageal carcinoma. BMC Cancer 11, 52 (2011). [DOI] [PMC free article] [PubMed] [Google Scholar]
- Chen H. B. et al. Human papillomavirus 16 E6 is associated with the nuclear matrix of esophageal carcinoma cells. World J Gastroenterol 7, 788–791 (2001). [DOI] [PMC free article] [PubMed] [Google Scholar]
- Wu L. F. et al. Preoperative TN staging of esophageal cancer: comparison of miniprobe ultrasonography, spiral CT and MRI. World J Gastroenterol 9, 219–224 (2003). [DOI] [PMC free article] [PubMed] [Google Scholar]
- Enzinger P. C. & Mayer R. J. Esophageal cancer. N Engl J Med 349, 2241–2252 (2003). [DOI] [PubMed] [Google Scholar]
- Krasna M. J. Multimodality therapy for esophageal cancer. Oncology (Williston Park) 24, 1134–1138 (2010). [PubMed] [Google Scholar]
- Awut I. et al. Molecular pathological diagnosis for early esophageal cancer in Kazakh patients. Oncol Lett 3, 549–553 (2012). [DOI] [PMC free article] [PubMed] [Google Scholar]
- Takeda T. et al. Phase-contrast X-ray imaging with a large monolithic X-ray interferometer. J Synchrotron Radiat 7, 280–282 (2000). [DOI] [PubMed] [Google Scholar]
- Willis J. et al. Correlation of EUS measurement with pathologic assessment of neoadjuvant therapy response in esophageal carcinoma. Gastrointest Endosc 55, 655–661 (2002). [DOI] [PubMed] [Google Scholar]
- Drudi F. M. et al. Esophagogram and CT vs endoscopic and surgical specimens in the diagnosis of esophageal carcinoma. Radiol Med 103, 344–352 (2002). [PubMed] [Google Scholar]
- Irie H. et al. Comparison of helical CT and MR imaging in detecting and staging small pancreatic adenocarcinoma. Abdom Imaging 22, 429–433 (1997). [DOI] [PubMed] [Google Scholar]
- Ampil F. L., Caldito G., Li B. D. & Pelser R. Computed tomographic staging of esophageal cancer and prognosis. Radiat Med 19, 127–129 (2001). [PubMed] [Google Scholar]
- Luketich J. D. et al. Minimally invasive surgical staging for esophageal cancer. Surg Endosc 14, 700–702 (2000). [DOI] [PubMed] [Google Scholar]
- Rosch T. et al. Local staging and assessment of resectability in carcinoma of the esophagus, stomach, and duodenum by endoscopic ultrasonography. Gastrointest Endosc 38, 460–467 (1992). [DOI] [PubMed] [Google Scholar]
- Botet J. F. et al. Preoperative staging of esophageal cancer: comparison of endoscopic US and dynamic CT. Radiology 181, 419–425 (1991). [DOI] [PubMed] [Google Scholar]
- Biederer J. et al. Lung morphology: fast MR imaging assessment with a volumetric interpolated breath-hold technique: initial experience with patients. Radiology 226, 242–249 (2003). [DOI] [PubMed] [Google Scholar]
- Zhang L. & Luo S. Micro soft tissues visualization based on x-ray phase-contrast imaging. Open Med Inform J 5, 19–25 (2011). [DOI] [PMC free article] [PubMed] [Google Scholar]
- Tang L., Li G., Sun Y. S., Li J. & Zhang X. P. Synchrotron-radiation phase-contrast imaging of human stomach and gastric cancer: in vitro studies. J Synchrotron Radiat 19, 319–322 (2012). [DOI] [PubMed] [Google Scholar]
- Richards D. G., Brown T. H. & Manson J. M. Endoscopic ultrasound in the staging of tumours of the oesophagus and gastro-oesophageal junction. Ann R Coll Surg Engl 82, 311–317 (2000). [PMC free article] [PubMed] [Google Scholar]
- May A. et al. Accuracy of staging in early oesophageal cancer using high resolution endoscopy and high resolution endosonography: a comparative, prospective, and blinded trial. Gut 53, 634–640 (2004). [DOI] [PMC free article] [PubMed] [Google Scholar]
- Mandal S. et al. Use of holmium:YAG laser in posterior urethral valves: another method of fulguration. J Pediatr Urol 9, 1093–1097 (2013). [DOI] [PubMed] [Google Scholar]


