Abstract
Purpose
The objective of this study was to compare a new generation of four-dimensional (4D) microSPECT with microCT for quantitative in vivo assessment of murine cardiac function.
Procedures
4D isotropic cardiac images were acquired from normal C57BL/6 mice with either microSPECT at 350-micron resolution (n=6) or microCT at 88-micron resolution (n=6). One additional mouse with myocardial infarction (MI) was scanned with both modalities. Prior to imaging, mice were injected with either 99mTc -tetrofosmin for microSPECT, or a liposomal blood pool contrast agent for microCT. Segmentation of the left ventricle (LV) was performed using Vitrea (Vital Images) software, to derive global and regional function.
Results
Measures of global LV function between microSPECT and microCT groups were comparable (e.g. ejection fraction=71±6%-microSPECT and 68±4%-microCT). Regional functional indices (wall motion, wall thickening, regional ejection fraction) were also similar for the two modalities. In the mouse with MI, microSPECT identified a large perfusion defect that was not evident with microCT.
Conclusions
Despite lower spatial resolution, microSPECT was comparable to microCT in the quantitative evaluation of cardiac function. MicroSPECT offers an advantage over microCT in the ability to evaluate myocardial perfusion radiotracer distribution and function simultaneously. MicroSPECT should be considered as an alternative to microCT and MR for preclinical cardiac imaging in the mouse.
Introduction
In vivo cardiac imaging in mouse models has proven useful in the study of human cardiac disease, as well as in the development of potential treatment strategies [1-5]. Given the small size of the mouse heart (long axis is approximately 7 mm) and rapid heart rate (450-600 beats per minute) [6], murine cardiac imaging is challenging because both high spatial and temporal resolutions are required.
Despite these challenges, multiple preclinical imaging modalities are currently available to measure murine cardiac function. Successful studies have been previously reported for both MR [7-12] and microCT [13-17]. Fewer studies in the mouse, however, have explored SPECT as a potential tool for evaluating left ventricular function [18-21]. This is likely due to the typically lower spatial resolution of older-generation microSPECT systems. Recently, sub-half millimeter resolution has been achieved with a new generation of microSPECT scanners using multi-pinhole collimation [20]. To date, no studies have evaluated high-resolution microSPECT for cardiac functional imaging in the mouse, or compared microSPECT with other modalities for use in preclinical cardiac imaging. Consequently, the goal of this study was to evaluate microSPECT as a tool for measuring murine cardiac function by comparing it directly with microCT.
While magnetic resonance (MR) has been considered the “gold standard” for cardiac imaging in the mouse, both microSPECT and microCT may offer alternatives and even some advantages. In this regard, it is important to inquire—what are the tradeoffs for assessment of cardiac function? Clearly there are marked differences in several imaging parameters between microSPECT and microCT/MR, including spatial resolution, voxel volume, and contrast-to-noise ratio (CNR) [3, 8-10, 14-15, 17-19]; but it is not clear how these differences impact the volumetric analysis of cardiac function. Cardiac imaging with microSPECT is attractive as a potential alternative to microCT and MR in that it permits both functional analysis and quantitative evaluation of radiotracer distribution in tissue from a single acquisition. The limited resolution of previous generations of microSPECT systems (0.6-1.0 mm) [18-19] also made them a poor option alternative for evaluating cardiac anatomy. However, the spatial resolution of the microSPECT system evaluated here (at 350 microns) presents the possibility of simultaneous anatomic, functional, and molecular imaging.
Here, we first characterize the imaging protocols in control C57BL/6 mice for microSPECT and microCT, and using the same functional analysis, compare measures of both global and regional left ventricular function. We then compare 4D microSPECT and microCT datasets obtained from a mouse with myocardial infarction. The advantages and disadvantages of microSPECT, microCT, and MR will be discussed.
Material and Methods
In vivo experiments in mice
All animal imaging studies were approved by the institutional subcommittee on research animal care of the Duke University Institutional Animal Care and Use Committee (IACUC). C57BL/6 mice microSPECT (n=6) and microCT (n=6) groups. One additional C57BL/6 mouse was imaged with both modalities within 24 hours.
MicroSPECT imaging
MicroSPECT acquisitions were performed with a commercially available U-SPECTII/CT system fitted with a 0.35 mm multi-pinhole collimator (MILabs, Utrecht, The Netherlands). This isotropic voxel volume (42 nl) is more than 5X smaller than the voxels of previous generation microSPECT systems [22].
During image acquisition, animals were placed prone on a custom heated animal bed with integrated electrocardiogram (ECG) and respiratory monitoring (MILabs, Utrecht, The Netherlands). Body temperature was maintained at 38°C. Mice were maintained under general anesthesia throughout the imaging procedure with 1.5% isoflurane in mixed gas, delivered via nose cone at a rate of 0.4 liters/minute. Anesthetized mice were injected via tail vein catheter with 185-370 MBq of 99mTc -tetrofosmin (GE Healthcare, Arlington Heights, IL) prior to image acquisition. Care was taken to minimize injection volume by using a delivery system developed in our laboratory, which eliminates the need for a post-injection saline flush and permits total injected volumes as low as 50-100 μL for the radiotracer dose range used in this study. Briefly, a modified and blunted 24-guage needle (Hospira, Inc., Lake Forest, IL) is fitted to a short length of PE-90 polyethylene tubing (Intramedic®, Becton Dickinson and Co., Sparks, MD), which is then attached to a 1cc syringe (Becton Dickinson & Co., Franklin Lakes, NJ). Radiotracer is drawn into the modified needle, which is then inserted through the plastic hub of the tail-vein catheter to form a watertight seal, thereby bypassing dead space within the catheter hub. The radiotracer can then be injected, and then the modified needle removed, without the need to clear indwelling saline or perform a saline flush afterward.
Immediately following radiotracer injection, microSPECT images were acquired over 120 minutes. The field-of-view was adjusted to the margins of the heart using orthogonal radiographs generated by the integrated microCT unit. Data were acquired in listmode and reconstructed with retrospective cardiac gating (10 time bins per cardiac cycle) using the built-in U-SPECTII/CT reconstruction software; this software utilizes the Pixel-based Ordered Subset Expectation Maximization (POSEM) iterative reconstruction algorithm (6 iterations, 16 subsets, reconstructed at a voxel resolution of 0.125 mm) [23]. Reconstructed images were viewed and a Gaussian filter was applied (0.4 full width at half-maximum) using PMOD v.3.3 biomedical image quantification software (PMOD Technologies Ltd., Zurich, Switzerland); images were then transferred to a separate Vitrea® (Vital Images, Inc., Minnetonka, MN) workstation for further analysis.
MicroCT imaging
MicroCT data acquisitions were performed with a dual source microCT system developed in our laboratory explicitly for dynamic applications, which has been described in detail elsewhere [24]. This system offers the highest spatial resolution currently available for 4D cardiac microCT imaging with isotropic resolution at .088 mm (voxel volume=0.68 nl) [13-15]. The system contains two G-297 x-ray tubes (Varian Medical Systems, Palo Alto, CA) with 0.3/0.8 mm focal spot size, two Epsilon High Frequency X-ray generators by EMD Technologies (Quebec, Canada), and two CCD based detectors with a Gd2O2S phosphor (XDI-VHR 2 Photonic Science, East Sussex, UK) with 22-micron pixels, which we typically bin to 88 microns. The x-ray tubes and detectors are arranged orthogonally. The data acquisition is controlled by a sequencing application written in LabVIEW (National Instruments, Austin, TX). To limit motion blur, we used pulsed x-rays at 80 kVp and 100 mA, with a 10 ms exposure time.
During imaging with microCT, mice were anesthetized with isoflurane (1.5%) mixed with 50% oxygen and balanced with nitrogen delivered via nose cone at 0.4 liters/minute, and were maintained under general anesthesia throughout the entire imaging procedure. ECG was monitored with electrodes (Blue Sensor, Medicotest, UK) taped to the front footpads. Body temperature was maintained at 38°C with heat lamps connected to a rectal probe and feedback controller (Digi-Sense®, Cole Parmer, Chicago, IL). A pneumatic pillow on the thorax was used to monitor respiration.
To provide the necessary blood/tissue contrast, we used a liposomal blood pool contrast agent containing 123 mg Iodine per mL [25]. The liposomes were delivered by injection via tail vein catheter, at a dose of 0.012 ml/g body weight. To avoid volume overload, care was taken to ensure a total injection volume < 0.3 mL. Following administration of the liposomal agent, contrast between blood and myocardium was approximately 350-450 Hounsfield Units (HU).
Immediately after injection of the liposomal contrast agent, we performed 4D microCT sampling using retrospective cardio-respiratory gating [14]. Projection images were acquired at a rapid and constant rate of 20 projections/second without waiting for cardiac and respiratory coincidence. Respiratory signals and ECG were monitored and saved in synchrony with the acquisition of the projections. Sampling involved 5 rotations of the animal, with 450 projections acquired per each full rotation. A total of 2250 projections were acquired, with acquisition time between 5 and 10 minutes.
The procedures for post-sampling processing and reconstruction based on retrospective gating data have been described in detail elsewhere [26], but are summarized here. A MATLAB (MathWorks, Natick, MA) script was used to sort the projection images in association with angle and cardio-respiratory phase information. This script detects the R peaks in the ECG signal and the maxima in the respiratory signal. Each cardiac cycle is divided into 10 intervals (each equal to 10% of the RR interval). Each projection is temporally registered with the ECG and respiration signal, and then assigned to a certain cardiac phase by calculating the temporal distance between the projection sampling time and the nearest R peak, and dividing that distance by the RR interval. A similar operation is used to label projections with information related to respiratory phase. This information is stored and used during reconstruction.
Reconstruction of each set is performed with a filtered back projection Feldkamp algorithm [27]. Streak artifacts are often seen in the reconstructed images acquired with retrospective gating. This occurs because, in retrospective gating, the angular distribution of the projections is irregular. To overcome this problem, we generated a synthetic set of projections with a regular angular distribution by using a weighted interpolation of projections over all angles and all cardiac and respiratory phases [26]. To reduce noise and any remaining artifacts, this method also employs multi-dimensional bilateral filtration.
MicroCT imaging resulted in 10 separate 3D datasets that correspond to 10 phases of the cardiac cycle, each with a matrix size of 512x512x300, a voxel size of 88 microns, and a voxel volume of 0.68 nL.
Imaging myocardial infarction
To further compare microCT and microSPECT, we imaged a mouse with myocardial infarction (MI) at 14 days after left-anterior descending (LAD) coronary artery ligation procedure. A single (n=1) C57BL/6 mouse was used to create a model of myocardial infarction induced by coronary artery ligation, as described elsewhere [28]. The mouse was maintained under general anesthesia throughout the surgical procedure, as detailed above. A thoracotomy was performed in the fourth left intercostal space. The left ventricle (LV) was visualized and the LAD coronary artery was permanently ligated with a monofilament nylon 8-0 suture at the level of the left atrial appendage. This mouse was imaged with microSPECT and microCT according to the protocols described previously. MicroCT imaging was performed first, followed by microSPECT imaging 24 hours later.
Radiation dosimetry
To estimate absorbed radiation dose to the animal for microSPECT, we used the most recent version of MIRD software (OLINDA/EXM) to compute the radiation dose to a 25g tissue-equivalent sphere [29]. Taking into account both physical decay and fecal/urinary excretion, we estimated the self-dose to a 25g mouse to be 8.23 rad per millicurie. The radiation dose in microCT was estimated using MOSFET Detectors [30].
Analysis
Contrast-to-noise ratio (CNR) was calculated for both microSPECT and microCT images prior to any post-processing, according to the following equation [31]:
Measurements of global left ventricle (LV) function for both modalities were performed using a commercially available software package that semi-automatically segments the left ventricle (LV) over 10 phases of the cardiac cycle and provides volumetric measurements at each phase (Vitrea v5.2 LV Functional Analysis, Vital Images Inc., Minnetonka, MN). The LV end-diastolic (EDV) and end-systolic (ESV) volumes were converted to absolute volumes by multiplying with voxel volumes, and then used to compute stroke volume (SV), ejection fraction (EF), and cardiac output (CO), as in:
Comparison of regional cardiac function was accomplished using the method recently reported by Constantinides et al [5]. For this analysis, both endocardium and epicardium are semi-automatically segmented using Vitrea.
Wall motion (a), wall thickening (b) and regional ejection fraction (rEF) (c) were calculated according to [32]:
| (a) |
| (b) |
| (c) |
Based on this analysis, in both study groups and for the single animal with myocardial infarction, bullseye plots of regional left ventricular function were generated. These plots divide the left ventricle into 17 segments according to American Heart Association guidelines [33]. Sector 17 was omitted form the analysis as no data could be obtained for this segment in Vitrea for either modality. One potential explanation is that sector 17 represents the extreme apex where no ventricular cavity is present, which may preclude identification of the ventricular wall by the Vitrea software. The mean values in each of the segments were used to compute statistics over multiple mice in both microSPECT and microCT groups, and to construct composite bullseye plots for microSPECT and microCT groups using a polar data plot script in MATLAB [34]. Mean global and regional functional indices from microCT and microSPECT groups were compared using a 2-tailed unpaired t-test. P values ≤0.05 were considered to be statistically significant.
Results
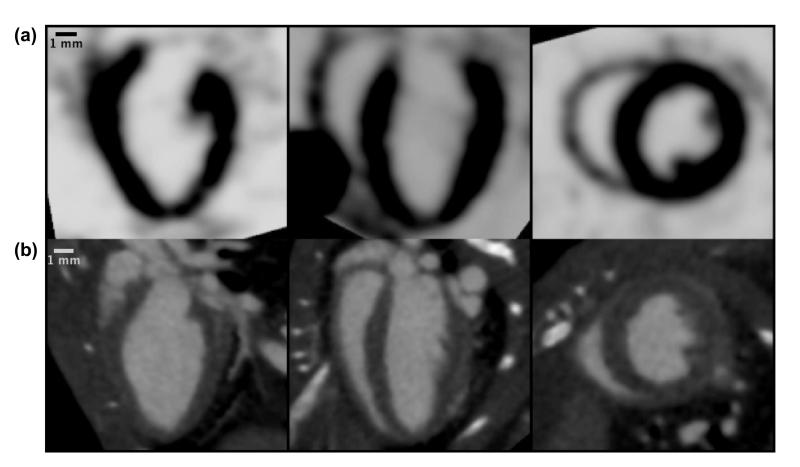
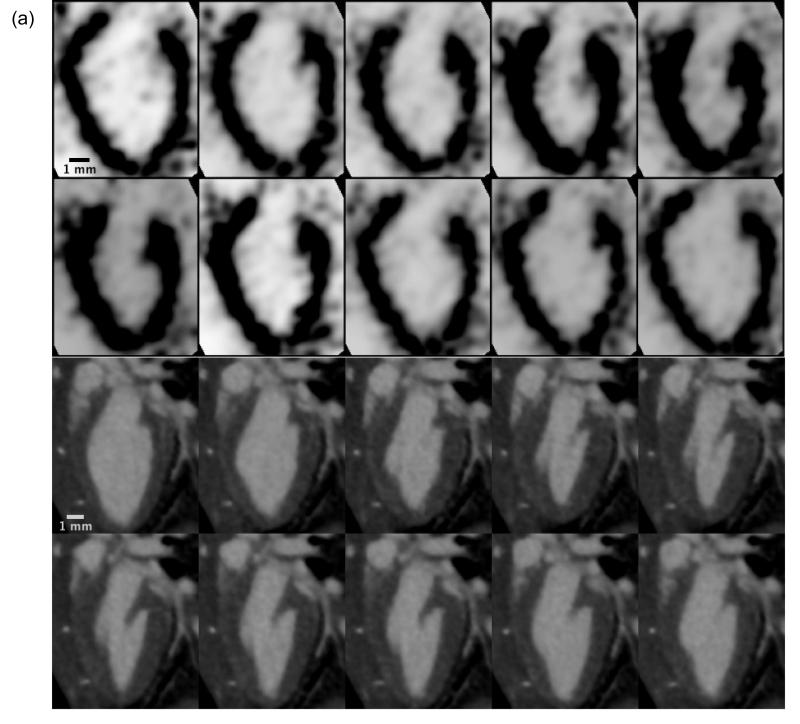
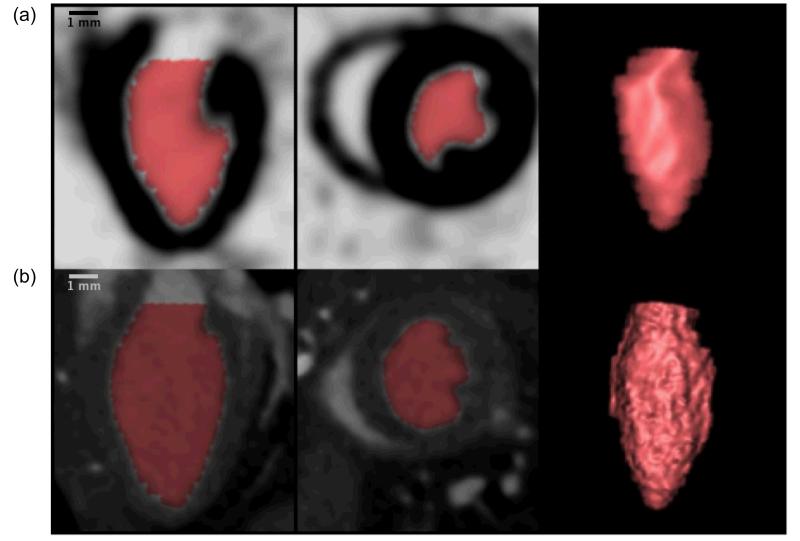
4D isotropic datasets were generated for both microCT (n=6) and microSPECT (n=6) groups. Orthogonal views of the mouse heart from representative isotropic microSPECT and microCT datasets are shown in Figure 1. Figure 2 shows a long-axis view of the mouse left ventricle over 10 phases of the cardiac cycle in representative microSPECT and microCT group animals. The dynamic 4D data (as shown in Figure 2) were subsequently analyzed using semi-automatic volumetric segmentation as described above. An example of this segmentation is shown in Figure 3, in which the colored region represents the calculated left ventricular volume in long and short axis, and also as a 3D-rendering.
Figure 1.
Comparison of isotropic microSPECT (a) and microCT (b) cardiac datasets as displayed in the Vitrea software, showing three orthogonal views of the mouse heart acquired during diastole. The isotropic datasets are used by Vitrea for volumetric segmentation of the left ventricle.
Figure 2.
Dynamic 4D cardiac microSPECT (a) and microCT (b) images showing a single long-axis slice of the murine left ventricle in a sagittal orientation over 10 phases of the cardiac cycle (10 time bins). Each phase represents a distinct 3D isotropic dataset, which are each compiled via retrospective cardiac gating and then used in the 4D volumetric segmentation process in Vitrea.
Figure 3.
Sagittal long axis view, axial short axis view, and 3D-rendering of the left ventricle in the mouse from microSPECT (a) and microCT (b) datasets, demonstrating volumetric segmentation of the left ventricle using Vitrea LV functional analysis software. Note the increased detail in the microCT-based 3D rendering, reflective of higher spatial resolution compared with microSPECT.
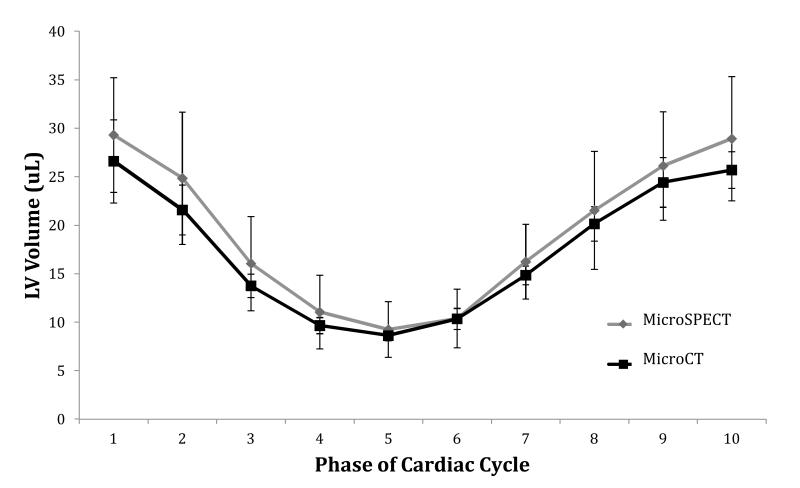
Figure 4 compares the mean LV chamber volume in microSPECT and microCT groups at each of 10 distinct phases of the cardiac cycle (10 time bins). We found no significant differences in mean volumetric measurements between the two groups at any point during the cycle.
Figure 4.
Comparison of average left ventricle (LV) volume at each of 10 phases of the cardiac cycle in microSPECT and microCT groups. Plotted values represent the mean LV volume of all animals (n=6) in that study group. Error bars represent ± one standard deviation. No significant differences in mean LV chamber volumes were found between the two study groups at any phase of the cardiac cycle.
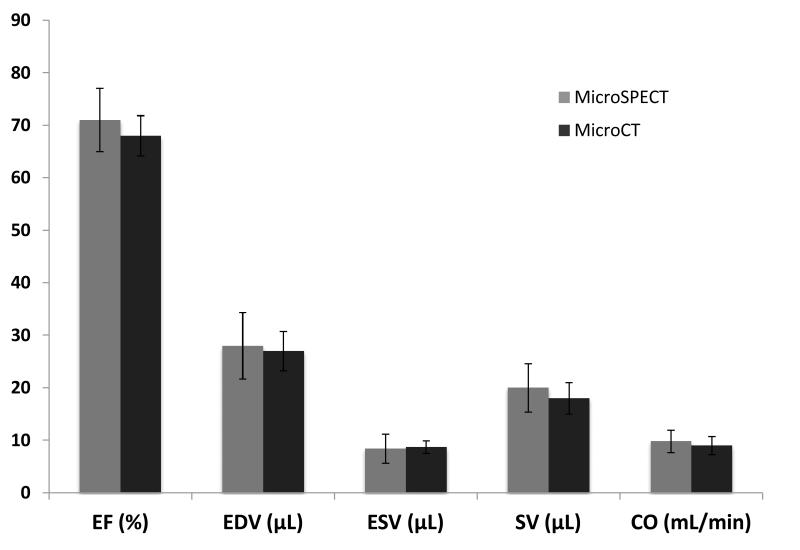
Based on the results of the volumetric segmentation, we calculated mean global left ventricular function using several indices (see Figure 5). Specifically, for microSPECT and microCT the mean ejection fraction (%) was (71 ± 6 and 68 ± 4 p=0.33); the mean end-diastolic volume (EDV) was (28 ± 6 and 27± 4 uL p=0.71), and the mean end-systolic volume was (8.4±2.8 vs 8.7±1.2 uL p=0.85). Mean stroke volume (uL) was 20 ± 5 for microSPECT and 18 ± 3 for microCT (p=0.43). Mean heart rate in the microSPECT group was 485 ± 10, compared with 490 ± 17 in the microCT group (p=0.53). Mean cardiac output was 9.8 ± 2.2 vs 9.0 ± 1.7 mL/min for microSPECT and microCT, respectively (p=0.53). Mean heart rate was 485±10 for microSPECT and 490±17 for microCT (p=0.53). There was no observed effect on heart rate after injection of contrast medium/radiotracer in either modality. For all measured indices, no significant differences were seen between the two groups.
Figure 5.
Comparison of global cardiac functional indices in microSPECT (n=6) and microCT (n=6) groups based on volumetric analysis of the left ventricle (LV) in Vitrea software; bars respresent the average of all animals (n=6) in that study group. No statistically significant differences were found. Error bars represent ± one standard deviation. Mean heart rate was 485±10 for microSPECT and 490±17 for microCT (p=0.53). (EF=ejection fraction; EDV= end-diastolic volume; ESV=end systolic volume: SV=stroke volume; CO=cardiac output)
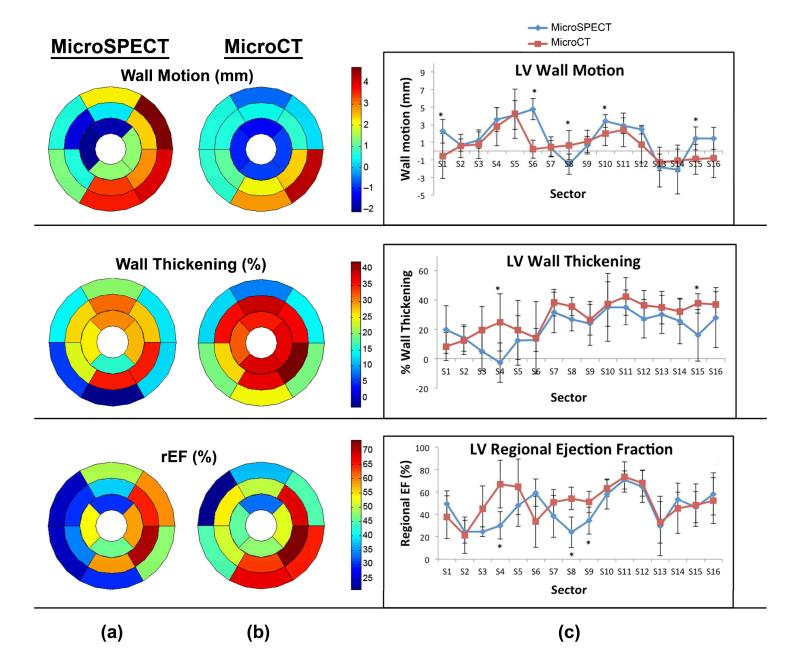
Figure 6 shows a comparison of regional LV function in microSPECT and microCT groups. Bullseye plots and one-dimensional plots of wall motion, wall thickening, and regional ejection fraction (rEF) display the average values of all six animals in the study group, measured for each sector of the LV. Measured parameters were largely similar for microCT and microSPECT; the few segmental measurements where differences between the two groups did reach statistical significance (p≤.05) are marked with asterisks in Figure 6c.
Figure 6.
Regional parameter quantification and comparisons in microSPECT (n=6) and microCT (n=6) groups using Vitrea software. (a, b) Composite bullseye plots for wall motion, wall thickening, and regional ejection fraction are shown, and represent the average values for for all mice in that study group (n=6). (c) Intercomparison of regional functional indices, calculated from 17-sector bullseye plot representations of the left ventricle according to American Heart Association guidelines [33]. Asterisks indicate that a statistically significant difference was found between the two modalities in that sector (p≤.05).
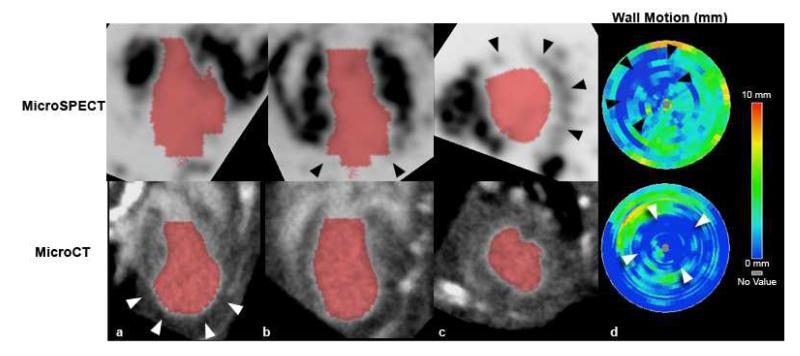
Figure 7 compares microSPECT and microCT 4D datasets performed in the same mouse with a surgically-induced myocardial infarction. A large anterolateral perfusion defect is evident in the microSPECT images (black arrowheads in Figure 7b, 7c), but is not seen by microCT. MicroCT does, however, show apparent dilation of the apical portion of the LV (white arrowheads in Figure 7a). In both modalities, bullseye plots show wall motion abnormalities consistent with myocardial infarction (see arrowheads in Figure 7d). Diminished LV wall motion was seen in regions corresponding to the perfusion defect demonstrated by microSPECT and the apical dilation shown by microCT. Global LV function in this mouse with myocardial infarction was diminished, with a calculated EF of 30% by microSPECT and 38% by microCT.
Figure 7.
(a-c) MicroSPECT (top) and microCT (bottom) images of the same mouse heart, acquired at approximately 14 days after left-anterior descending (LAD) coronary artery ligation procedure, with resultant myocardial infarction. The infarcted area is visible as a large anterolateral perfusion defect in the microSPECT images (black arrowheads in [b,c]), which is not evident in the microCT images. The microCT images do, however, show some apparent dilation of the apical portion of the left ventricle (white arrowheads in [a]). (d) Bullseye plots of LV regional wall motion for this mouse show distinct apical and LAD territory wall motion abnormalities (arrowheads) in both modalities, consistent with myocardial infarction. These areas of decreased wall motion correspond to the perfusion defect identified by microSPECT (black arrowheads), and the apical dilation seen by microCT (white arrowheads).
The imaging parameters for microSPECT, microCT, and MR (as given by Bucholz et al. [8]), as well as the advantages and disadvantages of each modality are presented in Table 1. For the two study groups, the mean contrast-to-noise ratio (CNR) as calculated from the original microSPECT and microCT images revealed that, for the contrast and radiotracer doses used in this study, microCT provided greater CNR by nearly a factor of 2 compared with microSPECT.
Table 1.
Comparison of microSPECT and microCT imaging parameters, advantages, and limitations.
| MicroSPECT | MicroCT | |
|---|---|---|
| Spatial resolution* | 350 × 350 × 350 μm3 | 88 × 88 × 88 μm3 |
| Voxel Volume | 42.9 nL | 0.68 nL |
| CNR | 5.09 ± 1.6 | 8.82 ± 1.9 |
| Acquisition time | 120 minutes ** | 5-10 minutes |
| Radiation Dose | 400-800 mGy | 360 mGy |
| Advantages |
|
|
| Disadvantages |
|
|
true spatial resolution, microSPECT images were reconstructed with a voxel resolution of 125 microns for analysis
further experimentation needed to determine minimum combination of scan time/radiotracer injected activity required for cardiac functional analysis in Vitrea®
for MicroCT with blood pool contrast agent. Note, however, that imaging myocardial infarction is possible via delayed hyper-enhancement [28].
CNR = contrast-to-noise ratio
In this study, microSPECT group mice received 185-370 MBq of 99mTc-tetrofosmin approximately 5 minutes prior to scanning, which resulted in an approximate absorbed dose to the animal of 400-800 mGy, compared with approximately 360 mGy for microCT. The LD 50/30 for mice is reported to be approximately 7 Gy [35-36].
Discussion
In this study, we have directly compared microSPECT with microCT as an imaging tool for evaluation of murine cardiac function. MR has been widely used for functional cardiac imaging in the mouse with both 2D and 3D acquisitions. MicroCT has been employed less commonly, primarily because commercial systems utilizing micro focal spot tubes have very low output and require significant integration time/view to achieve reasonable contrast-to-noise. The system we used for comparison here has been designed explicitly for rodent cardiac imaging and represents what we believe to be the state-of-the-art for cardiac microCT. Both microSPECT and microCT are valuable alternatives to MR for preclinical cardiac imaging and offer distinct advantages. For example, both the microSPECT and microCT systems presented in this study produce 3D isotropic datasets. In contrast, preclinical MR, while similar to microCT in spatial resolution and CNR, does not typically produce isotropic data (Table 1). Indeed, the vast majority of work in imaging the mouse heart with MR has been done by imaging only a few slices through the heart, with a small number of publications that present a true 3D imaging technique [3, 8, 37]. MR application to murine cardiac functional imaging has also been limited given that acquisition times are long and segmentation is usually not automated [3].
By directly comparing microSPECT with microCT, we found, despite a marked difference in spatial resolution and CNR, excellent agreement in measured cardiac function between the two modalities (Figure 5). It should be noted that this was the case despite a fundamental difference in the contrast generating material used, i.e. the isovue contrast agent in CT remains laregely in the vasculal space, while 99mTc-tetrofosmin leaves the blood pool and is taken up by the myocardium. The agreement in calculated mean cardiac output between microSPECT and microCT groups was good, differing by approximately 8% i.e. 0.8 mL/min (9.8±2.2 and 9.0±1.7 mL/min for microSPECT and microCT); global LV ejection fraction was also well matched, at 71±6% for microSPECT and 68±3.8% for microCT (a relative difference of approximately 5%). Not surprisingly, the higher resolution microCT gave a slightly tighter standard deviation for all indices (it was 4% in microCT vs 6% in microSPECT for left ventricular EF).
Quantitative measures of mean wall motion, wall thickening, and regional ejection fraction were also closely matched, demonstrating similar patterns of transmural variation in the two groups in most sectors (Figure 6). This agreement is supported by the absence of statistically significant differences in all but a few cases. The few significant differences that are seen may be a consequence of volume averaging in the lower resolution microSPECT images.
The mean EF and CO values we obtained in both study groups were comparable to what is reported elsewhere [8-10, 17-19]. Our results for end-diastolic volume (EDV) and end-systolic volume (ESV) are similar to those obtained by Dawson et al. [9] in a study comparing 3D echocardiography with MR for evaluation of LV function. Our study also showed good internal agreement between calculated EDV and ESV values in the two modality groups. There were differences, however, in our calculated EDV and ESV values compared with some prior studies [3, 8, 14, 17] which may have resulted from differences in injected contrast agent volume and anesthetic conditions. In prior experiments, we have observed that injected volumes > 300 μL result in hemodynamic consequences including reduced EF and increased EDV and ESV (unpublished). This 300 μL volume-limit can easily be exceeded if care is not taken to reduce or eliminate saline flushes during catheter insertion and following contrast injection. We have developed procedures for contrast (microCT) and radiotracer (microSPECT) injection which minimize the need for saline flushes, ensuring that total volume of injection is < 300 μL (see Methods: microSPECT imaging section). Differences in our calculated LV volumes compared with published MR data [3, 8, 11] could also be related to variations in the method used for volumetric analysis. MR volumetric measurements were typically calculated by a manual threshold segmentation, whereas our study utilized semi-automated segmentation with Vitrea LV functional analysis software [38].
One of the relative advantages of microSPECT over microCT was evident when both modalities were used to image a mouse with a surgically induced myocardial infarction. MicroSPECT readily identified a large perfusion defect consistent with MI involving the cardiac apex and lateral LV wall, which could not be seen by microCT (Figure 7a-c). Although both microCT and microSPECT did show decreased apical wall motion consistent with the presence of an infarct (see arrowheads on wall motion bullseye plots [Figure 7d]), only microSPECT revealed the actual margins of the infarct and associated perfusion deficits. We note, however, that other microCT techniques for imaging myocardial infarction are possible. For example, MI in the mouse has been evaluated via delayed hyper-enhancement [28] using conventional contrast agents such as Isovue 370 (Bracco Diagnostics, Inc., Monroe Township, NJ), although this is less common. Alternatively eXIA 160 (Binitio Biomedical, Inc., Ottawa, Ontario, Canada), an aqueous colloidal poly-disperse contrast agent, has been used recently by our group for imaging of myocardial infarction with dual-energy microCT (Ashton, Befera et al. 2013, accepted for publication). 2D and 3D MR techniques have also been used less commonly to identify myocardial infarction in pig and mouse models [39-40]. When compared with these alternative microCT and MR techniques, microSPECT still offers a relative advantage in imaging myocardial infarction in that both function and perfusion radiotracer distribution data can be obtained from a single acquisition and without the need for additional specialized contrast agents.
MicroSPECT also has several limitations when compared with microCT and MR. Comparison of imaging parameters in the three modalities (Table 1) reveals a marked disparity in spatial resolution and voxel volume between microSPECT and MR/microCT. Despite the use of a high-resolution 0.35 mm multi-pinhole collimator in this study, microSPECT voxel volume was still 63-times larger than voxel volumes in the comparison microCT and MR datasets (Table 1). This difference, however, did not appear to be a factor in volumetric segmentation of the left ventricle using the Vitrea software. The lower CNR of the microSPECT images (5.09 ± 1.66 for SPECT vs. 8.82 ± 1.89 for microCT) also did not appear to impair functional analysis of the 4D-microSPECT datasets.
Time required for imaging is another important consideration when comparing modalities. Acquisition time for microSPECT (120 min) was longer than the 30-60 minute scan times reported in published MR studies [3, 8, 10, 37], and was considerably longer than microCT acquisition time (5-10 minutes), and could therefore become a limitation in throughput. It should be noted however, that the microSPECT imaging protocol was not optimized for speed, but rather for image quality, and that 4D microSPECT datasets adequate for functional analysis were possible over a range of injected radiotracer activity (185-370 MBq). It is likely that microSPECT scan time could be reduced without negatively impacting functional analysis. Further experimentation is necessary to determine the minimum combination of radiotracer dose/scan time required to produce microSPECT images adequate for volumetric segmentation in the Vitrea software.
A limitation of both microSPECT and microCT when compared with other imaging modalities, such as MR, is the use of ionizing radiation. The absorbed dose associated with the methods in this study is not negligible, but represents between 9-18 times less than the mouse LD50/30 in the case of microSPECT, and approximately 19-times less than the mouse LD50/30 in the case of microCT [36]. Note that while this level of radiation exposure would have no effect on cardiac imaging, it could potentially become an issue in cancer studies by affecting the progression of some tumors. For microSPECT, the dose of radiopharmaceutical selected can vary widely depending on the size of the subject and the particular signal-noise ratio (SNR) requirements of the experiment. In this study, the dose was deliberately chosen at the high end of the spectrum to provide the highest quality of images and make comparisons between microCT and microSPECT more appropriate.
Despite its limitations, microSPECT has several advantages over microCT and MR in the evaluation of murine cardiac function (Table 1). MicroSPECT enables quantitative analysis of both cardiac function and tissue perfusion from a single 4D acquisition, without the need for multiple contrast agents or additional acquisition protocols. MicroSPECT readily identifies areas of ischemia or infarction which are not apparent with standard microCT imaging alone. These benefits should have practical applications in a number of pre-clinical experimental protocols involving mouse models of cardiac disease.
Conclusion
We have shown that in the mouse, microSPECT is similar to microCT in its ability to evaluate cardiac function. We compared our microSPECT system with the highest-resolution 4D microCT currently available, and found no significant differences between global LV functional indices in two separate but similar groups of mice. Regional mean functional indices (wall motion, wall thickening, rEF) were also similar with no significant differences in these parameters in the majority of LV sectors.
When compared with microCT and MR, microSPECT offers several advantages with respect to murine cardiac imaging. Specifically, microSPECT provides the capability, with a single acquisition, to quantify radiotracer uptake in the myocardium and identify global or regional ischemia. MicroSPECT also detects molecular probes with a 103 greater sensitivity than with currently available MR techniques [5, 41]. Given that microSPECT provides these added benefits, while also delivering a functional analysis equivalent to state-of-the-art microCT, microSPECT should be considered as a valid alternative to other preclinical imaging modalities when studying mouse models of cardiac disease.
Supplementary Material
Acknowledgements
All work was performed by the Duke Center for In Vivo Microscopy, an NIH/NIBIB Biomedical Technology Resource Center (P41 EB015897). Special thanks to Yi Qi for help with animal setup, and to Sidney Simon and Sally Zimney for editorial assistance.
References
- 1.Abel ED, Litwin SE, Sweeney G. Cardiac remodeling in obesity. Physiol Rev. 2008;88(2):389–419. doi: 10.1152/physrev.00017.2007. [DOI] [PMC free article] [PubMed] [Google Scholar]
- 2.Breckenridge R. Heart failure and mouse models. Dis Models Mech. 2010;3(3-4):138–143. doi: 10.1242/dmm.005017. [DOI] [PubMed] [Google Scholar]
- 3.Bucholz E, Ghaghada K, Qi Y, Mukundan S, Rockman HA, Johnson GA. Cardiovascular phenotyping of the mouse heart using a 4D radial acquisition and liposomal Gd-DTPA-BMA. Magn Reson Med. 2010;63(4):979–987. doi: 10.1002/mrm.22259. [DOI] [PMC free article] [PubMed] [Google Scholar]
- 4.Zaragoza C, Lavin B, Egido J, et al. Animal models of cardiovascular diseases. J Biomed Biotechnol. 20112011:497841. doi: 10.1155/2011/497841. [DOI] [PMC free article] [PubMed] [Google Scholar]
- 5.Constantinides C. Study of the Murine Cardiac Mechanical Function Using Magnetic Resonance Imaging: The Current Status, Challenges, and Future Perspectives. In: Andrade A, editor. Practical Applications in Biomedical Engineering. 2013. ISBN: 978-953-51-0924-2, InTech. [Google Scholar]
- 6.Perrino C, Gargiulo G, Pironti G, et al. Cardiovascular effects of treadmill exercise in physiological and pathological preclinical settings. Am J Physiol Heart Circ Physiol. 2011;300(6):1983–1989. doi: 10.1152/ajpheart.00784.2010. [DOI] [PubMed] [Google Scholar]
- 7.Badea CT, Bucholz E, Hedlund LW, Rockman HA, Johnson GA. Imaging methods for morphological and functional phenotyping of the rodent heart. Toxicol Path. 2006;34(1):111–117. doi: 10.1080/01926230500404126. [DOI] [PubMed] [Google Scholar]
- 8.Bucholz E, Ghaghada K, Qi Y, Mukundan S, Johnson GA. Four-dimensional MR microscopy of the mouse heart using radial acquisition and liposomal gadolinium contrast agent. Magn Reson Med. 2008;60(1):111–118. doi: 10.1002/mrm.21618. [DOI] [PMC free article] [PubMed] [Google Scholar]
- 9.Dawson D, Lygate CA, Saunders J, et al. Quantitative 3-dimensional echocardiography for accurate and rapid cardiac phenotype characterization in mice. Circulation. 2004;110(2):1632–1637. doi: 10.1161/01.CIR.0000142049.14227.AD. [DOI] [PubMed] [Google Scholar]
- 10.Schneider JE, Cassidy PJ, Lygate C, et al. Fast, high-resolution in vivo cine magnetic resonance imaging in normal and failing mouse hearts on a vertical 11.7 T system. J Magn Reson Imaging. 2003;18(6):691–701. doi: 10.1002/jmri.10411. [DOI] [PubMed] [Google Scholar]
- 11.Stegger L, Schafers KP, Schafers MA, Heijman E, Nicolay K, Strijkers GJ. Quantification of left ventricular volumes and ejection fraction in mice using PET, compared with MRI. J Nucl Med. 2009;50(1):132–138. doi: 10.2967/jnumed.108.056051. [DOI] [PubMed] [Google Scholar]
- 12.Wiesmann F, Ruff J, Hiller KH, Rommel E, Haase A, Neubauer S. Developmental changes of cardiac function and mass assessed with MRI in neonatal, juvenile, and adult mice. Am J Physiol. 2000;278(2):H652–657. doi: 10.1152/ajpheart.2000.278.2.H652. [DOI] [PubMed] [Google Scholar]
- 13.Badea C, Hedlund LW, Johnson GA. Micro-CT with respiratory and cardiac gating. Med Phys. 2004;31(12):3324–3329. doi: 10.1118/1.1812604. [DOI] [PMC free article] [PubMed] [Google Scholar]
- 14.Badea CT, Fubara B, Hedlund LW, Johnson GA. 4-D micro-CT of the mouse heart. Mol Imaging. 2005;4(2):110–116. doi: 10.1162/15353500200504187. [DOI] [PubMed] [Google Scholar]
- 15.Badea CT, Wetzel AW, Mistry N, Pomerantz S, Nave D, Johnson GA. Left ventricle volume measurements in cardiac micro-CT: The impact of radiation dose and contrast agent. Comput Med Imaging Graph. 2008;32(3):239–250. doi: 10.1016/j.compmedimag.2007.12.004. [DOI] [PMC free article] [PubMed] [Google Scholar]
- 16.Bartling SH, Stiller W, Grasruck M, et al. Retrospective motion gating in small animal CT of mice and rats. Invest Radiol. 2007;42(10):704–714. doi: 10.1097/RLI.0b013e318070dcad. [DOI] [PubMed] [Google Scholar]
- 17.Drangova M, Ford NL, Detombe SA, Wheatley AR, Holdsworth DW. Fast retrospectively gated quantitative four-dimensional (4D) cardiac micro computed tomography imaging of free-breathing mice. Invest Radiol. 2007;42(2):85–94. doi: 10.1097/01.rli.0000251572.56139.a3. [DOI] [PubMed] [Google Scholar]
- 18.Chin BB, Metzler SD, Lemaire A, et al. Left ventricular functional assessment in mice: feasibility of high spatial and temporal resolution ECG-gated blood pool SPECT. Radiology. 2007;245(2):440–448. doi: 10.1148/radiol.2452061973. [DOI] [PubMed] [Google Scholar]
- 19.Constantinesco A, Choquet P, Monassier L, Israel-Jost V, Mertz L. Assessment of left ventricular perfusion, volumes, and motion in mice using pinhole gated SPECT. J Nucl Med. 2005;46(6):1005–1011. [PubMed] [Google Scholar]
- 20.Golestani R, Wu C, Tio RA, et al. Small-animal SPECT and SPECT/CT: application in cardiovascular research. Eur J Nucl Med Mol Imag. 2010;37(9):1766–1777. doi: 10.1007/s00259-009-1321-8. [DOI] [PMC free article] [PubMed] [Google Scholar]
- 21.Lahoutte T. Monitoring left ventricular function in small animals. J Nucl Cardiol. 2007;14(3):371–379. doi: 10.1016/j.nuclcard.2007.04.014. [DOI] [PubMed] [Google Scholar]
- 22.Deleye S, Holen R, Verhaeghe J, Vandenberghe S, Stroobants S, Staelens S. Performance evaluation of small-animal multipinhole SPECT scanners for mouse imaging. Eur J Nucl Med Mol Imaging. 2013;40(5):744–758. doi: 10.1007/s00259-012-2326-2. [DOI] [PubMed] [Google Scholar]
- 23.Branderhorst W, Vastenhouw B, Beekman FJ. Pixel-based subsets for rapid multi-pinhole SPECT reconstruction. Phys Med Biol. 2010;55(7):2023–2034. doi: 10.1088/0031-9155/55/7/015. [DOI] [PubMed] [Google Scholar]
- 24.Badea CT, Drangova M, Holdsworth DW, Johnson GA. In vivo small-animal imaging using micro-CT and digital subtraction angiography. Phys Med Biol. 2008;53(19):R319–350. doi: 10.1088/0031-9155/53/19/R01. [DOI] [PMC free article] [PubMed] [Google Scholar]
- 25.Mukundan S, Jr., Ghaghada KB, Badea CT, et al. A liposomal nanoscale contrast agent for preclinical CT in mice. AJR Am J of Roentgenol. 2006;186(2):300–307. doi: 10.2214/AJR.05.0523. [DOI] [PubMed] [Google Scholar]
- 26.Johnston SM, Johnson GA, Badea CT. Temporal and spectral imaging with micro-CT. Med Phys. 2012;39(8):4943–4958. doi: 10.1118/1.4736809. [DOI] [PMC free article] [PubMed] [Google Scholar]
- 27.Feldkamp LA, Davis LC, Kress JW. Practical cone-beam algorithm. J Opt Soc Am. 1984;1(6):612–619. [Google Scholar]
- 28.Nahrendorf M, Badea C, Hedlund LW, et al. High-resolution imaging of murine myocardial infarction with delayed-enhancement cine micro-CT. A Am J Physiol Heart Circ Physiol. 2007;292(6):H3172–3178. doi: 10.1152/ajpheart.01307.2006. [DOI] [PMC free article] [PubMed] [Google Scholar]
- 29.Stabin MG, Sparks RB, Crowe E. OLINDA/EXM: the second-generation personal computer software for internal dose assessment in nuclear medicine. J Nucl Med. 2005;46(6):1023–1027. [PubMed] [Google Scholar]
- 30.De Lin M, Toncheva G, Nguyen G, et al. Application of MOSFET detectors for dosimetry in small animal radiography using short exposure times. Radiat Res. 2008;170(2):260–263. doi: 10.1667/RR1328.1. [DOI] [PMC free article] [PubMed] [Google Scholar]
- 31.Song X, Pogue BW, Jiang S, et al. Automated region detection based on the contrast-to-noise ratio in near-infrared tomography. Appl Opt. 2004;43(5):1053–1062. doi: 10.1364/ao.43.001053. [DOI] [PubMed] [Google Scholar]
- 32.Vital Images I Vitrea® Reference Guide (VPMC-10119F).
- 33.Cerqueira MD, Weissman NJ, Dilsizian V, et al. Standardized myocardial segmentation and nomenclature for tomographic imaging of the heart. A statement for healthcare professionals from the Cardiac Imaging Committee of the Council on Clinical Cardiology of the American Heart Association. Circulation. 2002;105(4):539–542. doi: 10.1161/hc0402.102975. [DOI] [PubMed] [Google Scholar]
- 34.Ennis D. Bullseye Polar Data Plot. http://www.mathworks.com/matlabcentral/fileexchange/16458-bullseye-polar-data-plot.
- 35.Funk T, Sun M, Hasegawa BH. Radiation dose estimate in small animal SPECT and PET. Med Phys. 2004;31(9):2680–2686. doi: 10.1118/1.1781553. [DOI] [PubMed] [Google Scholar]
- 36.Taschereau R, Chow PL, Chatziioannou AF. Monte Carlo simulations of dose from microCT imaging procedures in a realistic mouse phantom. Med Phys. 2006;33(1):216–224. doi: 10.1118/1.2148333. [DOI] [PMC free article] [PubMed] [Google Scholar]
- 37.Feintuch A, Zhu Y, Bishop J, et al. 4D cardiac MRI in the mouse. NMR Biomed. 2007;20(3):360–365. doi: 10.1002/nbm.1164. [DOI] [PubMed] [Google Scholar]
- 38.de Jonge GJ, van Ooijen PM, Overbosch J, Gueorguieva AL, Janssen-van der Weide MC, Oudkerk M. Comparison of (semi-)automatic and manually adjusted measurements of left ventricular function in dual source computed tomography using three different software tools. Int J Cardiovasc Imaging. 2011;27(6):787–794. doi: 10.1007/s10554-010-9727-8. [DOI] [PMC free article] [PubMed] [Google Scholar]
- 39.Peukert D, Laule M, Taupitz M, Kaufels N, Hamm B, Dewey M. 3D and 2D delayed-enhancement magnetic resonance imaging for detection of myocardial infarction: preclinical and clinical results. Acad Radiol. 2007;14(7):788–794. doi: 10.1016/j.acra.2007.03.006. [DOI] [PubMed] [Google Scholar]
- 40.Price AN, Cheung KK, Lim SY, Yellon DM, Hausenloy DJ, Lythgoe MF. Rapid assessment of myocardial infarct size in rodents using multi-slice inversion recovery late gadolinium enhancement CMR at 9.4T. J Cardiol Magn Reson. 2011;13:44. doi: 10.1186/1532-429X-13-44. [DOI] [PMC free article] [PubMed] [Google Scholar]
- 41.Meikle SR, Kench P, Kassiou M, Banati RB. Small animal SPECT and its place in the matrix of molecular imaging technologies. Phys Med Biol. 2005;50(22):45–61. doi: 10.1088/0031-9155/50/22/R01. [DOI] [PubMed] [Google Scholar]
Associated Data
This section collects any data citations, data availability statements, or supplementary materials included in this article.


