Abstract
Aims:
To establish the retinal sensitivity values in healthy Indians using microperimeter.
Materials and Methods:
In this prospective study, 144 healthy volunteers were included. All the participants underwent a comprehensive ophthalmic examination including contrast sensitivity. Microperimetry was performed in the central 20° of the macula using 76 stimulus points to assess the retinal sensitivity, and the fixation characteristics in the study population were assessed.
Results:
The mean age of the study sample was 43.08 ± 10.85 years (range: 25-69). Mean retinal sensitivity was 18.26 ± 0.99 dB. Males had significantly increased retinal sensitivity (18.34 vs. 18.17 dB, P = 0.03). The linear regression analysis revealed a 0.04 dB per year age-related decline in mean retinal sensitivity. Contrast sensitivity was significantly correlated with the mean retinal sensitivity (r = 0.432, P < 0.001). Fixation stability in the central 2° and 4° were 69% and 89%, respectively.
Conclusion:
Microperimeter is an ideal tool to assess the retinal sensitivity and the fixation behavior. These normative values could help in drawing a meaningful conclusion in various retinal pathologies.
Keywords: Contrast sensitivity, fixation, microperimeter, normative data, retinal sensitivity
Mapping of the central visual fields was done with various conventional perimeters. Scanning laser ophthalmoscope (SLO) microperimetry was the technique, which allowed obtaining a fundus-related sensitivity map, in patients with any level of visual acuity or fixation characteristics.[1] But, SLO fundus perimeter did not allow to perform fully-automatic examination.[2] Automatic follow-up examination to evaluate exactly the same retinal points tested during baseline microperimetry was not available with this instrument. These limitations have been overcome by the MP1 microperimeter.
The microperimeter combines fundus-tracking microperimetry with color fundus photography in a single instrument. The end product of perimetry and microperimetry exams is a sensitivity map of the examined retina. This is obtained by measuring patient's ability or inability to perceive light of varying intensities projected on different areas of the retina. In conventional perimetry, the stimulated fundus areas are identified by their geometric position with respect to the patient fixation area. The sensitivity map is generated by observing a live picture of the examined retina and allows, therefore, referring stimuli location to precise anatomical references. Microperimetry is then correlated with the fundus of the patient, reason for which it is also called fundus-related microperimetry. Microperimeter works on principle scanning laser ophthalmoscope (SLO).
Retinal sensitivity values for conventional perimetry in normal subjects have been reported earlier.[3,4,5] Shah et al.[6] have reported the normal retinal sensitivity values using fundus perimeter in the western population, but the corresponding values for fundus perimetry have not yet been described in the Indian population. The aim of this study is to evaluate light sensitivity thresholds and fixation stability using the MP-1 microperimeter in healthy individuals.
Material and Methods
One hundred and forty four eyes of 144 healthy volunteers were included in this prospective study, of which 53% were males. The study was approved by the Institutional Review Board of the hospital and adhered to the tenets of the Helsinki declaration. An informed consent was obtained from all subjects to whom the nature and possible consequences of the study were explained. All the participants underwent a comprehensive ophthalmic examination including refraction, anterior and posterior segment evaluation. A detailed medical and ocular history was elicited from each patient. Normal eyes were defined as those that had best correct visual acuity of 20/20 or better. Refractive errors within ± 3.0 D sphere and less than or equal to ± 1.0 D cylinder were included. Eyes with any visually significant ocular pathology were excluded. Contrast sensitivity was measured with Pelli-Robson contrast sensitivity test. Contrast sensitivity was reported as logarithmic contrast sensitivity values.[7] In addition to these, all the subjects also underwent microperimetry using MP 1 Microperimeter (Nidek Technologies, Padova, Italy).
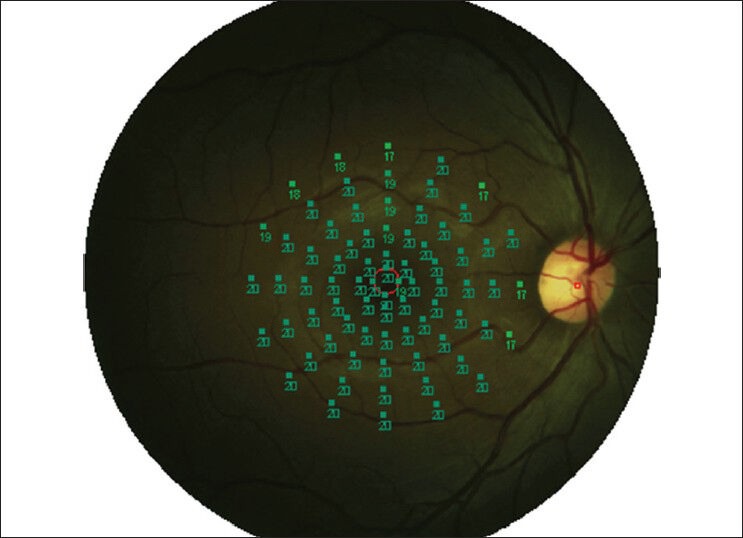
Microperimetry was performed in the mydriatic state using Goldmann size III stimuli, 4-2-1 threshold strategy and a white background with an intensity of 4 apostilbs. An automated program was used using 76 stimulus points, which were projected in the central 20° of fundus [Fig 1]. The retinal image was captured, initially, using the infrared camera. Then, the location of the blind spot was confirmed. The blind spot was used to check the false-positive responses. The stimuli were projected one at a time (duration of stimuli being 200 ms), and the subject was asked to respond to every stimulus seen by him by pressing a hand-held button while the subject concentrates at the centre target (1° circle). A well-defined reference mark in the retina was chosen by the examiner to help track the saccadic eye movements. The false-negative responses were tested once in every minute during the test to test the reliability of the test results. The data was registered on a color picture, and the retinal sensitivity was expressed in decibels.
Figure 1.

MP1 fundus perimetry study protocol performed in the central 20° with 76 stimulus points
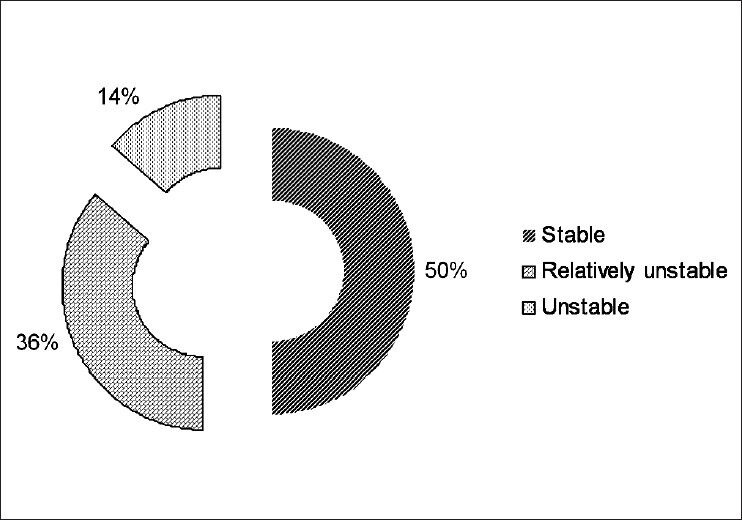
Fixation characteristics were measured according to Fujii et al.[8] For evaluating stability of fixation: Eyes with >75% fixation points located within the central 2° are classified as “stable fixation.” If <75% fixation points located within the 2° but >75% fixation points located within the 4° are classified as “relatively unstable fixation.” If <75% fixation points located within the 4° are classified as “unstable fixation.”
Statistical analyzes were performed using SPSS (Statistical Package for Social Sciences, version 15.0, Chicago, IL, USA). The results were expressed as mean ± SD if the variables were continuous and as percentages if the variables are categorical. The data were examined and found to be normally distributed. Independent t-test was used for comparing the parameters between the groups. Pearson correlation was used to assess the relation between the parameters. The level of statistical significance for P value was <0.05.
Results
The mean age of the study sample was 43.08 ± 10.85 years (range: 25-69). There was no difference in the age found between the genders (P = 0.37). The mean spherical equivalent refractive error was 0.08 ± 0.65 D (-3.00 to + 2.75 D). No correlation was found between spherical equivalent refractive error and the mean retinal sensitivity (r = -0.132, P = 0.125)
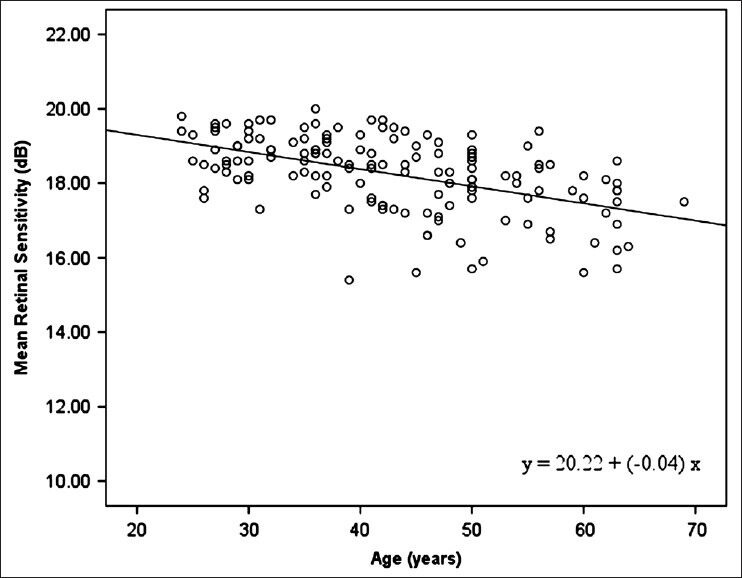
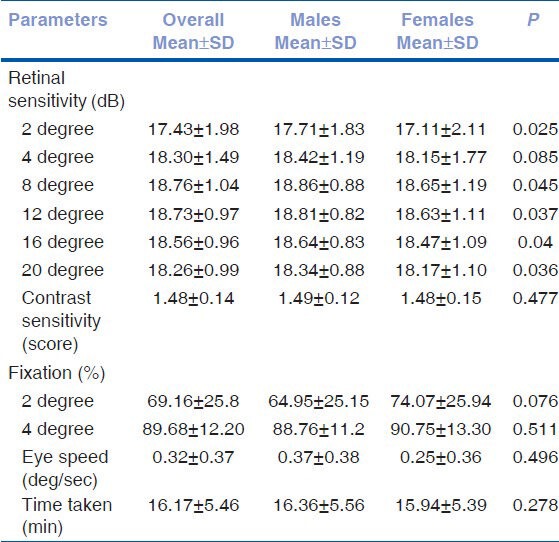
Table 1 shows microperimetry parameters comparison between the genders. The mean retinal sensitivity of the study sample was 18.26 ± 0.99 dB. Males had significantly increased retinal sensitivity in all the degrees. There was a linear decline in retinal sensitivity to light with increase in age. The linear regression analysis revealed a 0.04 dB per year age-related decline in mean retinal sensitivity [Fig 2]. Significant positive correlation was found between logarithmic contrast sensitivity and the mean retinal sensitivity (r = 0.432, P <0.001). Table 2 shows age-wise mean retinal sensitivity. There was a significant difference in mean retinal sensitivity found between the groups (P <0.001).
Table 1.
Microperimetry outcomes in the study sample

Figure 2.

Relationship between retinal sensitivity and age
Table 2.
Age-wise mean retinal sensitivity

The fixation stability values in the central 2° and 4° were 69% and 89%, respectively. No difference in fixation stability found between the genders. Fig 3 shows the fixation characteristics in the study population. There was no correlation found between age and fixation stability. The average time taken for the subjects to perform the test was 16 min 17 sec. The average eye speed of the subjects during the test was 0.32 ± 0.37.
Figure 3.

Showing fixation stability in study population
Discussion
Microperimetric examination of the macula is an ideal tool to assess the retinal sensitivity, scotoma size, and the fixation behavior in patients with macular diseases. However, to draw meaningful conclusion about the retinal pathologies, normative data and the reference values according to the age are required.
In our study, we found that the mean retinal sensitivity was 18.26 dB, which was similar to the study done by Shah VA et al.[6] Midena et al.[9] have reported that the mean retinal sensitivity in normal individuals using MP1 was 19.7 dB and with Octopus perimeter was 33.1 dB. It was also reported that the normal threshold values of MP1 cannot be compared with that of Octopus perimeter. Retinal sensitivity found in Midena et al.[9] was high compared to our study results; this could be due to the variation in the sample size. Linear decrease in the retinal sensitivity was found with increase in age, which was supported by earlier studies.[6,10] The pathogenesis of age-related reduction of retinal sensitivity, as reported by Lachenmayr et al.,[11] was due to loss to pre-retinal factors such as a reduction in pupil size and opacities of ocular media, whereas Johnson et al. suggest that this is primarily due to the neural loss rather than the pre-retinal factors.[12] We found a positive correlation between the contrast sensitivity and the retinal sensitivity, which was earlier reported in glaucoma patients in the study done by Zulauf et al.[13]
Males had a significantly high retinal sensitivity than females. However, Shah VA et al.[5] in their study did not report any difference in the retinal sensitivity value and the fixation stability for the gender. In our study, we did not find any correlation between age and fixation stability, which was otherwise reported in other studies.[5] The fixation stability in the central 2° area was 69%, which was less than that which was reported in the study done by Shah VA et al., which was 86%. The average time taken for the subjects in our study to perform the test was more compared to the study done by Shah et al., which is due to the test protocol used in our study, i.e., in our study. we have used 76 stimulus.
The strengths of our study are larger sample size and also the protocol used in our study include 76 tested points in the central 20° for assessing the retinal sensitivity, which could give more appropriate assessment of retinal sensitivity as the number of points tested in the central 20° was more compared to earlier study.[6] MP1 microperimeter is a reliable tool for the functional assessment of the subjects with various retinal pathologies and also could correlate structurally.
Footnotes
Source of Support: Nil.
Conflict of Interest: None declared.
References
- 1.Timberlake GT, Mainster MA, Webb RH, Hughes GW, Trempe CL. Retinal localization of scotomata by scanning laser ophthalmoscopy. Invest Ophthalmol Vis Sci. 1982;22:91–7. [PubMed] [Google Scholar]
- 2.Rohrschneider K, Fendrich T, Becker M, Krastel H, Kruse FE, Völcker HE. Static fundus perimetry using the scanning laser ophthalmoscope with an automated threshold strategy. Graefes Arch Clin Exp Ophthalmol. 1995;233:743–9. doi: 10.1007/BF00184084. [DOI] [PubMed] [Google Scholar]
- 3.Drance SM, Berry V, Hughes A. Studies on the effects of age on the central and peripheral isopters of the visual field in normal subjects. Am J Ophthalmol. 1967;63:1667–72. doi: 10.1016/0002-9394(67)93644-6. [DOI] [PubMed] [Google Scholar]
- 4.Haas A, Flammer J, Schneider U. Influence of age on the visual fields of normal subjects. Am J Ophthalmol. 1986;101:199–203. doi: 10.1016/0002-9394(86)90595-7. [DOI] [PubMed] [Google Scholar]
- 5.Heijl A, Lindgren G, Olsson J. Normal variability of static perimetric threshold values across the central visual field. Arch Ophthalmol. 1987;105:1544–9. doi: 10.1001/archopht.1987.01060110090039. [DOI] [PubMed] [Google Scholar]
- 6.Shah VA, Chalam KV. Values for macular perimetry using the MP-1 microperimeter in normal subjects. Ophthalmic Res. 2009;41:9–13. doi: 10.1159/000162111. [DOI] [PubMed] [Google Scholar]
- 7.Mäntyjärvi M, Laitinen T. Normal values for the Pelli-Robson contrast sensitivity test. J Cataract Refract Surg. 2001;27:261–6. doi: 10.1016/s0886-3350(00)00562-9. [DOI] [PubMed] [Google Scholar]
- 8.Fujii GY, De Juan E, Humayan MS, Sunness JS, Chang TS, Rossi JV. Characteristics of visual loss by scanning laser ophthalmoscope microperimetry in eyes with subfoveal choroidal neovascularization secondary to age-related macular degeneration. Am J Ophthalmol. 2003;136:1067–78. doi: 10.1016/s0002-9394(03)00663-9. [DOI] [PubMed] [Google Scholar]
- 9.Midena E, Radin PP, Convento E, Cavarzeran F. Macular automatic fundus threshold versus standard perimetry threshold. Eur J Ophthalmol. 2007;17:63–8. doi: 10.1177/112067210701700109. [DOI] [PubMed] [Google Scholar]
- 10.Jaffe GJ, Alvarado JA, Juster RP. Age-related changes of the normal visual field. Arch Ophthalmol. 1986;104:1021–5. doi: 10.1001/archopht.1986.01050190079043. [DOI] [PubMed] [Google Scholar]
- 11.Lachenmayr BJ, Kojetinsky S, Ostermaier N, Angstwurm K, Vivell PM, Schaumberger M. The different effects of aging on normal sensitivity in flicker and light-sense perimetry. Invest Ophthalmol Vis Sci. 1994;35:2741–8. [PubMed] [Google Scholar]
- 12.Johnson CA, Adams AJ, Lewis RA. Evidence for a neural basis of age-related visual field loss in normal observers. Invest Ophthalmol Vis Sci. 1989;30:2056–64. [PubMed] [Google Scholar]
- 13.Zulauf M, Flammer J. Correlation of spatial contrast sensitivity and visual fields in glaucoma. Graefes Arch Clin Exp Ophthalmol. 1993;231:146–50. doi: 10.1007/BF00920937. [DOI] [PubMed] [Google Scholar]


