Abstract
Aim:
To provide the normative data of macular and retinal nerve fiber layer (RNFL) thickness in Indians using spectral domain OCT (Spectralis OCT, Heidelberg Engineering, Germany) and to evaluate the effects of age, gender, and refraction on these parameters.
Design:
Observational, cross-sectional study.
Materials and Methods:
The eyes of 105 healthy patients aged between 20-75 years, with no ocular disease and best corrected visual acuity of 20/20, were scanned using standard scanning protocols by a single examiner. Exclusion criteria included glaucoma, retinal diseases, diabetes, history of prior intraocular surgery or laser treatment. The mean macular and RNFL thickness were recorded, and the effects of age, gender, and refraction on these parameters were evaluated. This data was compared with published literature on Caucasians to assess the ethnic variations of these parameters.
Results:
The normal central foveal thickness in healthy Indian eyes measured using Spectralis OCT was 260.1 ± 18.19 μm. The nasal inner quadrant showed maximum retinal thickness (338.88 ± 18.17 μm). The mean RNFL thickness was 101.43 ± 8.63 μm with maximum thickness in the inferior quadrant. The central foveal thickness showed a gender-based difference (P = 0.005) but did not correlate significantly with age (P = 0.134), whereas the parafoveal, perifoveal thickness, macular volume, and RNFL thickness showed significant negative correlation with age.
Conclusions:
Our study provides the normative database for Indians on Spectralis OCT. It also suggests that age should be considered while interpreting the macular thickness and RNFL, whereas gender should also be given consideration in central foveal thickness.
Keywords: Ethnicity, Indian, macular thickness, normative, retinal nerve fiber layer
Optical coherence tomography (OCT) is a non-invasive test that can provide precise measurements of macular and retinal nerve fiber layer thickness in vivo. The spectral domain OCT (SD-OCT) has now superseded time-domain OCT in most parts of the world. Several reports suggest that the macular and retinal nerve fiber thickness vary between ethnic groups.[1] Therefore, data documenting normal macular and nerve fiber measurements and variations associated with demographic and ocular variables in healthy Indian subjects on Spectralis OCT are imperative to clinicians around the world to help them make informed decisions on pathologic changes in this ethnic group. Normative data on these parameters using Spectralis OCT are available in Caucasians. Although there are few studies that have reported normal macular thickness and variations in the Indian population, to the best of our knowledge, there are no published studies providing data on Spectralis OCT in the Indian population. The objective of this study is to provide normative data of both the macular and nerve fiber thickness in a homogenous South Indian population and to compare these parameters to published normative data on the Caucasian population to better understand the racial differences.
Materials and Methods
This study was an observational, cross-sectional analysis of 210 eyes of 105 normal subjects of South Indian origin (Kerala, South India). All methods adhered to the tenets of the Declaration of Helsinki for research involving human subjects.
Inclusion criteria were subjects aged 20 years or older, with best-corrected visual acuity of 20/20, spherical refraction within ± 5.0 D, and cylinder correction within ± 2.0 D. Eyes with media opacities precluding clinical examination or SD-OCT imaging were excluded.
Exclusion criteria included glaucoma, retinal diseases, diabetes, history of prior intraocular surgery or laser treatment.
All participants underwent a comprehensive ophthalmic examination including review of medical history, visual acuity testing, slit lamp biomicroscopy, intraocular pressure (IOP) measurement by Goldmann applanation tonometry and dilated funduscopic examination. All eyes had an IOP of 21 mm Hg or less with no history of increased IOP and had normal ocular examination results.
SD-OCT examination was performed with the Spectralis (HRA + OCT, Heidelberg Engineering, Germany). All subjects had both the macular and nerve fiber layer scans performed on the same day. Only well-centered images with a signal strength of >20 db were used for analysis.
The RNFL thickness was measured around the disc with 16 averaged consecutive circular B-scans (diameter of 3.5 mm, 768 A-scans); an online tracking system was used to compensate for eye movement. The RNFL thickness (from the inner margin of the internal limiting membrane to the outer margin of the RNFL layer) was automatically segmented using the Spectralis software version. 5.3.3.0).
The OCT volume scan was performed on a 20 × 20 degree cube with 49 Raster lines, each containing 1064 pixels, separated by 120 μ. The high acquisition speed of 40,000 A scans/second avoids artefacts from microsaccades and improves image definition. The automatic eye tracking technology (TruTrack and Tracking laser tomography) maintains fixation on the retina.
Each scan was individually reviewed, and segmentation lines were adjusted to ensure accuracy in both RNFL and macular thickness measurements. Macular thickness was reported in a modified Early Treatment of Diabetic Retinopathy Study macular map with the central subfield 1 mm in diameter and the inner and outer subfields having diameters of 3 mm and 6 mm, respectively [Figs. 1a and b]. The retinal thickness in the inner and outer subfields, the Central Foveal Thickness (CFT), the Center Point Thickness (CPT), and the macular volume were calculated.
Figure 1a.
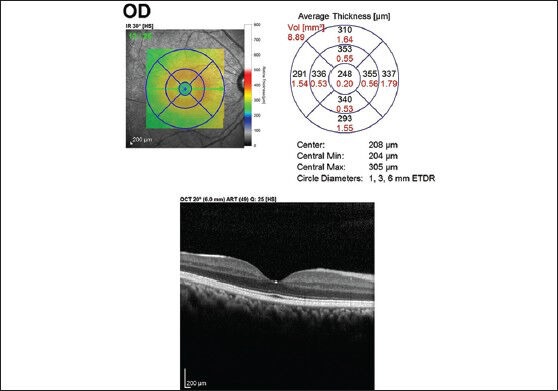
Macular thickness map using ETDRS circles of 1 mm, 3 mm, and 6 mm showing the mean thickness in each of the 9 subfields in a participant
Figure 1b.
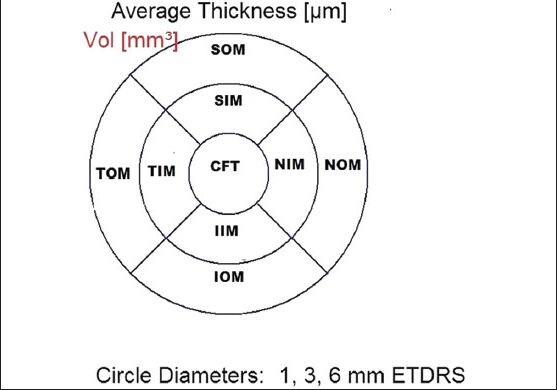
The standard ETDRS subfields dividing the macula into central fovea, inner macula, and outer macula. CFT: Central foveal thickness, SIM: Superior inner macula, NIM: Nasal inner macula, IIM: Inferior inner macula, TIM: Temporal inner macula, SOM: Superior outer macula, NOM: Nasal outer macula, IOM: Inferior outer macula, TOM: Temporal outer macula
CPT was defined as average of 6 radial scans centered at the foveola, whereas the CFT was defined as the average of all points within the central 1 mm diameter circle surrounding fixation.
The data collected on RNFL thickness included the RNFL in each sector along with the average RNFL measurements [Figs. 2a and b].
Figure 2a.
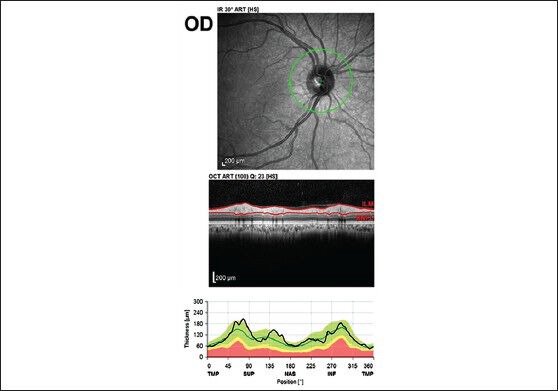
The RNFL thickness analysis (from the inner margin of the internal limiting membrane to the outer margin of the RNFL layer) by automatic segmentation using the spectral is software version (5.3.3.0)
Figure 2b.
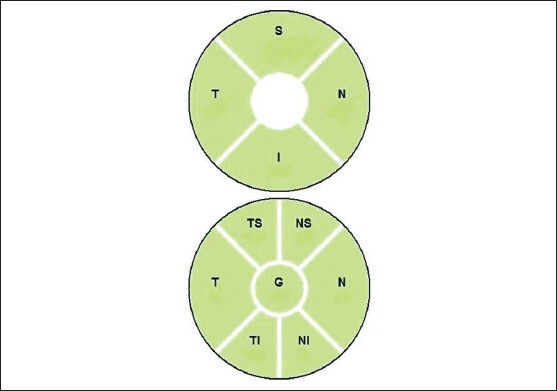
Segmentation of the optic disc into different quadrants. G: Globalaverage, S: Superior, N: Nasal, I: Inferior, T: Temporal, NS: Nasal superior, TS: Temporal, NI: Nasal inferior, TI: Temporal inferior
Both the macular and RNFL parameters were compared with the published Heidelberg normative data on the Caucasian population.
Descriptive statistics included mean ± standard deviation for the normally distributed variables. Linear regression analyzes were done to assess the effects of age and refraction on RNFL and macular parameters measured by SD-OCT. Student t-test was used to compare the effects of gender on the macular thickness. Correlation between refraction and macular thickness and RNFL was analyzed using partial correlation while controlling for age and gender. Statistical analyzes were performed with commercial software (SPSS version. 11.0). The α level (type I error) was set at 0.05.
Results
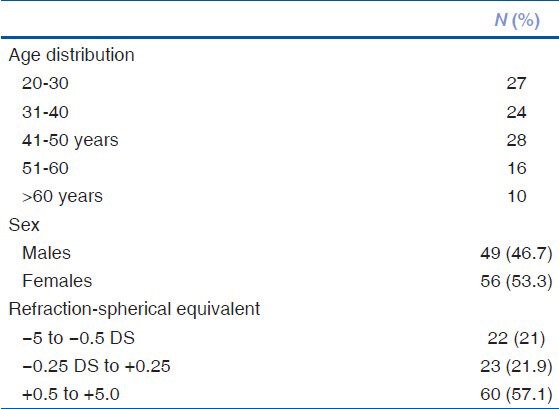
Prospective data on the macular and RNFL of 120 consecutive patients were recorded. However, 15 patients had to be excluded from the final analysis due to poor scan quality <20 db (n = 7), presence of minor retinal pigment epithelial irregularities (n = 3), early epiretinal membrane (n = 1), non-clinically detectable small serous pigment epithelial detachment (n = 1), and poor centration of the ETDRS grid (n = 3). Baseline parameters of the study group have been summarized in Table 1.
Table 1.
Shows the baseline characteristics
Inter-ocular symmetry
The mean center point thickness was 220.96 ± 13.76 μ in the right eye and 219.93 ± 14.37 μ in the left eye. The mean central sub-foveal thickness was 258.86 ± 17.06 μ in the right eye and 258.50 ± 17.78 μ in the left eye. The average retinal thickness was 307.07 ± 14.65 μ in the right eye and 307.90 ± 14.59 μ in the left eye. As the values of the right and left eyes were found to have significant correlation when analyzed statistically (r = 0.924, P = 0.001), the data from only the right eyes were included for the final analysis.
Macular thickness and age-related changes: Overall, the mean central point thickness and the mean central foveal thickness in our study were found to be 220.96 ± 13.76 μm and 260.1 ± 18.19 μm, respectively. The macular thickness was least at the fovea and maximum at the nasal inner macula (338.9 ± 18.17 μm). Amongst the 4 quadrants within both the 3 mm and 6 mm ETDRS circles, the retinal thickness was highest in the nasal quadrant followed by the superior, inferior, and temporal quadrant (P = 0.001) [Table 2].
Table 2.
Macular OCT Parameters in the study group and their comparison with age using linear regression
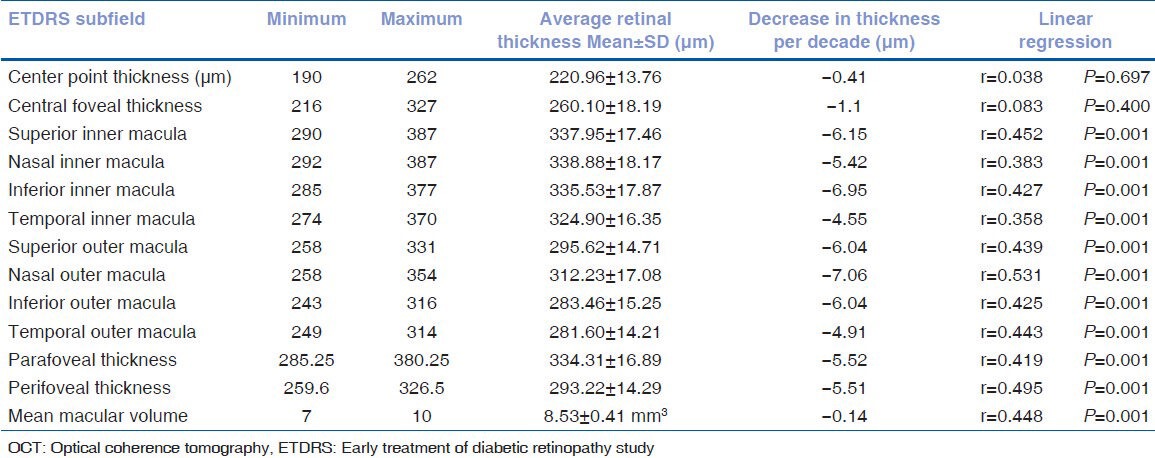
CPT and the CFT did not correlate significantly with age (P = 0.834 and P = 0.134, respectively). However, the parafoveal and perifoveal thickness and macular volume showed a significant negative correlation with age (P = 0.001 for all the parameters) [Table 2].
Retinal nerve fiber layer thickness and the correlation with age: The mean RNFL thickness was 101.43 ± 8.63 μm. The RNFL was thickest in the inferior quadrant (128.34 ± 14.74 μm) followed by superior (125.27 ± 13.72 μm), nasal (79.73 ± 12.05 μm), and temporal quadrants (71.95 ± 7.73 μm) with a P < 0.005.
When analyzed by linear regression, the RNFL thickness showed a significant negative correlation with age (-1.57 μm decline with each increasing decade, P = 0.016) [Table 3].
Table 3.
Analysis of RNFL parameters with age using linear regression

On comparing each of the 4 quadrants with age, a significant decrease was seen only in the superior and inferior quadrant (-2.17 μm and -2.96 μm decline with each increasing decade, P = 0.037 and P = 0.008, respectively), whereas the nasal and temporal quadrants did not show any significance with age (P = 0.071 and P = 0.25, respectively). On assessing the sub-quadrants, the nasal inferior and temporal inferior quadrants showed a significant decline with age.
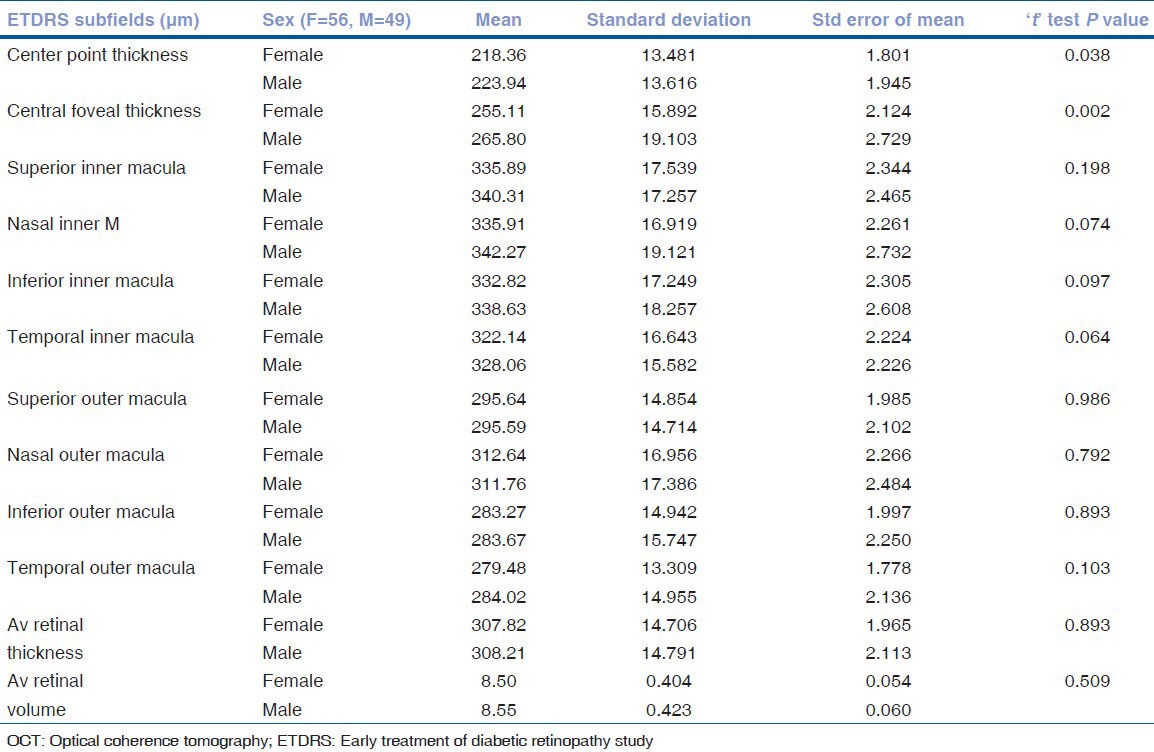
Gender differences in macular and RNFL thickness: Thus, females were found to have a thinner fovea as compared to males (P = 0.002) [Table 4]. However, there were no gender differences in the perifoveal and parafoveal retinal thickness and the RNFL thickness.
Table 4.
Comparison of macular OCT parameters between the genders using the ‘t’ test
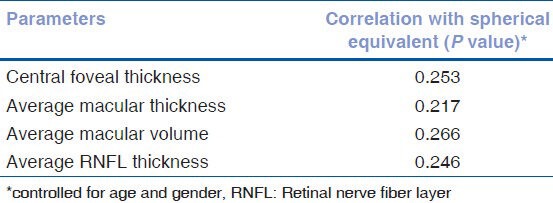
Impact of refractive errors on macular and RNFL thickness: There was no correlation between the spherical equivalent refraction and macular or RNFL thickness (while controlling for factors of age and gender) as shown in Table 5.
Table 5.
Correlation between refraction and retinal thickness and RNFL
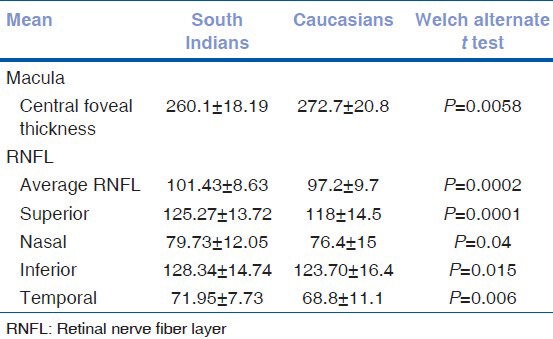
Comparison with normative data on Caucasians: The data from this study was compared to published literature on Caucasians.[1,2] The fovea is thinner in the South Indian population compared to the Caucasians. In contrast, the RNFL is significantly thicker in all sectors in the South Indians compared to Caucasians [Table 6].
Table 6.
Comparison with normative data on caucasians
Discussion
In the present study, the values of the right and left eyes were found to have significant correlation as observed in other studies.[3,4]
The macular thickness was least at the fovea (260.1 ± 18.19 μm). Previous studies on Indian eyes using Stratus OCT by Tewari et al.[5] showed a thinner central foveal thickness of 149.16 ± 21.15 μm. This difference in the measurements is due to the fact that time domain (TD-OCT) measures retinal thickness as the distance between internal limiting membrane (ILM) and the third hyper-reflective band, whereas SD OCT measures the distance between ILM and the retinal pigment epithelium (RPE) resulting in higher SD OCT readings compared to those obtained by TD-OCT.[24] Hence, these factors must be kept in mind while interpreting, and the patient should be followed up on the same machine if possible.
The observed macular thickness parameters of being thinnest at the fovea with an increase in the parafoveal area are consistent with the normal anatomic contour and mirrors previous reports on OCT of the normal macula in the Caucasians.[6,7] Using the criteria of mean ± 2 SDs, which includes 95% of the population, we suggest that 220-300 μm be taken as the normal range for central foveal thickness in the Indian population.
However, the mean central subfield thickness in our Indian cohort was lower than that observed in the Caucasian group reported by Grover et al.[1] The central point thickness and the central foveal thickness did not correlate significantly with age. However, the parafoveal and perifoveal thickness and macular volume showed a significant negative correlation with age. The negative correlation between age and macular thickness in our study was consistent with the study by Kanai et al.[6] and Manassakorn et al.[8] that showed significant association between age and macular thickness in all ETDRS areas, except the center. This decline in the retinal thickness with age is supported by histologic decrease in the density of photoreceptors, ganglion cells, and retinal pigment epithelial cells with age.[9,10] In contrast, the studies by Grover et al.[1] and Huang et al.[11] using Spectralis, failed to show a statistically significant association between retinal thickness and age, which may be due to the small sample size and the age distribution.
Our study showed that men had greater central foveal thickness as compared to women (P = 0.002). In the study by Tewari et al.[5] and Grover et al.,[1] no significant difference was seen in the average foveal thickness and minimum foveal thickness in men and women. However, other similar studies by Song et al.,[12] Wong et al.,[13] and Massin et al.[14] found males to have significantly higher average retinal thickness as compared to females. The presence of thinner foveas in females could probably explain the higher incidence of macular holes seen in them.
Refraction was not found to have any significant effect on macular thickness, and this was similar to the studies by Tewari et al.,[5] and Massin et al.[14] Lim et al.[15] in their study on myopes found that myopes had thinner parafovea and thicker foveas.
The average RNFL thickness in our study was similar to previous studies done on Indian eyes by Ramakrishnan et al.[16] on Stratus OCT 3000 (104.8 ± 38.81 μm) and Sony et al.[17] on OCT 3 (104.27 ± 8.5 μm). The study done by Rao et al.[18] using different Spectral OCT (RTVue) showed an average thickness of 108 μm.
The present study showed maximum RNFL thickness in the inferior quadrant followed by superior, nasal, and temporal supporting the ISNT rule by Jonas et al.[19] and was consistent with other similar studies.[2,8] Sony et al. found inferior thickness to be more than superior though it was not statistically significant.[17] On the contrary, Ramakrishnan et al. showed the thickness of superior quadrant to be more than the inferior.[16]
Our population showed a decline of 1.57 μm/decade, which was less than that observed in Caucasian population (1.90 μm/decade)[2] and a Thai population that showed a decline at the rate of 2.3 μm/decade.[8] Decline in RNFL thickness owing to loss of ganglion cells with age has been proven in the previous OCT[20,21] and histopathological studies.[22] Gender did not have any influence on the RNFL values as noted in other studies in Indian population.[16,17,18]
Refraction was not found to have any significant effect on RNFL. Bendschneider et al.[2] found significant association between axial length, refractive error, and RNFL thickness, whereas Sony et al.[17] did not find any correlation between refractive error and RNFL measurements.
On comparing our RNFL data with that of Caucasians,[2,23] Indians have significantly thicker RNFL than Caucasians.
In conclusion, knowledge of the macular thickness and retinal nerve fiber layer thickness on Spectralis in a normal Indian population is important for the evaluation of pathological change in this ethnic group. Age should be considered while interpreting the macular thickness and RNFL, whereas gender should also be given consideration in foveal thickness.
Footnotes
Source of Support: Nil.
Conflict of Interest: None declared.
References
- 1.Grover S, Murthy RK, Brar VS, Chalam KV. Normative data for macular thickness by high-definition spectral domain optical coherence tomography (Spectralis) Am J Ophthalmol. 2009;148:266–71. doi: 10.1016/j.ajo.2009.03.006. [DOI] [PubMed] [Google Scholar]
- 2.Bendschneider D, Tornow RP, Horn FK, Laemmer R, Roessler CW, Juenemann AG, et al. Retinal nerve fibre layer thickness in normals measured by spectral domain OCT. J Glaucoma. 2010;19:475–82. doi: 10.1097/IJG.0b013e3181c4b0c7. [DOI] [PubMed] [Google Scholar]
- 3.El-Ashry M, Hegde V, James P, Pagliarini S. Analysis of macular thickness in British population using optical coherence tomography: An emphasis on interocular symmetry. Curr Eye Res. 2008;33:693–9. doi: 10.1080/02713680802323140. [DOI] [PubMed] [Google Scholar]
- 4.Huynh SC, Wang XY, Burlutsky G, Mitchell P. Symmetry of optical coherence tomography retinal measurements in young children. Am J Ophthalmol. 2007;143:518–20. doi: 10.1016/j.ajo.2006.09.050. [DOI] [PubMed] [Google Scholar]
- 5.Tewari HK, Wagh VB, Sony P, Venkatesh P, Singh R. Macular thickness evaluation using the optical coherence tomography in normal Indian eyes. Indian J Ophthalmol. 2004;52:199–204. [PubMed] [Google Scholar]
- 6.Kanai K, Abe T, Murayama K, Yoneya S. Retinal thickness and changes with age. Nippon Ganka Gakkai Zasshi. 2002;106:162–5. [PubMed] [Google Scholar]
- 7.Chan A, Duker JS, Ko TH, Fujimoto JG, Schuman JS. Normal macular thickness measurements in healthy eyes using Stratus optical coherence tomography. Arch Ophthalmol. 2006;124:193–8. doi: 10.1001/archopht.124.2.193. [DOI] [PMC free article] [PubMed] [Google Scholar]
- 8.Manassakorn A, Chaidaroon W, Ausayakhun S, Aupapong S, Wattananikorn S. Normative database of retinal nerve fiber layer and macular retinal thickness in a Thai population. Jpn J Ophthalmol. 2008;52:450–6. doi: 10.1007/s10384-008-0538-6. [DOI] [PubMed] [Google Scholar]
- 9.Panda-Jonas S, Jonas JB, Jakobczyk-Zmija M. Retinal photoreceptor density decreases with age. Ophthalmol. 1995;102:1853–9. doi: 10.1016/s0161-6420(95)30784-1. [DOI] [PubMed] [Google Scholar]
- 10.Gao H, Hollyfield JG. Aging of the human retina. Differential loss of neurons and retinal pigment epithelial cells. Invest Ophthalmol Vis Sci. 1992;33:1–17. [PubMed] [Google Scholar]
- 11.Huang J, Liu X, Wu Z, Xiao H, Dustin L, Sadda S. Macular thickness measurements in normal eyes with time-domain and Fourier domain optical coherence tomography. Retina. 2009;29:980–7. doi: 10.1097/IAE.0b013e3181a2c1a7. [DOI] [PMC free article] [PubMed] [Google Scholar]
- 12.Song WK, Lee SC, Lee ES, Kim CY, Kim SS. Macular thickness variations with sex, age, and axial length in healthy subjects: A spectral domain-optical coherence tomography study. Invest Ophthalmol Vis Sci. 2010;51:3913–18. doi: 10.1167/iovs.09-4189. [DOI] [PubMed] [Google Scholar]
- 13.Wong AC, Chan CW, Hui SP. Relationship of gender, body mass index and axial length with central retinal thickness using optical coherence tomography. Eye. 2005;19:292–7. doi: 10.1038/sj.eye.6701466. [DOI] [PubMed] [Google Scholar]
- 14.Massin P, Erginay A, Haouchine B, Mehidi AB, Paques M, Gaudric A. Retinal thickness in healthy and diabetic subjects measured using optical coherence tomography mapping software. Eur J Ophthalmol. 2002;12:102–8. doi: 10.1177/112067210201200205. [DOI] [PubMed] [Google Scholar]
- 15.Lim MC, Hoh ST, Foster PJ, Lim TH, Chew SJ, Seah SK, et al. Use of optical coherence tomography to assess variations in macular retinal thickness in myopia. Invest Ophthalmol Vis Sci. 2005;46:974–8. doi: 10.1167/iovs.04-0828. [DOI] [PubMed] [Google Scholar]
- 16.Ramakrishnan R, Mittal S, Ambatkar S, Kader MA. Retinal nerve fibre layer thickness measurements in normal Indian population by optical coherence tomography. Indian J Ophthalmol. 2006;54:11–5. doi: 10.4103/0301-4738.21608. [DOI] [PubMed] [Google Scholar]
- 17.Sony P, Sihota R, Tewari HK, Venkatesh P, Singh R. Quantification of the retinal nerve fibre layer thickness in normal Indian eyes with optical coherence tomography. Indian J Ophthalmol. 2004;52:303–9. [PubMed] [Google Scholar]
- 18.Rao HL, Kumar AU, Babu JG, Kumar A, Senthil S, Garudadri CS. Predictors of normal optic nerve head, retinal nerve fiber layer, and macular parameters measured by spectral domain optical coherence tomography. Invest Ophthalmol Vis Sci. 2011;52:1103–10. doi: 10.1167/iovs.10-5997. [DOI] [PubMed] [Google Scholar]
- 19.Jonas JB, Budde WM, Panda-Joans S. Ophthalmoscopic evaluation of the optic nerve head. Surv Ophthalmol. 1999;43:293–320. doi: 10.1016/s0039-6257(98)00049-6. [DOI] [PubMed] [Google Scholar]
- 20.Alamouti B, Funk J. Retinal thickness decreases with age: An OCT study. Br J Ophthalmol. 2003;87:899–901. doi: 10.1136/bjo.87.7.899. [DOI] [PMC free article] [PubMed] [Google Scholar]
- 21.Kanamori A, Escano MF, Eno A, Nakamura M, Maeda H, Seya R, et al. Evaluation of the effect of aging on retinal nerve fiber layer thickness measured by optical coherence tomography. Ophthalmol. 2003;217:273–8. doi: 10.1159/000070634. [DOI] [PubMed] [Google Scholar]
- 22.Balazsi AG, Rootman J, Drance SM, Schulzer M, Douglas GR. The effect of age on the nerve fiber population of the human optic nerve. Am J Ophthalmol. 1984;97:760–6. doi: 10.1016/0002-9394(84)90509-9. [DOI] [PubMed] [Google Scholar]
- 23.Budenz DL, Anderson DR, Varma R, Schuman J, Cantor L, Savell J, et al. Determinants of normal retinal nerve fiber layer thickness measured by Stratus OCT. Ophthalmol. 2007;114:1046–52. doi: 10.1016/j.ophtha.2006.08.046. [DOI] [PMC free article] [PubMed] [Google Scholar]
- 24.Grover S, Murthy RK, Brar VS, Chalam KV. Comparison of retinal thickness in normal eyes using Stratus and Spectralis Optical Coherence Tomography. Invest Ophthalmol Vis Sci. 2010;51:2644–47. doi: 10.1167/iovs.09-4774. [DOI] [PubMed] [Google Scholar]


