Abstract
Real-time ultrasound-based targeted molecular imaging in large blood vessels holds promise for early detection and diagnosis of stroke risk by identifying early markers for atherosclerosis prior to plaque formation. Singular spectrum-based targeted molecular (SiSTM) imaging is a recently proposed method that uses changes in statistical dimensionality—quantified by a normalized singular spectrum area (NSSA)—to image receptor-ligand–bound adherent microbubbles. However, the precise physical mechanism responsible for the distinct statistical signature was previously unknown. In this study, in vitro flow phantom experiments were performed to elucidate the physical mechanism in large blood vessel environments. In the absence of flow, an increase in the NSSA of adherent microbubbles with respect to tissue was not observed with increased microbubble concentration or pulse length (p > .23; n = 5) but was observed with increased flow rate (p < .01; n = 10). When observing the dynamics of the adherent microbubble statistics, a good correlation was observed between the NSSA and the derivative of image intensity (R2 > .97). In addition, a monotonic relationship between the NSSA and decorrelation was demonstrated. These findings confirm the hypothesis that the statistical signature of adherent microbubbles is derived from frame-to-frame decorrelation, which is induced by flow shear forces.
In the United States, stroke is the third leading cause of death and a leading cause of serious, long-term disability.1 Current diagnosis for carotid atherosclerosis is performed using anatomically based imaging modalities that can provide a positive diagnosis only once a well-developed plaque is present.2–5 Rather than waiting for anatomic changes and symptomatic events, early detection and diagnosis of atherosclerosis may provide compelling evidence for patients to instigate lifestyle changes (eg, diet or exercise). Ultrasound-based targeted molecular imaging has been demonstrated as an alternative to anatomically based imaging modalities.6–18 Rather than imaging tissue structures, molecular imaging attempts to detect and locate molecular markers that are specific to selected pathologies. In ultrasound-based targeted molecular imaging, microbubbles that attach to receptors on the endothelium through a specific ligand-receptor bond (ie, adherent microbubbles) provide an enhanced ultrasound echo signal indicating the presence of specific molecular markers on the vessel wall. To increase the targeting efficiency of microbubbles, acoustic radiation force is frequently applied to achieve enhanced microbubble adhesion to the vessel wall.19–23
In real-time ultrasound-based targeted molecular imaging, one central technical challenge of this technique is the isolation of echo signal derived from ligand-receptor–bound adherent microbubbles. Current methods for separating signals arising from molecularly bound adherent microbubbles, versus tissue and freely circulating microbubbles, are primarily designed for small vessels and generally rely on frequency domain filtering schemes.24–28 For example, Gessner and colleagues achieved high contrast to tissue ratio imaging using a dual-frequency transducer.24 Needles and colleagues detected targeted microbubbles in real time using subharmonic imaging and interframe filtering in small vessels.25 The imaging strategy demonstrated by Hu and colleagues consisted of harmonic imaging and slow-time filtering with a wideband customized transducer to enhance sensitivity.26 In addition, Patil and colleagues demonstrated molecular imaging in large vessels in vitro and ex vivo using the combination of pulse inversion and a slow-time averaging strategy.27,28 In each method, the elimination of tissue signal is attempted by first using nonlinear extraction methods (eg, pulse inversion or harmonic imaging) applied in the fast-time (ie, sample to sample through depth) dimension. Thereafter, elimination of signals associated with freely circulating microbubbles is attempted using a low-pass filter through the slow-time (ie, frame to frame) dimension. In principle, this results in isolation of the adherent microbubble signal.
Although these techniques have demonstrated efficacy in some environments, they face challenges when attempted in real time in large vessels due to limitations that result from the following assumptions.24–28 First, it is assumed that harmonic signals resulting from nonlinear response are predominantly generated by microbubbles rather than from tissue. Second, adherent microbubbles are assumed to possess the identical slow-time frequency characteristics with tissue. A primary concern in large vessels is the hyperechoic, and predominantly specular, nature of reflections originating from the tissue/blood interface associated with vessel walls. The echoes from the vessel walls can be much brighter than the echoes from surrounding tissue; therefore, the absolute amplitude of harmonics generated from the vessel walls can compare to those generated from microbubbles. Hence, in reality, the first assumption listed may not always apply in large vessels. As a result, because the second set of frequency filters uses the same assumed slow-time characteristics for adherent microbubbles as for the vessel wall, any remaining vessel wall signal from the nonlinear fast-time filter will appear as false-positive signal in the final image. Consequently, interimage specificity (ie, classification of adherent microbubbles from tissue or freely circulating microbubbles) is diminished due to false positives derived from a bright vessel wall.29
Although the aforementioned frequency-based separation methods assume that the same slow-time properties apply to both adherent microbubbles and tissue, a recent study has determined that slow-time statistical properties are different for adherent microbubbles and tissue.29 Thus, there is an additional source of separation that can increase signal separation performance. Instead of relying on frequency domain–based filtering, singular spectrum-based targeted molecular (SiSTM) imaging is a recently proposed technique that isolates the adherent microbubble signal using changes in statistical dimensionality.29,30 In SiSTM imaging, the statistical dimensionality is quantified by performing a singular value decomposition over local regions of complex acoustic echo data and calculating the normalized singular value spectrum area (NSSA).30 Briefly, for a sample of interest (α) in one image frame, a matrix X (M × N) representing the windowed region surrounding α is formed, where M is the number of surrounding samples in depth and N is the number of image frames within the filter window. Then singular value decomposition is calculated:
| (1) |
where U is the matrix with left singular vectors, V is the matrix with right singular vectors, and Σ is the diagonal matrix with singular value spectrum. The shape of singular value spectrum provides information on the statistical dimensionality of matrix X, where flat spectra suggest high dimensionality and steep spectra suggest low dimensionality.31 Hence, to parameterize the shape of the singular value spectra, NSSA is defined29,30:
| (2) |
where Σ[k,k] and Σ[1,1] are the kth and first singular value from matrix Σ. Thus, high NSSA values represent high dimensionality and low NSSA values represent low dimensionality.
It was discovered experimentally in large vessels that the NSSA signature of adherent microbubbles is repeatable and distinct from the signature from tissue or freely circulating microbubbles.29 In SiSTM imaging, delineation of the three signal sources (tissue, freely circulating, and adherent microbubbles) was obtained by NSSA domain filtering. Consequently, in a preliminary in vitro study, SiSTM imaging was demonstrated to increase contrast, sensitivity, and specificity compared to alternative techniques based on frequency domain separation.29 Although efficacy is demonstrated in SiSTM imaging, the physical mechanism responsible for the distinct statistical signature of adherent microbubbles has not been discovered. The aim of this study is to elucidate the physical mechanism behind this distinct statistical signature using a series of controlled experiments. In vitro flow phantom experiments were performed to isolate the effects of microbubble concentration, secondary acoustic radiation force, and flow shear force. The NSSA values of adherent microbubbles were calculated to determine the actual physical source.
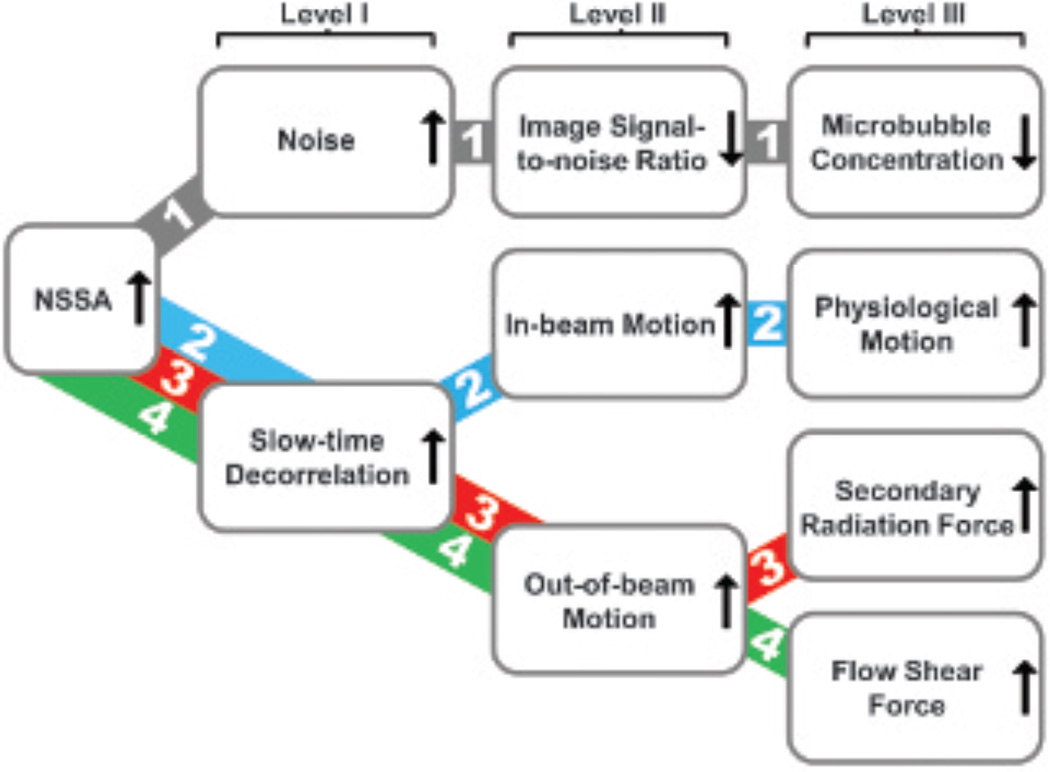
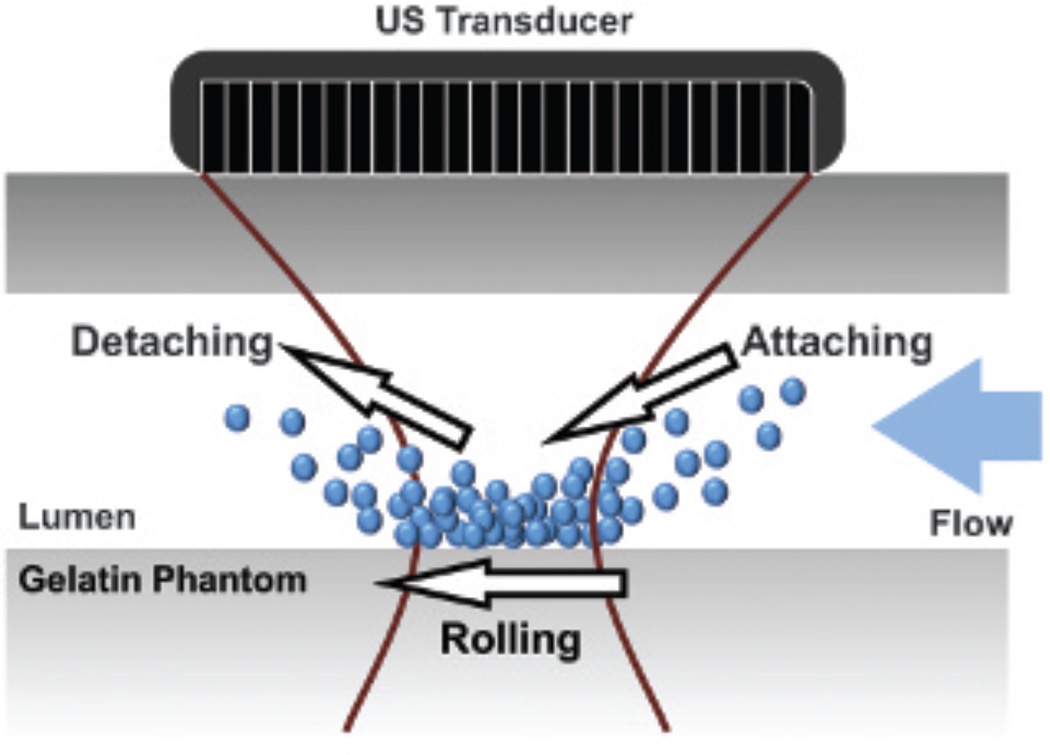
To elucidate the physical mechanism responsible for the NSSA signature of adherent microbubbles, a framework for possible mechanisms was constructed and tested systematically. Figure 1 illustrates the possible physical sources and corresponding mechanism pathways that might result in an increase in NSSA values of adherent microbubbles relative to tissue. It was demonstrated by Mauldin and colleagues that statistical dimensionality, and thus NSSA values, of echo data under typical medical imaging conditions were a function of signal to noise ratio (SNR) and scatterer motion (axially along the beam and perpendicularly out of beam).30 In the first mechanism pathway, decreased microbubble concentration resulted in lower image signal with the same noise level and, consequently, a decreased SNR. A higher relative level of noise caused more randomness in the echo data and, therefore, a higher NSSA value. In the second mechanism pathway, physiologic motion along the beam direction (eg, vessel wall contraction and relaxation) caused the underlying scatterers (ie, adherent microbubbles) to translate axially along the beam. Thus, this motion along the acoustic beam between frames resulted in frame-to-frame echoes that were perfect replicas of one another but shifted.32–34 As a result, slow-time decorrelation increased along with NSSA values (see Figure 1, pathway 2). In the third mechanism pathway, secondary acoustic radiation force, an attraction/repulsion force between neighboring microbubbles, produced a reversible attraction and aggregation of microbubbles longitudinally.35,36 Hence, scatterers moved differentially with respect to one another, potentially causing frame-to-frame echoes that were different in phase and amplitude,32–34 thereby leading to increased slow-time decorrelation and higher NSSA values (see Figure 1, pathway 3). In the fourth mechanism pathway, flow shear forces acted on the adherent microbubbles from the surrounding fluid and caused the out-of-beam motion of scatterers, which resulted in slow-time decorrelation (see Figure 1, pathway 4). More specifically, the influence of flow shear forces can be explained by a combination of two specific mechanisms. First, adherent microbubbles dynamically aggregate along the wall as shear forces bring new microbubbles into contact with the wall. Simultaneously, microbubbles detach from the wall as shear forces overwhelm the molecular forces that caused microbubble adhesion. Second, adherent microbubbles adhere to the vessel wall but simultaneously roll along the wall (Figure 2).11,37,38 For either specific mechanism, flow shear forces change the number and position of scatterers under the point spread function between subsequent frames, which results in decorrelation and an increased NSSA value relative to approximately static tissue (eg, vessel wall).
Figure 1.
Possible physical sources and corresponding mechanism pathways responsible for the NSSA signature of adherent microbubbles in SiSTM imaging. Level I shows the statistical sources for increased NSSA values, level II shows the abstract sources, and level III shows the physical sources.
Figure 2.
A schematic diagram showing how flow shear forces change the number and position of adherent microbubbles under ultrasound (US) beam between subsequent image frames.
In this article, we hypothesize that flow shear forces are primarily responsible for the NSSA signature of adherent microbubbles observed in SiSTM imaging. To verify this hypothesis, the effects on the NSSA signature from microbubble concentration, secondary radiation force, and liquid flow rate were examined systematically.
Materials and Methods
Flow Phantom Setups
Flow phantoms were used to mimic both the acoustic and elastic properties of tissue39 and the geometry of large blood vessels in humans.28,29 Fluid channels possessed a cross-sectional diameter of 4.5 mm and were constructed from 6.1% by weight gelatin (Type B, Fisher Scientific, Pittsburgh, PA), 2.2% by weight agar (Acros Organics, Geel, Belgium), and 1.8% by weight graphite (< 20 µm, Sigma-Aldrich, St. Louis, MO) dissolved in water. To obtain targeted fluid channels for specific binding, fluid channels were incubated with 50 µg/mL streptavidin (AnaSpec, Fremont, CA) solution for 3 hours followed by an incubation with 5% bovine serum albumin (Sigma-Aldrich) for 3 hours.29 In this study, each fluid channel was used only once.
Biotinylated lipid shelled microbubbles40 with a mean diameter of approximately 2.2 µm diluted in 0.9% sodium chloride irrigation, USP (Baxter Healthcare Corporation, Deerfield, IL), at concentrations between 0.02 and 2 (× 106 mL−1) were used in these experiments. Experiments were performed by pulling microbubble solution through the fluid channel using a syringe pump (PHD 2000, Harvard Apparatus, Holliston, MA) at flow rates ranging from 5 to 60 mL/min (ie, mean flow velocities ranging from 0.5 to 6.3 cm/s). To maintain consistent microbubble concentration, the solution was slightly agitated using magnetic stirring prior to entering the flow phantom and fresh microbubble solution was prepared every 10 minutes.
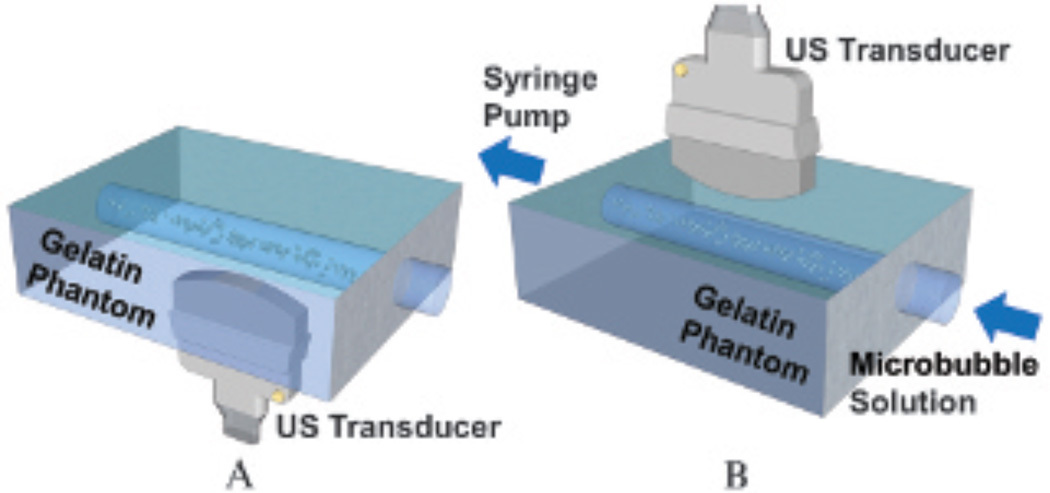
Two types of flow phantom experiments were performed: a static fluid channel and a flowing fluid channel (Figure 3). In static fluid channel experiments, microbubble solution was pulled through the fluid channel for 2 minutes at a flow rate of 20 mL/min (ie, 2.1 cm/s). Acoustic radiation force (beam sequence details are described below) was applied for 2 minutes to increase microbubble adhesion. To eliminate the effects of flow shear forces, the fluid channel was then sealed. Microbubbles were present along the top channel wall due to buoyancy forces after waiting for 1 minute (see Figure 3A). In flowing fluid channel experiments, microbubble solution was pulled through the fluid channel at a fixed flow rate. Adherent microbubbles accumulated along the bottom channel wall through time due to acoustic radiation force and specific binding (see Figure 3B). For both setups, adherent microbubbles were located at the transducer focal distance of 2 cm (top wall in the static fluid channel setup; bottom wall in the flowing fluid channel setup).
Figure 3.
Flow phantom experimental setups. A, Static fluid channel. Microbubbles were pushed via acoustic radiation force and imaged from underneath the phantom. The top channel wall was at the transducer focal depth of 2 cm. B, Flowing fluid channel. Microbubbles were pushed and imaged from top to bottom. The bottom channel wall was at the transducer focal depth of 2 cm. All fluid channels have a diameter of 4.5 mm. US = ultrasound.
Custom Targeted Molecular Imaging Beam Sequences
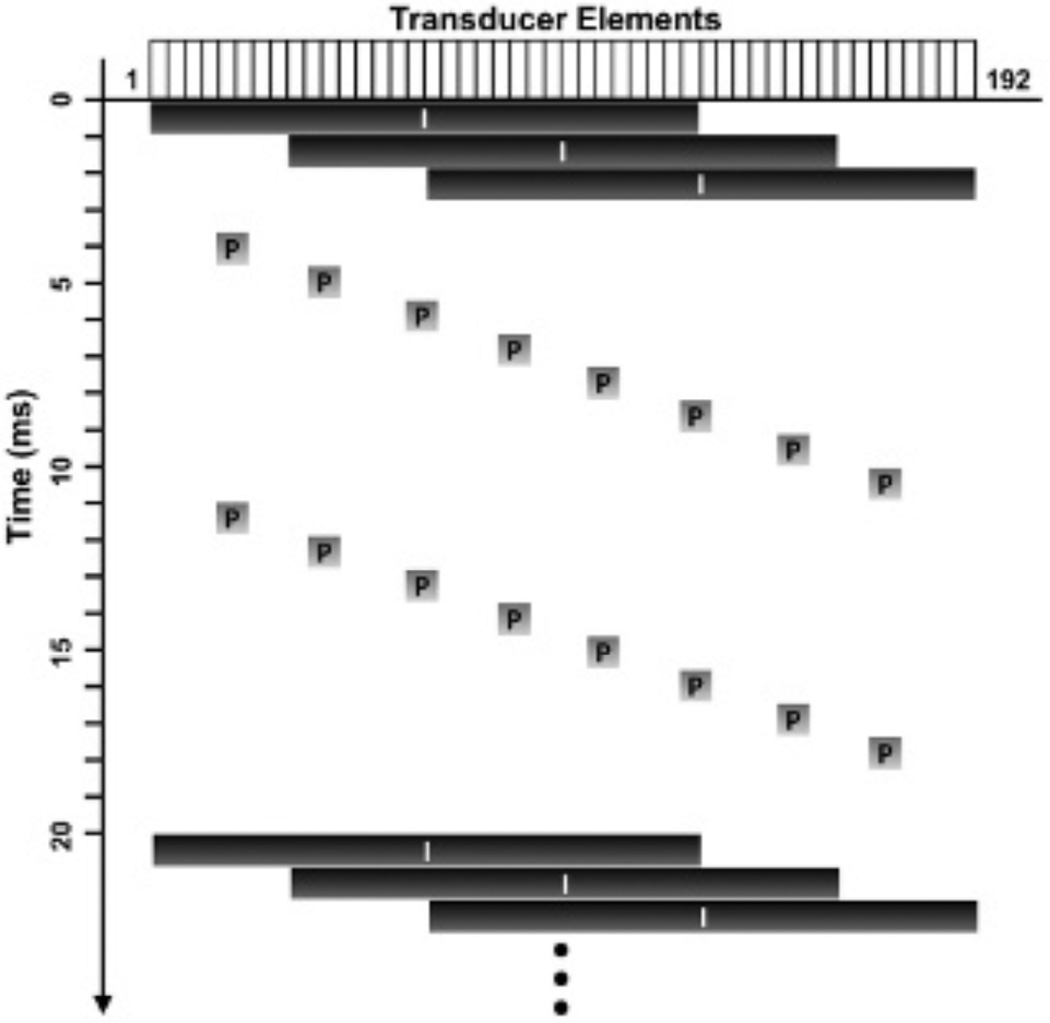
Custom beam sequences, similar to those used in SiSTM imaging,29 were programmed on a Verasonics ultrasound research scanner (Verasonics, Inc., Redmond, WA) using an ATL L12-5 38 mm linear array transducer (Philips Healthcare, Andover, MA). A series of three plane wave imaging pulses were evenly interspersed with 16 acoustic radiation force pulses, as illustrated in Figure 4. The acoustic radiation force pulses (Table 1) were used to increase targeted microbubble binding efficiency19–23 along the bottom vessel wall. The acoustic radiation force pulses exhibited a maximum mechanical index of 0.083 by hydrophone measurements and, thus, did not burst the microbubbles. The plane wave imaging pulses (see Table 1) were used for imaging at high frame rates, and standard plane wave dynamic receive focusing method was used to reconstruct focused A-lines. For experiments examining the effects of secondary acoustic radiation force, different levels of secondary radiation force were achieved by changing the pulse length from 4 to 64 cycles. For all other experiments, the same beam sequences were used with an acoustic radiation force pulse length of 64 cycles. All statistics were calculated from the focused acoustic echo data.
Figure 4.
A diagram of the custom beam sequences. The horizontal axis denotes corresponding elements (1 to 192), whereas the vertical axis represents time. Imaging and acoustic radiation force (pushing) pulses (represented with characters I and P, respectively) consisted of plane and focused waves, respectively. The width of the black boxes (I) represents the transducer elements used for plane wave transmit. The gray boxes (P) show the focal points of the corresponding focused pushing pulses.
Table 1.
Acoustic Parameters Used in Various Experiments
| Pulse Type | Details |
|---|---|
| Imaging | Plane wave |
| Center frequency = 4.09 MHz | |
| Pulse length = 1 cycle | |
| Average pulse repetition frequency = 150 Hz | |
| Peak-negative pressure = 159.3 kPa | |
| MI = 0.079 | |
| Acoustic radiation | Focused wave |
| Center frequency = 4.09 MHz | |
| Pulse length = 64 cycles | |
| Average pulse repetition frequency = 800 Hz | |
| Focal distance = 2 cm | |
| Peak-negative pressure = 167.7 kPa | |
| MI = 0.083 |
MI = mechanical index.
Experimental Design Framework
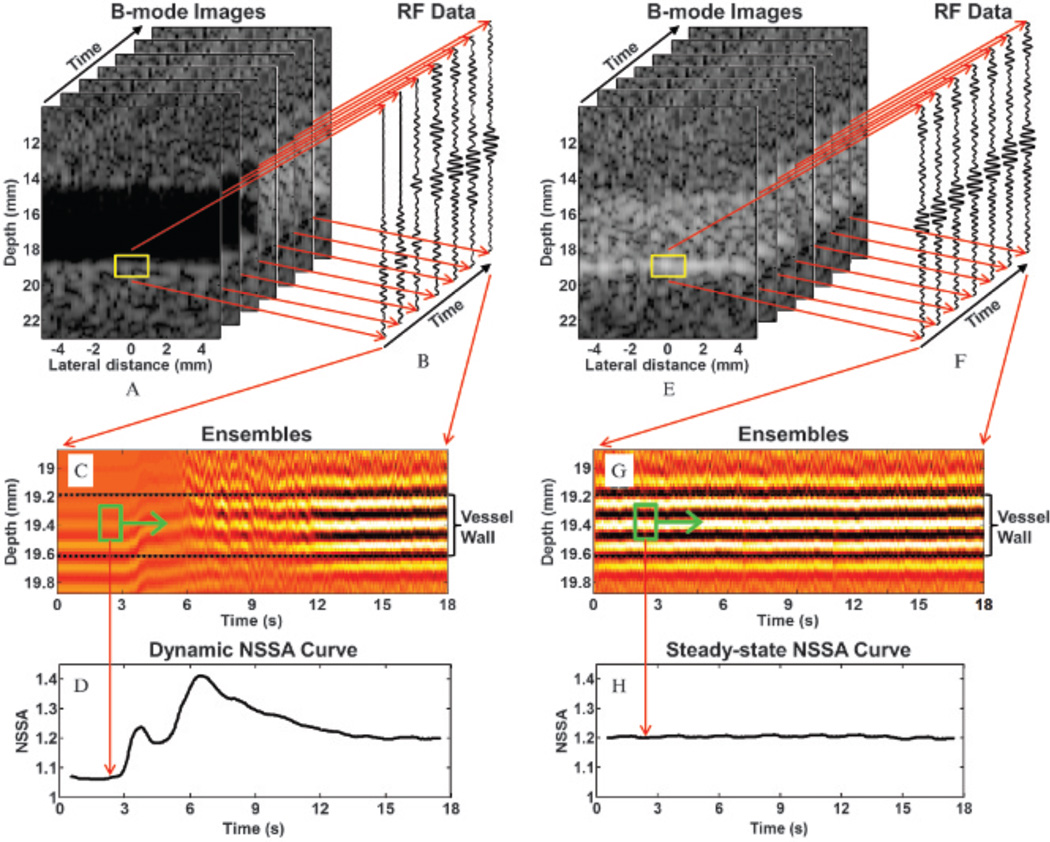
As described above, in the absence of physiologic motion, the three possible physical sources affecting the NSSA signature are microbubble concentration, secondary radiation force, and flow shear forces. Different experiments were designed to examine the possible physical sources and corresponding pathways. Data from the custom beam sequences were collected continuously for 18 seconds at a frame rate of 50 Hz. Quantitative analysis was performed on focused acoustic echo data from 900 consecutive image frames using spatial regions spanning adherent microbubbles (1 mm × 2 mm; Figure 5, A and E, yellow boxes). A representative ensemble of acoustic echo data over all image frames within this region is illustrated in Figure 5, C and G. NSSA values and image intensity were calculated for every frame using the adherent microbubble regions of interest (ROI; described in further detail below). Due to the application of 64-cycle acoustic radiation force pulses, it was known a priori that adherent microbubbles would aggregate along the vessel wall in these setups, as has been confirmed for the same setups by fluorescent microscopy.28,29 NSSA values were calculated using equation 2 from complex radiofrequency data within the ROI. The ROI were located in the center of the vessel wall possessing a depth dimension of 0.2 mm and a temporal width of 1 second (Figure 5, C and G, green boxes).29,30 Both NSSA values and image intensities were calculated from focused A-lines from 10 consecutive laterally spaced image locations with spacing of 0.2 mm. NSSA values and image intensities of the 10 A-lines were then averaged together to decrease the error caused by nonuniform distributions of adherent microbubbles along the vessel wall. To characterize the time course of NSSA values and image intensities, these parameters were computed over 900 image frames, or 18 seconds at a frame rate of 50 Hz. Dynamic NSSA curves were observed using only the flowing fluid channel setup (Figure 5, A to D). Steady-state NSSA curves were observed using both the static fluid channel and flowing fluid channel setups (after reaching steady-state, Figure 5, E to H). Three experiments were designed to examine the possible physical sources and corresponding pathways.
Figure 5.
A depiction of data processing methods used to obtain both dynamic and steady-state NSSA curves. A, A stack of 900 B-mode images from flowing fluid channel experiments with frame rates of 50 Hz. Yellow boxes (1 mm × 2 mm) show a zoomed-in region of the phantom vessel wall. B, Focused acoustic echo data (radiofrequency data) obtained through dynamic receive focusing method of raw acoustic echo data. Each A-line was averaged from 10 consecutive A-lines to decrease the effect of nonuniform distribution of microbubble concentration along the phantom vessel wall. C, Ensembles from the focused acoustic echo data within the yellow boxes in A. Green boxes (0.2 mm × 1 second) show the data used to calculate NSSA value and image intensity. D, Obtained dynamic NSSA curve. E to H are similar to A to D for steady-state NSSA curve.
Experiment Design Testing Effects of Microbubble Concentration
Experiments were designed to test the effects of microbubble concentration on the NSSA signature of adherent microbubbles. Decreasing microbubble concentration resulted in a lower image SNR and higher NSSA values (see Figure 1, pathway 1). To eliminate the effects of motion from adherent microbubbles caused by flow shear forces and buoyancy force, experiments were performed in the static fluid channel setup (see Figure 3A). Microbubble solution with concentrations ranging from 0.02 to 2 (× 106 mL−1) were pulled through the fluid channels with acoustic radiation force applied at a flow rate of 20 mL/min for 2 minutes. After waiting for another minute, image intensity was measured as an indicator of concentration for the static microbubbles along the fluid channel wall. The steady-state NSSA curve was obtained as illustrated in Figure 5H. Five trials of experiments in different fluid channels were repeated.
Experiment Design Testing Effects of Secondary Radiation Force
Experiments were designed to examine the effects of secondary radiation force on the NSSA signature of adherent microbubbles. Secondary radiation force can produce a reversible attraction and aggregation of microbubbles along the vessel wall. This out-of-beam motion of scatterers could result in higher NSSA values (see Figure 1, pathway 3). Given that secondary radiation force is proportional to the pulse duration with a fixed pulse repetition period,35 we used pulse length as an indicator of the intensity of secondary radiation force. The static fluid channel setup (see Figure 3B) was also used to eliminate the effects of flow shear forces and the transient effects of microbubble buoyancy. Microbubble solution with a concentration of 0.5 × 10⁶ mL−1 was pulled through the fluid channel with acoustic radiation force applied at a flow rate of 20 mL/min for 2 minutes. Thus, the initial adherent microbubble concentration was fixed. After waiting for 1 minute, acoustic radiation pulses with pulse lengths ranging from 4 to 64 cycles were applied to static microbubbles inside the fluid channel. Again, the steady-state NSSA curve was obtained as illustrated in Figure 5H. Five trials of experiments in different fluid channels were repeated.
Experiment Design Testing Effects of Flow Shear Forces
Experiments were designed to test the effects of flow shear forces on the NSSA signature of adherent microbubbles. As mentioned above, flow shear forces were expected to induce microbubble motion through different possible mechanisms (attaching, detaching, and rolling).11,37,38 This out-of-beam motion of scatterers was predicted to result in high NSSA values (see Figure 1, pathway 4). Given that the flow shear stress is proportional to the flow velocity, we used flow rate as an indicator of the intensity of flow shear forces.41 The flowing fluid channel setup was used to obtain the dynamic curve of the NSSA. There were no microbubbles in the fluid channel during the first 3 seconds of data acquisition. Thereafter, microbubble solution with concentration of 0.5 × 10⁶ mL−1 was pulled through the fluid channel with acoustic radiation force applied at flow rates ranging from 0 to 60 mL/min (ie, 0 – 6.3 cm/s) for another 15 seconds. Twenty trials of experiments in different fluid channels were repeated. To reach steady-state NSSA, a fixed volume (40 mL) of microbubble solution (0.5 × 10⁶ mL−1) was pulled through the fluid channel at different flow rates. Ten trials of experiments in different fluid channels were repeated.
Results
Effects of Microbubble Concentration
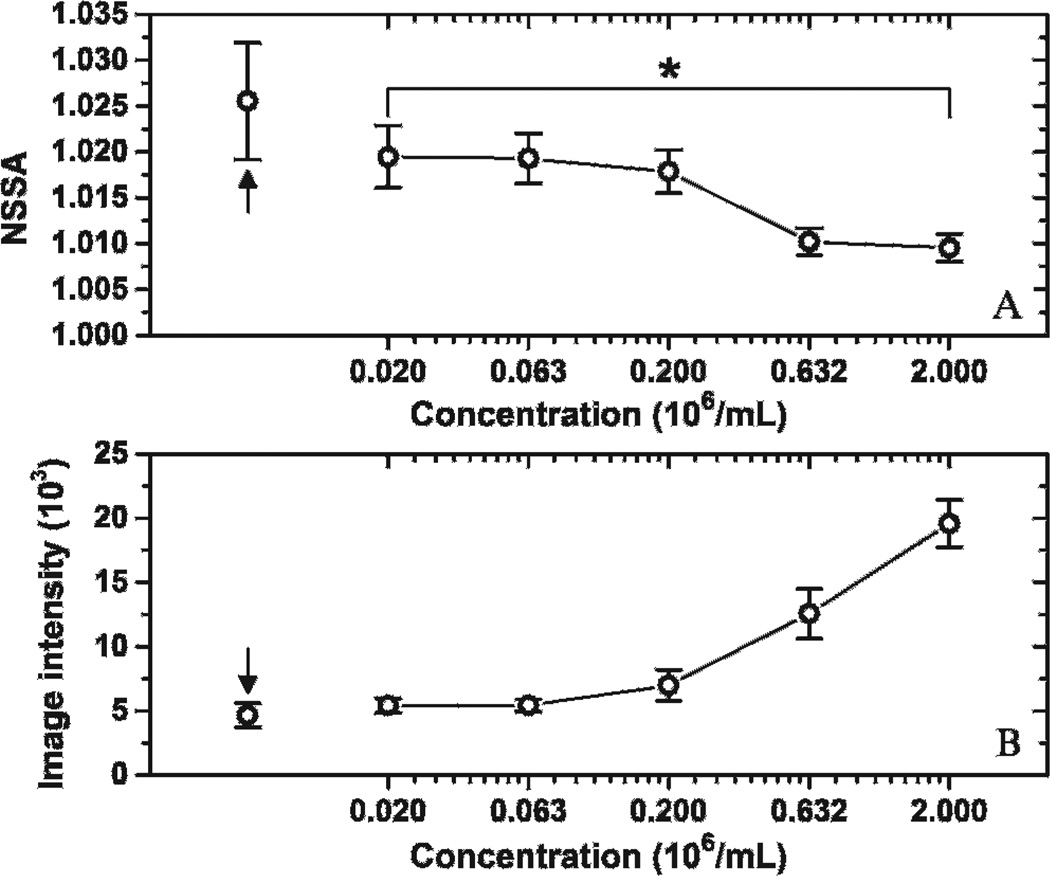
Figure 6 presents the result of experiments designed to examine microbubble concentration as the physical source responsible for the NSSA signature. The NSSA values of adherent microbubbles tended to decrease with microbubble concentration. A significant difference of NSSA values between groups with concentrations of 0.02 and 2 (× 106 mL−1) was demonstrated by a two-tailed Student t-test (p < .018, n = 5; differences were considered significant at p < .05). The control group with no microbubble injection (see Figure 6, black arrows) exhibited higher NSSA values and lower image intensity than other groups with different microbubble concentrations. The NSSA value of the control group was significantly higher than groups with concentrations of 0.63 and 2 (× 106 mL−1), with a maximum p value of .03 (n = 5). In addition, the maximum NSSA value of adherent microbubbles at different concentrations was lower than the vessel wall by itself rather than higher as observed in SiSTM imaging.29
Figure 6.
Effects of microbubble concentration on NSSA value and image intensity of adherent microbubbles. *p < .018. Arrows indicate the control group with no microbubble injection. The results were averaged over five trials. Error bars show the standard deviation of the five trials in different fluid channels.
Effects of Secondary Radiation Force
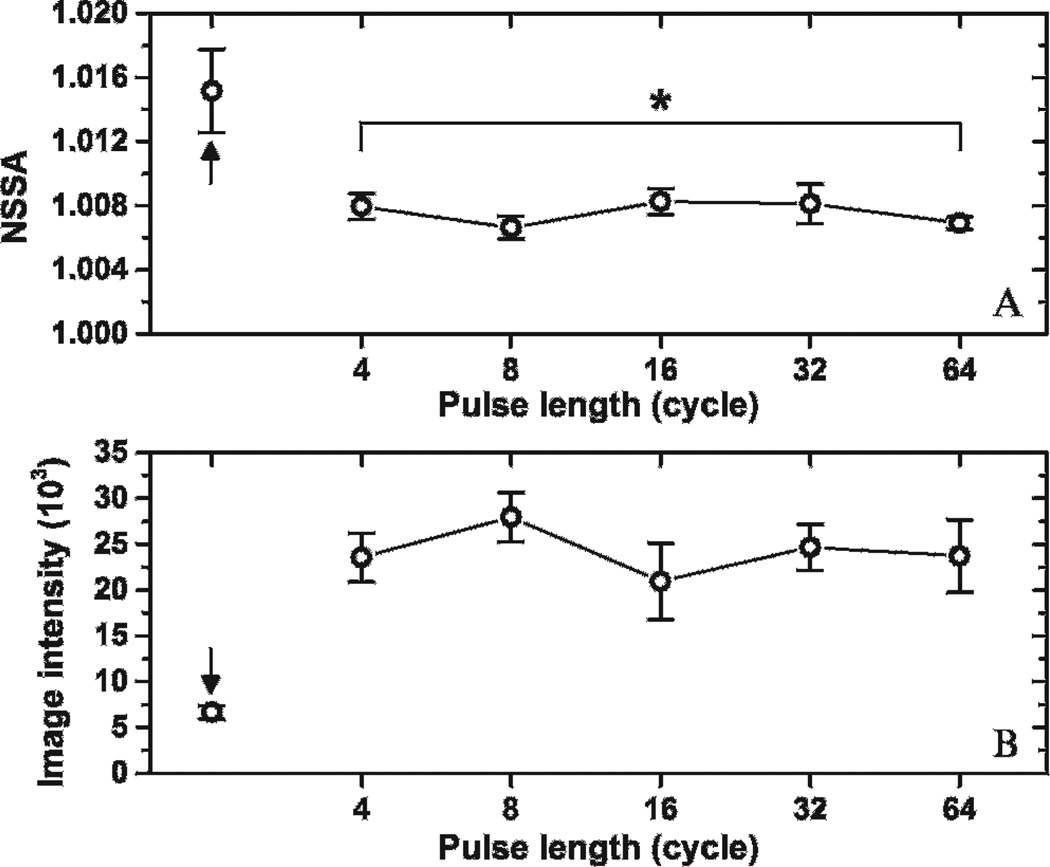
Figure 7 presents the result of the experiments used to verify secondary radiation force as the physical source responsible for the NSSA signature. The control group, with no microbubble injection (see Figure 7, black arrows), exhibited higher NSSA values and lower image intensity than other groups with microbubble injection. The differences in NSSA values between the control group and all other groups were statistically significant, with a maximum p value of .01 (n = 5). Both NSSA values and image intensity were observed to be independent from the pulse length of acoustic radiation force. There was no significant difference in NSSA values between the 4-cycle and 64-cycle groups (p > .23, n = 5). In addition, weighted linear regression was performed between the NSSA value and the corresponding pulse length ranging from 4 to 64 cycles. A regression slope of 0 was found within the 95% confidence interval. Finally, the maximum NSSA value of adherent microbubbles with different pulse lengths was lower than the vessel wall by itself rather than higher, as observed in SiSTM imaging.29
Figure 7.
Effects of secondary radiation force on NSSA value and image intensity of adherent microbubbles. *p > .23. Arrows indicate the control group with no microbubble injection. The results were averaged over five trials. Error bars show the standard deviation of the five trials in different fluid channels.
Effects of Flow Shear Forces: Dynamic NSSA Signature
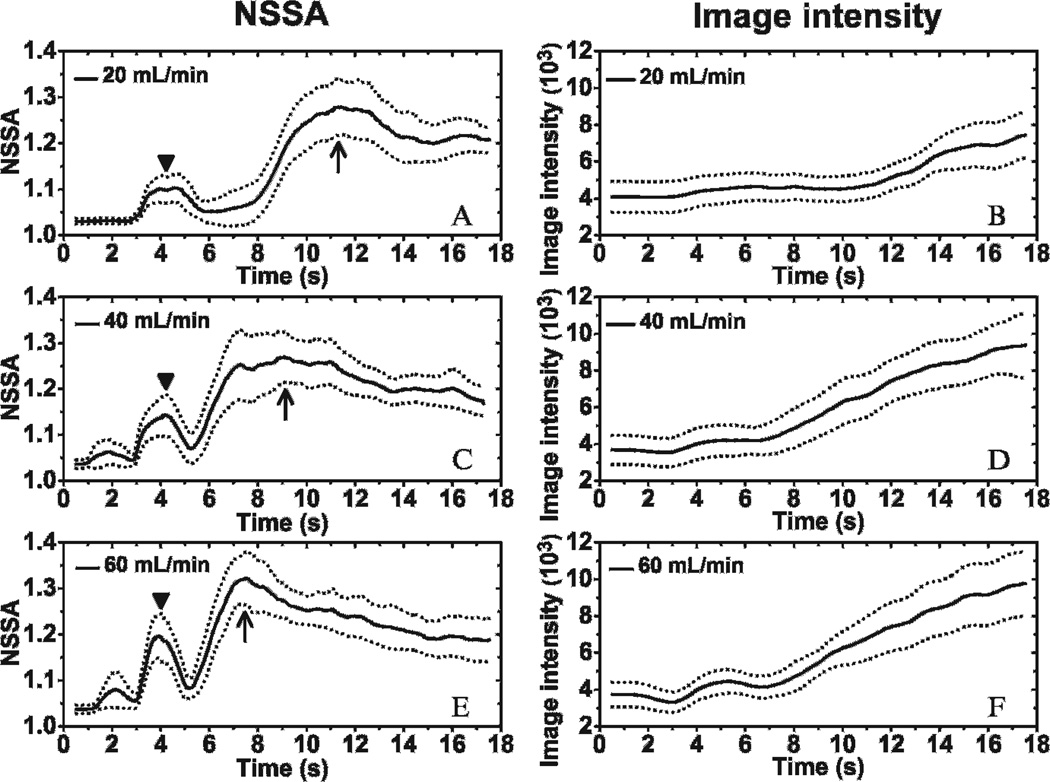
The dynamic NSSA signature and image intensity profiles for different flow rates (20, 40, and 60 mL/min, ie, 2.1, 4.2, and 6.3 cm/s, respectively) are illustrated in Figure 8. Static fluid channels with no microbubble injection were imaged during the first 3 seconds. The NSSA value of the vessel wall by itself was approximately 1.02, which corresponded with the results from a previous study.29 Flow commenced at the 3-second time point with microbubbles injected into the fluid channel. An increase in NSSA value was observed due to wall contraction at approximately 4 seconds. In addition, the peaks of NSSA value caused by wall contraction increased with flow rates. NSSA values began to increase again after 5 seconds and then peaked at a value between 1.25 and 1.32 for different flow rates. During the period from about 5 seconds to the NSSA peak, the image intensity exhibited the largest rate of increase. The time of peak NSSA value was increasingly delayed with lower flow rates, from 7.5 to 11.5 seconds. Eventually, NSSA value achieved steady state after 15 seconds and was observed to be approximately 1.2 for all flow rates tested in these experiments. The difference in NSSA values between adherent microbubbles at 17 seconds and vessel wall was statistically significant (p < 1 × 10⁻⁶, n = 20, for all three different flow rates). The maximum difference in NSSA value between adherent microbubbles at steady state and the vessel wall prior to introduction of microbubbles was approximately 0.17, which, within the variance of the measurement, matches the value (≈ 0.2) previously observed and used to separate signal components of vessel wall and adherent microbubbles in SiSTM imaging.29
Figure 8.
Dynamic curves of NSSA and image intensity of adherent microbubbles with different flow rates. Mean (solid line) and standard deviation (dotted line) of NSSA at flow rates of (A) 20 mL/min (ie, 2.1 cm/s), (C) 40 mL/min (ie, 4.2 cm/s), and (E) 60 mL/min (ie, 6.3 cm/s). Mean (solid line) and standard deviation (dotted line) of image intensity at flow rates of (B) 20 mL/min (ie, 2.1 cm/s), (D) 40 mL/min (ie, 4.2 cm/s), and (F) 60 mL/min (ie, 6.3 cm/s). The syringe pump was started at 3 seconds to pull microbubble solution through the fluid channels. Triangles show the initial peaks in NSSA values caused by wall contraction. Arrows show the maximum peaks of NSSA curves. The microbubble concentration was 0.5 × 10⁶ mL−1. The results were averaged over 20 trials in different fluid channels.
Effects of Flow Shear Forces: Steady-State NSSA Signature
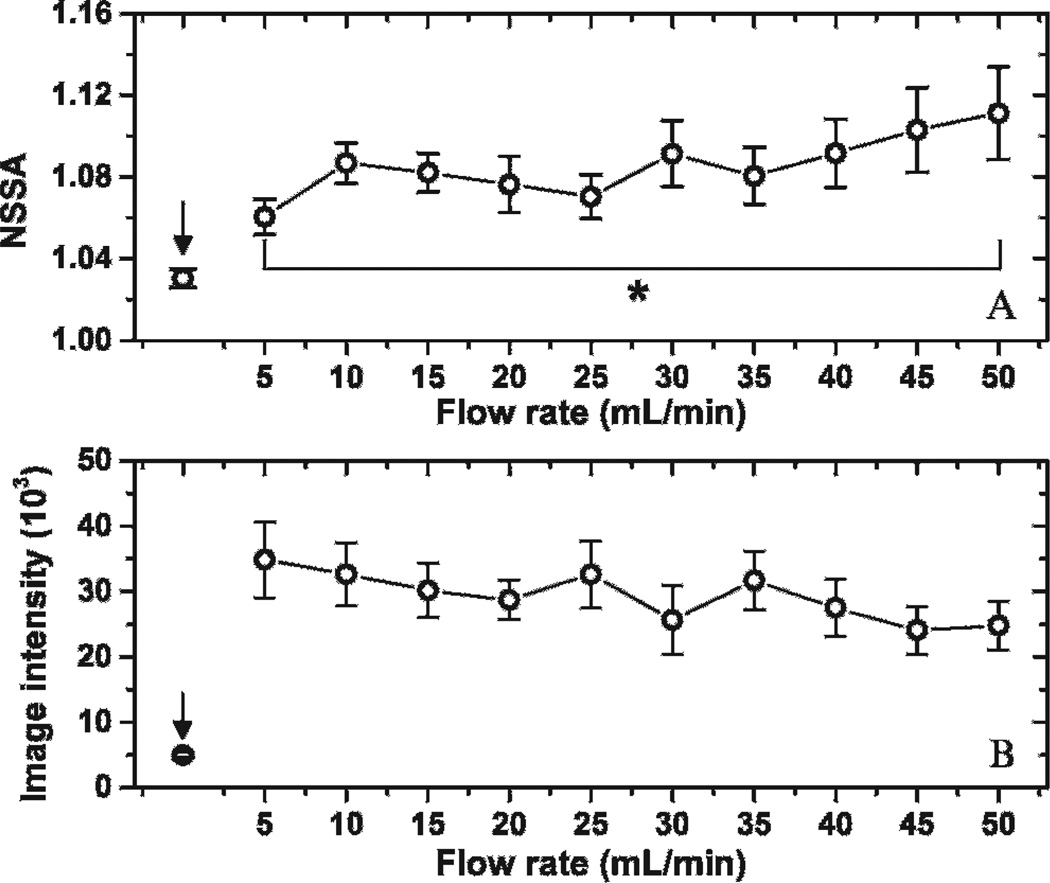
Steady-state NSSA and image intensity profiles for flow rates ranging from 5 to 50 mL/min (ie, 0.5 to 5.3 cm/s) are illustrated in Figure 9. The total amount of microbubbles being pulled through each fluid channel was held constant at approximately 20 × 106. Steady-state NSSA values were observed to increase with flow rate. The difference in NSSA values for adherent microbubbles at flow rates between 5 and 50 mL/min was statistically significant (p < .01, n = 10). In addition, after performing the weighted linear regression between NSSA values and corresponding flow rates ranging from 5 to 50 mL/min, 0 was excluded from the 95% confidence interval of the slope.
Figure 9.
Steady-state NSSA and image intensity of adherent microbubbles with different flow rates. *p < .01. The steady state of adherent microbubbles was obtained by pulling 40 mL microbubble solution with concentration of 0.5 × 10⁶ mL−1 through the fluid channel with acoustic radiation force applied. Arrows showed the control group with no microbubble injection. The results were averaged over 10 trials in different fluid channels.
Relationship between NSSA and Decorrelation
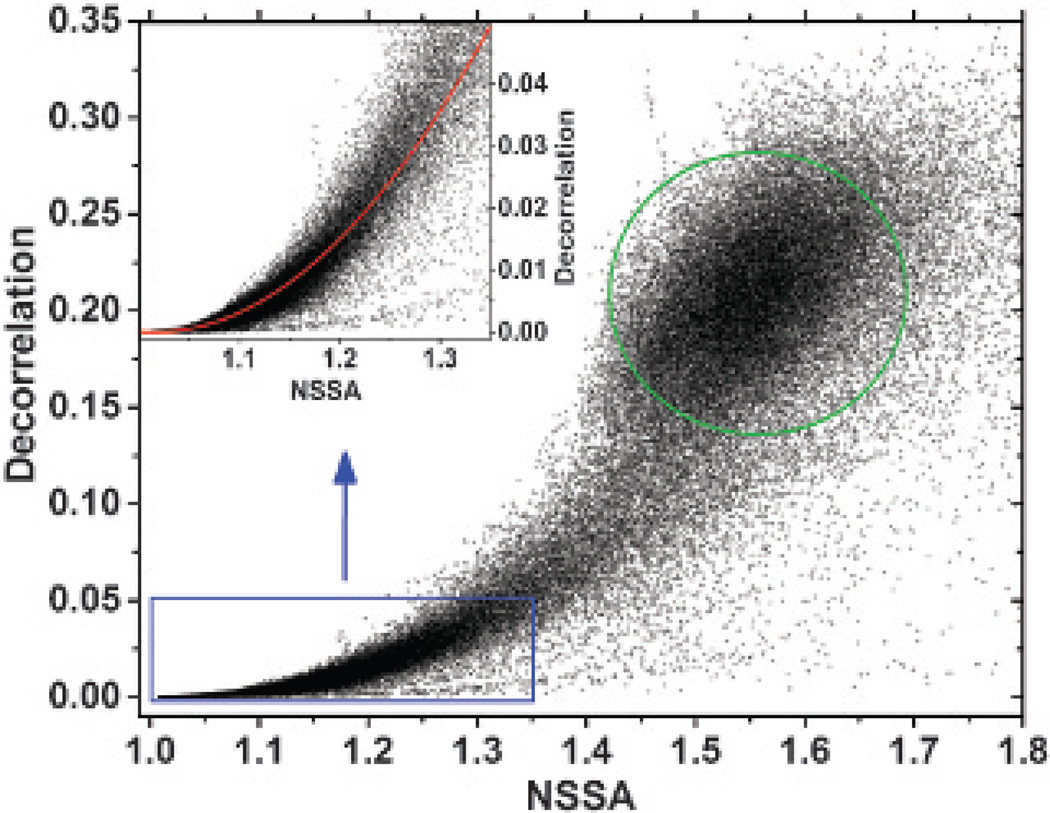
Previous studies have substantiated that increasing NSSA properties of medical ultrasound data are a function of either electronic noise or slow-time in-beam or out-of-beam decorrelation.29,30 To confirm the relationship between decorrelation and NSSA, the values from all source signals (ie, tissue, freely circulating microbubbles, and adherent microbubbles) at a particular time (17 seconds after the beam sequence started, flowing fluid channel setup) and flow rate (40 mL/min) were calculated and compared (Figure 10). Decorrelation was computed using complex data within the ROI as illustrated in Figure 5C. The results showed a clear relationship between decorrelation and the NSSA (approximately quadratic with adjusted R2 of .90 within the typical range of adherent microbubbles; see Figure 10, inset). This approximately quadratic relationship held at a steady state of NSSA profile (after 14 seconds; see Figure 8) and at different flow rates (20, 40, and 60 mL/min) with adjusted R2 values higher than .8. This trend was qualitatively consistent with results in Mauldin and colleagues.30
Figure 10.
Decorrelation versus NSSA of all source signals (ie, tissue, freely circulating microbubbles, and adherent microbubbles) from a dynamic NSSA signature experiment at 17 seconds with a flow rate of 40 mL/min (see Figure 8C). The inset shows the decorrelation-NSSA relationship within the typical range of adherent microbubbles and tissue. The red line is the quadratic fit with an adjusted R2 of .90 within the range of the inset. The green circle shows the typical range of freely circulating microbubbles.
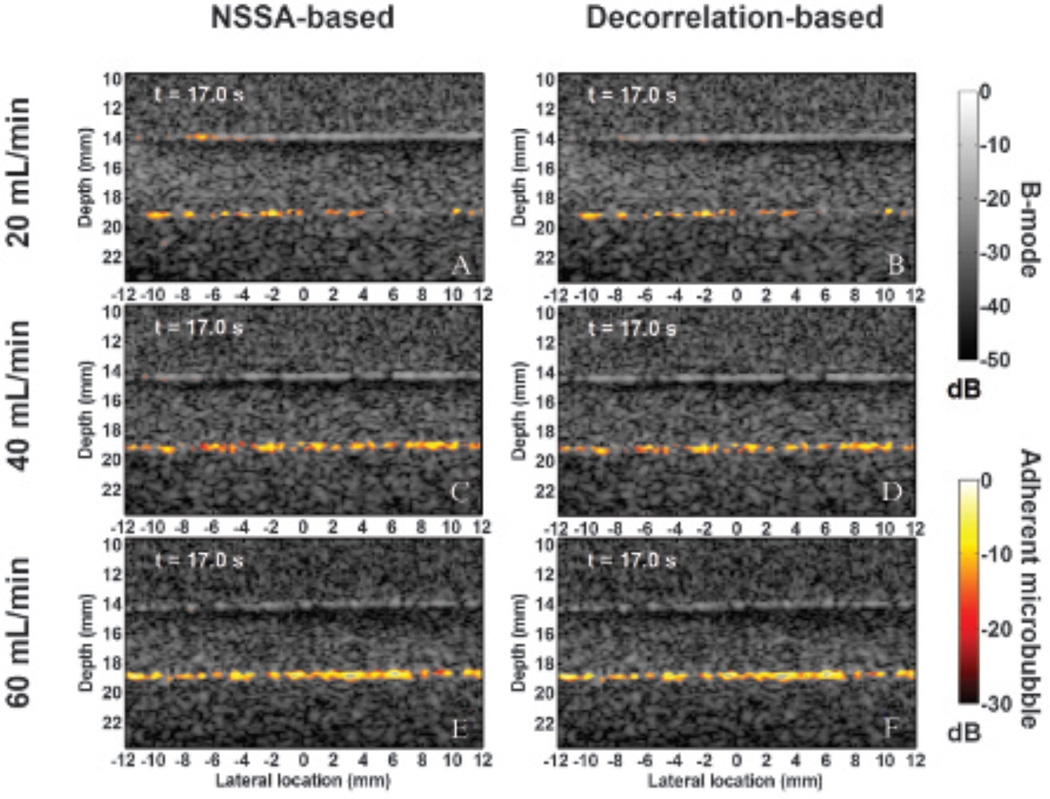
In vitro flow phantom images with color mapping overlays illustrating the location and intensity of adherent microbubbles at 17 seconds after starting the beam sequence are shown in Figure 11. Both NSSA-based SiSTM imaging and decorrelation-based SiSTM imaging were performed on the same data set from different flow rates (20, 40, and 60 mL/min, ie, 2.1, 4.2, and 6.3 cm/s, respectively). As in Mauldin and colleagues,29 a filter window was set about the NSSA values expected for adherent microbubbles (1.04–1.2). For the decorrelation-based approach, the corresponding decorrelation values were 0.007 and 0.015. After NSSA or decorrelation filtering, the output was scaled by the original image intensity and images were log compressed and displayed on a “hot” color mapping overlay at 30 dB dynamic range. NSSA-based and decorrelation-based filtering results were nearly identical at all flow rates, with the maximum difference of adherent microbubble area obtained from the two methods at less than 2%. Consistent with the image intensity data (see Figure 8), a higher image intensity and a larger adherent microbubble area were found at higher flow rates.
Figure 11.
Representative in vitro flow phantom images at 17 seconds after starting the beam sequence. Images were generated using NSSA-based SiSTM imaging at flow rates of (A) 20 mL/min (ie, 2.1 cm/s), (C) 40 mL/min (ie, 4.2 cm/s), and (E) 60 mL/min (ie, 6.3 cm/s). Corresponding decorrelation-based SiSTM imaging images are shown in (B) 20 mL/min (ie, 2.1 cm/s), (D) 40 mL/min (ie, 4.2 cm/s), and (F) 60 mL/min (ie, 6.3 cm/s). The “hot” color mapping is displayed on a 30 dB dynamic range after log compression to illustrate SiSTM-based adherent microbubble signal. The background B-mode images were formed from received acoustic echo data prior to NSSA/decorrelation-based filtering and are displayed on a 50 dB dynamic range after log compression.
Derivative Time Course of Image Intensity
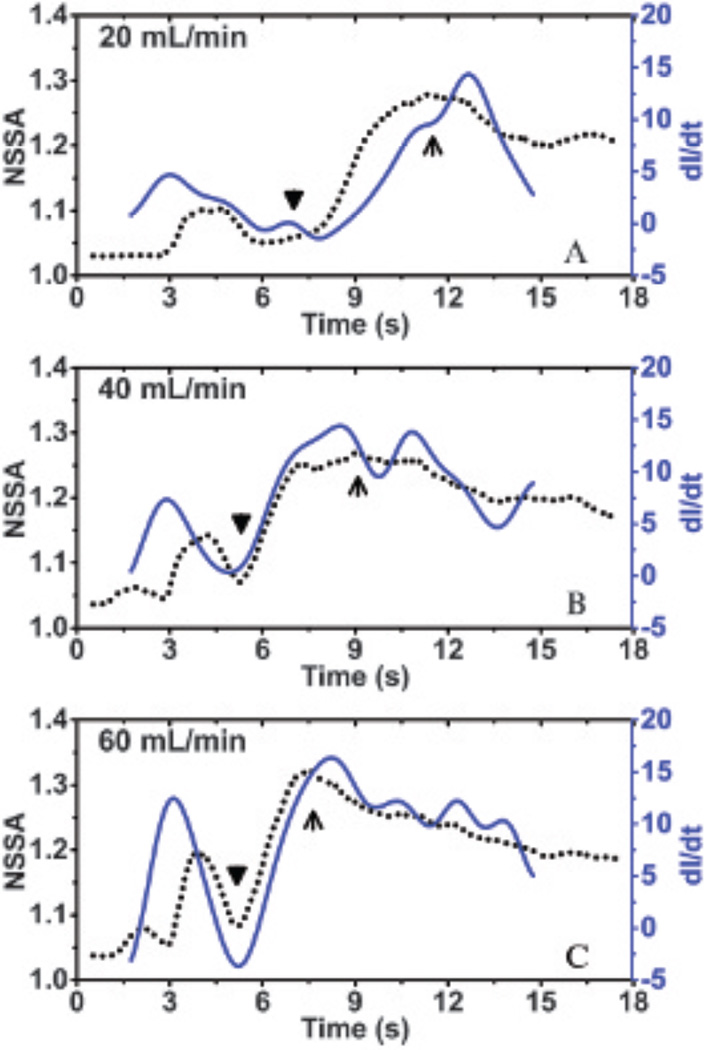
We hypothesize that the mechanism for shear flow–induced decorrelation from adherent microbubbles is derived from out-of-beam adherent microbubble motion (see Figure 2), which is caused by continuous attaching and detaching of the microbubbles from the vessel wall. When the degree of microbubble aggregation over time dominates any detachment over time, the measure of the derivative of the image intensity over time becomes a good indicator of the aggregate change in microbubble attachment and, therefore, out-of-beam motion that causes decorrelation. Correspondingly, experimental results demonstrated a good correlation between the dynamic NSSA and derivative of image intensity across different flow rates (Figure 12), especially at the increasing phase of the NSSA profile (ie, from the appearance of adherent microbubbles to the peak of NSSA curve; from triangles to arrows in Figure 12), which exhibited a minimum R2 value of .97. Given that the increased rate of image intensity was directly related to the increased rate of adherent microbubble concentration, the result supports our hypothesis that out-of-beam motion of adherent microbubbles results in an increase in slow-time decorrelation and, therefore, an increase in the NSSA.
Figure 12.
Overlaid plots of dynamic NSSA curves and the time derivative of image intensity (dI/dt) in regions of adherent microbubbles at different flow rates: (A) 20 mL/min (ie, 2.1 cm/s), (B) 40 mL/min (ie, 4.2 cm/s), and (C) 60 mL/min (ie, 6.3 cm/s). Black triangles indicate the appearance of adherent microbubbles. Black arrows indicate the peaks of the NSSA curve. The minimum R2 value between dI/dt and NSSA within the increasing phase (ie, from triangle to arrow) of NSSA profile among three flow rates is .97. The results were averaged over 20 trials in different fluid channels.
Discussion
In this study, we designed and executed experiments to systematically examine our hypothesis that flow shear forces were the primary physical mechanism responsible for the NSSA signature of adherent microbubbles. In addition, the precise pathway for flow shear forces was also verified: flow shear forces caused out-of-beam motion of adherent microbubbles between image frames, which resulted in increased decorrelation and therefore increased NSSA values of adherent microbubbles compared to the vessel wall and other tissue structures (Figure 13C).
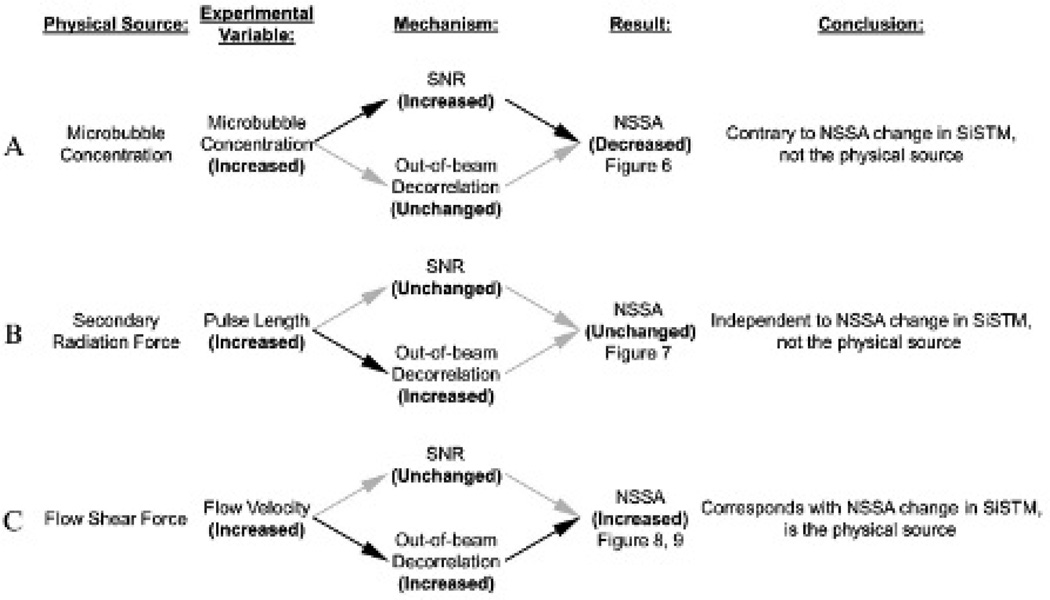
Figure 13.
Summary of experiment results and corresponding mechanisms and conclusions. A, Increased microbubble concentration caused increased signal to noise ratio (SNR), resulting in decreased NSSA. B, Increased secondary radiation force caused increased out-of-beam decorrelation, leaving NSSA unchanged. C, Increased flow shear force caused increased out-of-beam decorrelation, resulting in increased NSSA.
Figure 13 summarizes the findings of this study for the various possible mechanisms that were systematically tested. In Figure 13A, the effects of increased adherent microbubble concentration resulted in lower NSSA values compared to the vessel wall alone (see Figure 6 results), which contradicted with the observation in previous studies of SiSTM imaging.29 Consequently, the concentration of microbubbles is not the physical source responsible for the NSSA signature used in SiSTM imaging (see Figure 13A). In Figure 13B, NSSA values of adherent microbubbles were demonstrated to be independent of secondary acoustic radiation forces (see the Figure 7 results), which were induced with longer pulse lengths.35 The time interval between acoustic radiation force pulses and following imaging pulses was 2 milliseconds (see Figure 4). It is possible that the attraction and aggregation movement of microbubbles caused by secondary radiation forces lasts longer than 2 milliseconds. Hence, it was hypothesized that secondary radiation forces could potentially result in differential motion that would increase the NSSA as observed in SiSTM imaging. However, our results indicated no observable change in the NSSA with various degrees of secondary radiation force and the overall NSSA was less than in the vessel wall alone. It is probable that the motion of adherent microbubbles caused by secondary radiation force was too small with respect to the point spread function to cause detectable levels of decorrelation. As a result, it was concluded that secondary acoustic radiation force is not responsible for the NSSA signature.
The desired NSSA signature of adherent microbubbles was observed only with nonzero flow rates (see Figure 8 and Figure 9). Adherent microbubbles exhibited higher overall NSSA values compared to the vessel wall despite a higher SNR, which effectively lowers the NSSA. These results supported the hypothesis that flow shear forces were the precise physical mechanism responsible for changes in the NSSA signature that allows for signal separation in SiSTM imaging (see Figure 13C).
After the confirmation of flow shear forces as the primary physical source for the NSSA signature, the precise pathway was investigated. In Figure 10, the relationship between NSSA and decorrelation was verified experimentally. In Figure 11, in vitro flow phantom images show the similar efficacy of adherent microbubble separation based on the NSSA and decorrelation filtering. Thus, it was established that the flow shear forces were leading to a decorrelation that was causing the increase in the NSSA of adherent microbubbles relative to tissue.
Further substantiating this finding are the results illustrated in Figure 12. In these experiments, the derivative of the image intensity with respect to time was used as an indicator of out-of-beam motion, which occurred due to continuous aggregation or dislodgment of microbubbles against the vessel wall. The Figure 12 results showed a good match between the derivative of image intensity and the NSSA over time (R2 > .97 within the increasing phase of NSSA profile) and therefore confirmed that the NSSA values of adherent microbubbles are related to an out-of-beam motion of the microbubbles. Consequently, the data strongly suggest that the pathway is the following: flow shear forces lead to out-of-beam motion due to continuous aggregation and dislodgment of microbubbles against the vessel well. This physical mechanism leads to an increased decorrelation. Increased decorrelation is monotonic with increased NSSA values,29,30 which is observed in SiSTM imaging (see Figure 13C).
The significance of this work is related to future enhancements of ultrasound-based targeted molecular imaging, particularly as performed in real time. The limitations of current frequency-based strategies are derived from the assumption of equivalent slow-time properties of adherent microbubbles with tissue. However, we have conclusively demonstrated that the slow-time statistical properties between the vessel wall and adherent microbubbles are distinct and have proven the actual physical mechanism responsible for the distinction. These findings can be used as a basis for new targeted molecular imaging strategies in large blood vessels that achieve enhanced imaging specificity for adherent microbubbles. Additionally, the findings of this work clearly demonstrate that there is a monotonic relationship between decorrelation and the NSSA. This relationship might be used to develop techniques with reduced computational cost and possibly for cross-correlation-based physiologic motion correction. Overall, this study represents a significant step toward the long-term goal of demonstrating SiSTM imaging for real-time detection and quantification of early disease markers for atherosclerosis in large arteries in vivo.
Acknowledgments
The content is solely the responsibility of the authors and does not necessarily represent the official views of the National Institutes of Health. We would like to thank Claudia Y. Wang for her help with the experiments, Joseph P. Kilroy and Adam J. Dixon for their help on beam sequences programming, Sunil Unnikrishnan for his advice on microbubbles, and Verasonics, Inc. for its technical support.
Financial disclosure of authors: This work was supported by National Institutes of Health grants R01 EB001826 and R01 HL111077; and R21/33 CA102880.
Footnotes
Financial disclosure of reviewers: None reported.
References
- 1.Go AS, Mozaffarian D, Roger VL, et al. Heart disease and stroke statistics—2013 update: a report from the American Heart Association. Circulation. 2013;127:e6–245. doi: 10.1161/CIR.0b013e31828124ad. [DOI] [PMC free article] [PubMed] [Google Scholar]
- 2.Lovett JK, Gallagher PJ, Hands LJ, et al. Histological correlates of carotid plaque surface morphology on lumen contrast imaging. Circulation. 2004;110:2190–2197. doi: 10.1161/01.CIR.0000144307.82502.32. [DOI] [PubMed] [Google Scholar]
- 3.Miralles M, Merino J, Busto M, et al. Quantification and characterization of carotid calcium with multi-detector CT-angiography. Eur J Vasc Endovasc Surg. 2006;32:561–567. doi: 10.1016/j.ejvs.2006.02.019. [DOI] [PubMed] [Google Scholar]
- 4.Mathiesen EB, Bønaa KH, Joakimsen O. Echolucent plaques are associated with high risk of ischemic cerebrovascular events in carotid stenosis: the Tromsø study. Circulation. 2001;103:2171–2175. doi: 10.1161/01.cir.103.17.2171. [DOI] [PubMed] [Google Scholar]
- 5.Lorenz MW, Markus HS, Bots ML, et al. Prediction of clinical cardiovascular events with carotid intima-media thickness: a systematic review and meta-analysis. Circulation. 2007;115:459–467. doi: 10.1161/CIRCULATIONAHA.106.628875. [DOI] [PubMed] [Google Scholar]
- 6.Ross R. The pathogenesis of atherosclerosis: a perspective for the 1990s. Nature. 1993;362:801–809. doi: 10.1038/362801a0. [DOI] [PubMed] [Google Scholar]
- 7.Villanueva FS, Jankowski RJ, Klibanov S, et al. Microbubbles targeted to intercellular adhesion molecule-1 bind to activated coronary artery endothelial cells. Circulation. 1998;98:1–5. doi: 10.1161/01.cir.98.1.1. [DOI] [PubMed] [Google Scholar]
- 8.Weller GER, Villanueva FS, Klibanov AL, Wagner WR. Modulating targeted adhesion of an ultrasound contrast agent to dysfunctional endothelium. Ann Biomed Eng. 2002;30:1012–1019. doi: 10.1114/1.1513565. [DOI] [PubMed] [Google Scholar]
- 9.Rychak JJ, Lindner JR, Ley K, Klibanov AL. Deformable gas-filled microbubbles targeted to P-selectin. J Control Release. 2006;114:288–299. doi: 10.1016/j.jconrel.2006.06.008. [DOI] [PubMed] [Google Scholar]
- 10.Lindner JR, Song J, Christiansen J, et al. Ultrasound assessment of inflammation and renal tissue injury with microbubbles targeted to P-selectin. Circulation. 2001;104:2107–2012. doi: 10.1161/hc4201.097061. [DOI] [PubMed] [Google Scholar]
- 11.Takalkar AM, Klibanov AL, Rychak JJ, et al. Binding and detachment dynamics of microbubbles targeted to P-selectin under controlled shear flow. J Control Release. 2004;96:473–482. doi: 10.1016/j.jconrel.2004.03.002. [DOI] [PubMed] [Google Scholar]
- 12.Ferrara K, Pollard R, Borden M. Ultrasound microbubble contrast agents: fundamentals and application to gene and drug delivery. Annu Rev Biomed Eng. 2007;9:415–447. doi: 10.1146/annurev.bioeng.8.061505.095852. [DOI] [PubMed] [Google Scholar]
- 13.Klibanov AL. Ultrasound molecular imaging with targeted microbubble contrast agents. J Nucl Cardiol. 2007;14:876–884. doi: 10.1016/j.nuclcard.2007.09.008. [DOI] [PubMed] [Google Scholar]
- 14.Deshpande N, Needles A, Willmann JK. Molecular ultrasound imaging: current status and future directions. Clin Radiol. 2010;65:567–581. doi: 10.1016/j.crad.2010.02.013. [DOI] [PMC free article] [PubMed] [Google Scholar]
- 15.Kornmann LM, Reesink KD, Reneman RS, Hoeks APG. Critical appraisal of targeted ultrasound contrast agents for molecular imaging in large arteries. Ultrasound Med Biol. 2010;36:181–191. doi: 10.1016/j.ultrasmedbio.2009.09.009. [DOI] [PubMed] [Google Scholar]
- 16.Kaufmann BA, Carr CL, Belcik JT, et al. Molecular imaging of the initial inflammatory response in atherosclerosis: implications for early detection of disease. Arterioscler Thromb Vasc Biol. 2010;30:54–59. doi: 10.1161/ATVBAHA.109.196386. [DOI] [PMC free article] [PubMed] [Google Scholar]
- 17.Shah F, Balan P, Weinberg M, et al. Contrast-enhanced ultrasound imaging of atherosclerotic carotid plaque neovascularization: a new surrogate marker of atherosclerosis? Vasc Med. 2007;12:291–297. doi: 10.1177/1358863X07083363. [DOI] [PubMed] [Google Scholar]
- 18.Feinstein SB. Contrast ultrasound imaging of the carotid artery vasa vasorum and atherosclerotic plaque neovascularization. J Am Coll Cardiol. 2006;48:236–243. doi: 10.1016/j.jacc.2006.02.068. [DOI] [PubMed] [Google Scholar]
- 19.Dayton P, Klibanov A, Brandenburger G, Ferrara K. Acoustic radiation force in vivo: a mechanism to assist targeting of microbubbles. Ultrasound Med Biol. 1999;25:1195–1201. doi: 10.1016/s0301-5629(99)00062-9. [DOI] [PubMed] [Google Scholar]
- 20.Dayton PA, Allen JS, Ferrara KW. The magnitude of radiation force on ultrasound contrast agents. J Acoust Soc Am. 2002;112(5 Pt 1):2183–2192. doi: 10.1121/1.1509428. [DOI] [PubMed] [Google Scholar]
- 21.Zhao S, Borden M, Bloch SH, et al. Radiation-force assisted targeting facilitates ultrasonic molecular imaging. Mol Imaging. 2004;3:135–148. doi: 10.1162/1535350042380317. [DOI] [PMC free article] [PubMed] [Google Scholar]
- 22.Rychak JJ, Klibanov AL, Hossack JA. Acoustic radiation force enhances targeted delivery of ultrasound contrast microbubbles: in vitro verification. IEEE Trans Ultrason Ferroelectr Freq Control. 2005;52:421–433. doi: 10.1109/tuffc.2005.1417264. [DOI] [PubMed] [Google Scholar]
- 23.Rychak JJ, Klibanov AL, Ley KF, Hossack JA. Enhanced targeting of ultrasound contrast agents using acoustic radiation force. Ultrasound Med Biol. 2007;33:1132–1139. doi: 10.1016/j.ultrasmedbio.2007.01.005. [DOI] [PubMed] [Google Scholar]
- 24.Gessner R, Lukacs M, Lee M, et al. High-resolution, high-contrast ultrasound imaging using a prototype dual-frequency transducer in-vitro and in-vivo studies. IEEE Trans Ultrason Ferroelectr Freq Control. 2010;57:1772–1781. doi: 10.1109/TUFFC.2010.1615. [DOI] [PMC free article] [PubMed] [Google Scholar]
- 25.Needles A, Couture O, Foster FS. A method for differentiating targeted microbubbles in real time using subharmonic micro-ultrasound and interframe filtering. Ultrasound Med Biol. 2009;35:1564–1573. doi: 10.1016/j.ultrasmedbio.2009.04.006. [DOI] [PubMed] [Google Scholar]
- 26.Hu X, Zheng H, Kruse DE, et al. A sensitive TLRH targeted imaging technique for ultrasonic molecular imaging. IEEE Trans Ultrason Ferroelectr Freq Control. 2010;57:305–316. doi: 10.1109/TUFFC.2010.1411. [DOI] [PMC free article] [PubMed] [Google Scholar]
- 27.Patil AV, Rychak JJ, Allen JS, et al. Dual frequency method for simultaneous translation and real-time imaging of ultrasound contrast agents within large blood vessels. Ultrasound Med Biol. 2009;35:2021–2030. doi: 10.1016/j.ultrasmedbio.2009.07.003. [DOI] [PMC free article] [PubMed] [Google Scholar]
- 28.Patil AV, Rychak JJ, Klibanov AL, Hossack JA. Real-time technique for improving molecular imaging and guiding drug delivery in large blood vessels: in vitro and ex vivo results. Mol Imaging. 2011;10:238–247. doi: 10.2310/7290.2011.00002. [DOI] [PMC free article] [PubMed] [Google Scholar]
- 29.Mauldin FWJ, Dhanaliwala AH, Patil AV, Hossack JA. Real-time targeted molecular imaging using singular value spectra properties to isolate the adherent microbubble signal. Phys Med Biol. 2012;57:5275–5293. doi: 10.1088/0031-9155/57/16/5275. [DOI] [PMC free article] [PubMed] [Google Scholar]
- 30.Mauldin FWJ, Lin D, Hossack JA. The singular value filter: a general filter design strategy for PCA-based signal separation in medical ultrasound imaging. IEEE Trans Med Imaging. 2011;30:1951–1964. doi: 10.1109/TMI.2011.2160075. [DOI] [PMC free article] [PubMed] [Google Scholar]
- 31.Vautard R, Ghil M. Singular spectrum analysis in nonlinear dynamics, with applications to paleoclimatic time series. Physica D. 1989;35:395–424. [Google Scholar]
- 32.McAleavey SA, Nightingale KR, Trahey GE. Estimates of echo correlation and measurement bias in acoustic radiation force impulse imaging. IEEE Trans Ultrason Ferroelectr Freq Control. 2003;50:631–641. doi: 10.1109/tuffc.2003.1209550. [DOI] [PubMed] [Google Scholar]
- 33.Mauldin FWJ, Viola F, Walker WF. Reduction of echo decorrelation via complex principal component filtering. Ultrasound Med Biol. 2009;35:1325–1343. doi: 10.1016/j.ultrasmedbio.2009.01.013. [DOI] [PMC free article] [PubMed] [Google Scholar]
- 34.Dhanaliwala AH, Hossack JA, Mauldin FW. Assessing and improving acoustic radiation force image quality using a 1.5-D transducer design. IEEE Trans Ultrason Ferroelectr Freq Control. 2012;59:1602–1608. doi: 10.1109/TUFFC.2012.2360. [DOI] [PMC free article] [PubMed] [Google Scholar]
- 35.Dayton PA, Morgan KE, Klibanov AL, et al. A preliminary evaluation of the effects of primary and secondary radiation forces on acoustic contrast agents. IEEE Trans Ultrason Ferroelectr Freq Control. 1997;44:1264–1277. [Google Scholar]
- 36.Loughran J, Sennoga CJ, Eckersley R, Tang M-X. Effect of ultrasound on adherent microbubble contrast agents. Phys Med Biol. 2012;57:6999–7014. doi: 10.1088/0031-9155/57/21/6999. [DOI] [PubMed] [Google Scholar]
- 37.Guenther F, Von Zur Muhlen C, Ferrante EA, et al. An ultrasound contrast agent targeted to P-selectin detects activated platelets at supra-arterial shear flow conditions. Invest Radiol. 2010;45:586–591. doi: 10.1097/RLI.0b013e3181ed1b3b. [DOI] [PMC free article] [PubMed] [Google Scholar]
- 38.Calderon AJ, Muzykantov V, Muro S, Eckmann DM. Flow dynamics, binding and detachment of spherical carriers targeted to ICAM-1 on endothelial cells. Biorheology. 2009;46:323–341. doi: 10.3233/BIR-2009-0544. [DOI] [PMC free article] [PubMed] [Google Scholar]
- 39.Hall TJ, Bilgen M, Insana MF, Krouskop TA. Phantom materials for elastography. IEEE Trans Ultrason Ferroelectr Freq Control. 1997;44:1355–1365. [Google Scholar]
- 40.Klibanov AL, Rychak JJ, Yang WC, et al. Targeted ultrasound contrast agent for molecular imaging of inflammation in high-shear flow. Contrast Media Mol Imaging. 2006;1:259–266. doi: 10.1002/cmmi.113. [DOI] [PubMed] [Google Scholar]
- 41.Batchelor GK. An introduction to fluid dynamics. Cambridge, UK: Cambridge University Press; 1967. [Google Scholar]


