

Abstract
Despite an increased incidence of depression in patients after spinal cord injury (SCI), there is no animal model of depression after SCI. To address this, we used a battery of established tests to assess depression after a rodent contusion injury. Subjects were acclimated to the tasks, and baseline scores were collected before SCI. Testing was conducted on days 9–10 (acute) and 19–20 (chronic) postinjury. To categorize depression, subjects' scores on each behavioral measure were averaged across the acute and chronic stages of injury and subjected to a principal component analysis. This analysis revealed a two-component structure, which explained 72.2% of between-subjects variance. The data were then analyzed with a hierarchical cluster analysis, identifying two clusters that differed significantly on the sucrose preference, open field, social exploration, and burrowing tasks. One cluster (9 of 26 subjects) displayed characteristics of depression. Using these data, a discriminant function analysis was conducted to derive an equation that could classify subjects as “depressed” on days 9–10. The discriminant function was used in a second experiment examining whether the depression-like symptoms could be reversed with the antidepressant, fluoxetine. Fluoxetine significantly decreased immobility in the forced swim test (FST) in depressed subjects identified with the equation. Subjects that were depressed and treated with saline displayed significantly increased immobility on the FST, relative to not depressed, saline-treated controls. These initial experiments validate our tests of depression, generating a powerful model system for further understanding the relationships between molecular changes induced by SCI and the development of depression.
Key words: : contusion, depression, fluoxetine, quality of life, spinal cord injury
Introduction
Epidemiological studies report that the incidence of major depressive disorder (MDD) after spinal cord injury (SCI) ranges from 11 to 24%, compared to the rate of 8.6% in the general population.1,2 A further 16–34% of SCI patients report significant clinical symptoms of depression, but do not meet the criteria for MDD.3–6 Though this increased incidence of depression may not be surprising, given the significant effect of SCI on multiple facets of everyday life, emerging evidence suggests that the molecular changes induced by the injury itself may also potentiate the development of depression. There is increasing evidence that, in a subset of the population, depression may arise as a result of excitation of the immune system.7,8 This is particularly relevant for depression after SCI, which is characterized by inflammation. With an absence of confounding variables, such as economic stressors or lowered self-efficacy, an animal model of depression after SCI would significantly advance our understanding of the molecular changes caused directly by the injury that might potentiate the development of symptoms of depression.
Understanding the etiology of depression after SCI is important at multiple levels. In addition to decreasing psychological well-being, depression has significant implications for physical recovery after SCI. Studies suggest that the incidence of urinary tract infections, pressure ulcers, and autonomic dysreflexia are significantly increased in SCI patients with depression, relative to nondepressed patients.9 This increased incidence of postinjury secondary complications is likely the result, in part, of reduced compliance and motivation when following the directions of physicians as well as decreased coping skills.10 Depression is also associated with the emergence of suicidal thoughts, with some studies suggesting that the suicide rate is five times greater in SCI patients than in the general population.11–13 These epidemiological studies indicate that not only does SCI increase the potential for depression, but that also depression, in turn, will significantly affect recovery of function and general health.
McKinney and Bunney proposed that an animal model of depression should display symptoms that are 1) reasonably analogous to those observed in human depression, 2) objectively quantifiable and replicable, and 3) are reversed by treatment modalities effective in attenuating depression in humans.14 According to the Diagnostic and Statistical Manual of Mental Disorders, Fourth Edition (DSM-IV), symptoms of major depressive disorder include diminished interest in pleasure activities, insomnia, or hypersomnia, significant changes in weight without diet modification, psychomotor agitation, or retardation, fatigue or loss of energy, feelings of worthlessness, diminished concentration, and recurrent thoughts of death and suicide or suicide attempts.15 Many, but not all, of the core symptoms of major depressive disorder have been assessed in rodent models of diverse disease or injury states, including epilepsy, traumatic brain injury, cancer, diabetes, and stroke.16–20 Assessment of depression in these animal models includes behavioral paradigms that focus on “helplessness,” loss of interest in pleasurable activities, and decreases in activity or changes in appetite and sleep patterns. The sucrose preference test (SPT), for example, is considered to be the gold standard for the assessment of loss of interest in pleasurable activities, measuring a subject's preference for a typically desirable sucrose solution, relative to water.21 The forced swim test (FST) is another commonly applied paradigm that indexes helplessness, assessing a subject's motivation to swim (and escape) when placed into water. Immobility on this task is thought to be characteristic of helplessness and to assess a motivational state that underlies the core symptom of suicide ideation in humans.19,20,22 Importantly, depression-like behaviors assessed with these objective tests are reversed with antidepressants that are commonly prescribed for human use. For example, in a model of poststroke depression, decreased sucrose preference was reversed by administration of the selective serotonin reuptake inhibitor (SSRI) anti-depressant drug, citalopram.21 Acute (3 days) and chronic (14 days) administration of reboxetine and moclobemide, as well as chronic administration of fluoxetine, have also been shown to decrease immobility in the FST.23 Whereas no animal model will be behaviorally and biologically identical to the human disorder, the models and tests developed are reasonably analogous to human symptoms, achieve high levels of reliability, and are modulated by antidepressants that are efficacious in the clinical population.24 An animal model of depression after SCI that fulfills these criteria will be invaluable in the development of safe, efficacious treatments aimed at improving quality of life in patients after SCI.
Despite the prevalence of depression after SCI and the significant effect of this disorder on quality of life, there have been no empirical studies of depression in an animal SCI model. To address this, the studies reported here used established, standardized tests to assess depression-like behaviors in a rodent spinal contusion model. Whereas most studies of depression in animal models use one or two tests to evaluate depression-like behavior, the current studies used a comprehensive battery of tests to produce a diagnosis of depression that encompassed a significant proportion of the depressive spectrum. Angst and Merikangas argue that the use of a categorical threshold (e.g., when diagnosing MDD) for a continuously distributed trait may lead to a diagnostic system that fails to truly represent the underlying spectrum of depression.25 Patients that are not diagnosed as suffering from MDD, for example, but still suffer from depressive symptoms could potentially benefit from targeted therapies.25,26 Importantly, depressed populations also appear to consist of subpopulations, with the etiology of depression differing among groups.25,27 The application of multiple tests of depression-like behavior not only enables a diagnosis of depression that falls within a continuum, such as that of humans, but subsequently would also allow for a more detailed evaluation of the relationships between specific symptoms of depression and underlying molecular changes.
In addition to the development of a comprehensive ethogram for defining depression, the current studies examined the functional consequences of depression in the rodent SCI model. As noted previously, depression has been associated with decreased general health in the clinical population. However, there have been few systematic analyses of the side effects of commonly used antidepressants after SCI. Instead, evaluation of the effects of antidepressants has been based on extrapolation of the extant literature on antidepressant effects in the general population.28 Potential secondary consequences of antidepressant treatments after SCI need to be empirically assessed. The current study examined the effects of fluoxetine (an SSRI), because it is known that modulation of 5-hydroxytryptamine (5-HT) levels contributes to some forms of depression.29 We assessed the effectiveness of fluoxetine in attenuating depression-like behavior and evaluated its effects on functional recovery after SCI. Indeed, other studies suggest that this antidepressant may have beneficial effects on recovery of function. For example, studies have shown that fluoxetine treatment improves locomotor function after an incomplete SCI,30–32 and others have found that increasing serotonergic activity is associated with improvements in motor movement.33–36 Because the focus of the present study was on the reversal of depression, we used a dose of fluoxetine that has been shown to be subthreshold for increasing motor activity per se (5 mg/kg/day), 36 which may confound the interpretation of depression-like behavior for motor-dependent tasks (e.g., open-field activity), and extended previous analyses looking at the effects of fluoxetine on sensory, as well as locomotor, recovery after SCI.
Methods
Subjects
The subjects were 62 male Sprague-Dawley rats (n=26 in experiment 1 and n=36 in experiment 2) obtained from Harlan Laboratories (Houston, TX). They were approximately 90–110 days old (300-350 g) and were individually housed in Plexiglas bins (45.7 [length]×23.5 [width]×20.3 [height] cm) with food and water continuously available. Food consumption and subject weights were recorded daily. After surgery, subjects were manually expressed in the morning (8:00–9:30 am) and in the evening (6:00–7:30 pm) until they regained full bladder control (which was operationally defined as 3 consecutive days with an empty bladder at the time of expression) and were checked daily for signs of autophagia and spasticity. All symptoms of autophagia were treated by spraying the affected limb with bitter apple spray. Eight of the 62 subjects displayed signs of autophagia, but the behavior was resolved within 24 h of initiating treatment with bitter apple spray. A subject was classified as having spasticity if the limb was in an extended, fixed position and was resistant to movement. None of the rats displayed spasticity in the current experiments. Rats were maintained on a 12-h light/dark cycle, and all behavioral testing was conducted during the light cycle.
All of the experiments reported here were reviewed and approved by the institutional animal care committee at Texas A&M University (College Station, TX), and all National Institutes of Health guidelines for the care and use of animal subjects were followed.
Surgery
Subjects received a moderate contusion injury using a MASCIS device, as described by Hook and colleagues.37 Briefly, subjects were anesthetized with isoflurane (5% mixed with oxygen and gas), and after a stable level of anesthesia was reached, the concentration of isoflurane was lowered to 2–3%. Next, the subject's back was shaved and disinfected with iodine and a 7.0-cm incision was made over the spinal cord. Two incisions were then made on either side of the vertebral column, extending approximately 3 cm rostral and caudal to the T12 segment. The dorsal spinous processes at T12 were removed (laminectomy) and the spinal tissue exposed. The vertebral column was fixed within the MASCIS device and a 10-g impactor (outfitted with a 2.5-mm tip) was dropped 12.5 mm, onto the exposed spinal tissue, to produce a moderate injury. The wound was closed using Michel clips.
For the first 24 h after surgery, subjects were placed in a recovery room maintained at 26.6°C. At the time of surgery, subjects were treated with 5 mg/kg of gentocin administered subcutaneously (s.c.) to prevent infection and with 2.5 mL of s.c. saline (0.9%) to compensate for fluid loss. Subjects received additional daily injections of gentocin (5 mg/kg, s.c.) and saline (2.5 mL) for 5 days after injury. Michel clips were removed 14 days after surgery.
Procedure
Experiment 1: developing an ethogram for assessment of depression after spinal cord injury
This initial experiment aimed to characterize the etiology and incidence of depression-like behavior after a spinal contusion injury. Twenty-six male rats were assessed on a battery of tests that have been used routinely to assess depression in rodents and that are thought to be analogous to depression-like symptoms in humans (see Table 1). The ethogram for depressive-like symptoms studied in this experiment consisted of the behaviors summarized in Table 1. The procedures for each of the tests are described in detail in a subsequent section (see “Behavioral tests”).
Table 1.
Summary of the Behavioral Tests, Outcomes of the Tests Interpreted to be Indicative of Depression, and the Proposed Analogous Depression Symptoms
| Behavioral test | Behavior outcome indicative of depression | Analogous depression symptoms |
|---|---|---|
| Sucrose preference | Decreased sucrose consumption (anhedonia) | Loss of interest or pleasure |
| Social exploration | Decreased time spent engaging in social behaviors | Loss of interest of pleasure |
| Open-field activity | Decreased number of squares entered | Psychomotor agitation or retardation |
| Burrowing | Decreased amount of woodchips burrowed out | Fatigue or loss of energy |
| Forced swim test | Decreased time spent swimming | Despair, hopelessness (positively correlated with suicide ideation) |
Briefly, preceding data collection, subjects were acclimated to the novel test environment of the open field, as well as to a sucrose drinking solution and a burrowing apparatus placed into their home cages (see Fig. 1). They were given three acclimation sessions for each test 7–14 days before the contusion injury.
FIG. 1.

Subjects were acclimated to open field (OF), sucrose solution (SP), and a burrowing apparatus (Burrow) 7–14 days before contusion injury. Baseline scores were collected 1–2 days before contusion injury, for the SP, OF, burrow, and social exploration (SE) task. Then, after injury, tests of depression were performed on days 9–10 and 19–21. Performance on the forced swim test (FST) was also recorded in the final test session. Assessment of locomotor function, weight gain, and appetite deviation occurred throughout the recovery period, and tests of sensory/nociceptive reactivity were conducted at the end of the assessment period (day 22). For experiment 2, the schedule for acclimation and testing in the acute phase of injury replicated that shown for experiment 1. In this experiment, however, subjects received daily injections (i.p.) of fluoxetine or saline beginning on day 14 postinjury, and tests in the chronic phase were delayed until days 29–31.
Baseline measures of performance were collected 1–2 days before the contusion injury, for the sucrose preference, social exploration, burrowing, and open-field tests (Fig. 1). Subjects then received a moderate contusion injury, as described previously (see “Surgery”). Then, as shown in Figure 1, subjects' performances on each of the behavioral tests of depression were tested on days 9–10 and 19–21. Performance on the FST was also recorded in the final test session, a point at which all subjects had regained sufficient motor function to perform this task. The amount of food consumed by each subject was monitored throughout the recovery period to derive a measure of appetite deviation, another characteristic of depression. After the contusion injury, locomotor and sensory functions were assessed across the 21-day recovery period, as described below (see “Behavioral tests”).
Experiment 2: fluoxetine treatment to reverse spinal cord injury–induced depression-like behaviors
Experiment 2 aimed to validate the classification measures for depression derived in experiment 1. Thirty-six subjects were tested in this experiment. Using a discriminant function equation (derived from experiment 1), subjects were separated into depressed (n=14) and nondepressed (n=22) groups, based on their performances on the tests on days 9–10. Approximately half of the subjects in each group (depressed and nondepressed) then received daily injections of fluoxetine (5 mg/kg, intraperitoneally [i.p.]), beginning on day 14 and continuing through the final day of behavioral testing (day 32), with the remaining subjects receiving daily injections of saline for the same duration. This results in a 2 (depressed and nondepressed)×2 (fluoxetine and saline) experimental design.
For behavioral testing, this experiment followed essentially the same timeline as described for experiment 1. However, the behavioral tests of depression in the chronic phase were conducted on days 29–30. The FST was also delayed until day 31. This was done to allow the time necessary for fluoxetine to take its effect.38 Pain reactivity measures (girdle, tactile, and tail-flick) were assessed before surgery and on days 3, 11, 21, and 32. Locomotor function was monitored for 27 days after injury.
Behavioral assessment of depression
Sucrose preference test
The SPT was conducted in the home cage. For testing, one preweighed water bottle filled with approximately 250 mL of 2% sucrose solution and one preweighed bottle filled with an equal amount of water were placed on either side of the subject's cage and left for 2 hours. Placement of the sucrose and water solutions (on either the left or right sides) was counterbalanced between subjects and across testing periods. The position of the bottle in the cage (left/right) was also reversed after 1 h to prevent any positional biases from confounding results. At the end of the test period, the change in the weight of each bottle of solution was determined. Sucrose preference (SP) was then calculated using the following formula: %SP=[sucrose solution intake (mL) / (sucrose solution intake (mL)+water intake (mL)]×100.21
Subjects were acclimated to the sucrose preference test in three sessions, beginning 14 days before surgery (see Fig. 1). Baseline preferences were collected 3 days before surgery. SP was then measured on days 9 and 19/29 (respectively for experiments 1 and 2) postinjury (see Fig. 1). A decrease in SP is a sign of anhedonia, or lack of ability to experience pleasure, characteristic of depression-like behavior.
Open-field activity
The open-field test was conducted in a black plywood box (100 [length]×20 [height]×100 [width] cm). The floor of this box was partitioned into 100 squares (10 [length]×10 [width] cm) delineated with silver marker. A layer of clear Plexiglas was used to cover the top of the box. The testing room was dark and the open-field environment was illuminated from above by a 60-W white light. Subjects were acclimated to the testing room (in their transport boxes) for 10 min before testing. After the acclimation period, the subject was placed in the center of the plywood box to begin a 5-min test session. The test was video recorded from above. The number of squares that the subject moved into, operationalized as having at least the front two paws in the square, was scored from post-hoc video analyses. The total number of squares crossed were divided by 300 sec and then multiplied by 100 to obtain a percentage number of squares per second value. Between each trial, the open-field environment was cleaned with Nolvasan to eliminate any olfactory cues.
Subjects were acclimated to the open-field environment during three sessions, beginning 14 days before surgery. Baseline activity levels were collected 3 days before surgery. Open-field activity was then assessed on days 9 and 19/29 postinjury (see Fig. 1). A decrease in open-field behavior was interpreted as depression-like behavior.
Burrowing
The burrowing apparatus was a polyvinyl chloride tube (45 [length]×15 [diameter] cm) closed on one end. For the test, burrowing tubes were filled with 500 g of pine wood chips and placed in the subject's home cage. After 2 h, the woodchips remaining in the tube were weighed. The burrowing score was derived by subtracting woodchips remaining (g) from the initial 500-g weight. The burrowing apparatus was not disinfected between trials, so that the burrowing tube was familiar to the subject.
Subjects were acclimated to the burrowing tubes in three sessions, beginning 13 days before surgery. Baseline burrowing levels were collected 2 days before surgery, with subsequent tests on days 10 and 20/30 postinjury (see Fig. 1). A decrease in burrowing behavior is indicative of depression-like behavior.
Social exploration
Social exploration was assessed in the same apparatus that was used to measure open-field activity. A subject was placed into the center of the open-field environment and allowed to explore for 5 min. A juvenile rat (<250 g weight), not exposed to any experimental treatment, was then placed into the open field as far from the test subject as possible. The focal subject and the juvenile rat were videotaped for 5 min. Video tapes were scored post hoc recording the time the subject spent performing social behaviors that included moving toward the conspecific, anogenital sniffing, and close following of the juvenile rat.39 The percent of total time (5 min) spent engaged in social behavior was derived for the measure of social exploration. The test apparatus was disinfected with Nolvasan in between trials.
Subjects were acclimated to the open-field environment as described previously (see “Open field activity”). Baseline social exploration was assessed 2 days before surgery. Social exploration was assessed on days 10 and 20/30 postinjury (see Fig. 1). Reduced social exploration behavior is a measure of loss of interest or pleasure, a depression-like symptom.
Forced swim test
The FST was conducted once only, for each subject, at either 21 (experiment 1) or 31 (experiment 2) days postinjury. Subjects were allowed to acclimate in the testing room for 10 min. The testing room was maintained at 27.2°C. The subject was then placed in a cylinder (15 [diameter]×40 [height] cm) filled with water (23±1°C) from which they could not escape. The FST is traditionally conducted using a 10-min acclimation period and a 10-min test period 24 h later. However, Abel and Bilitzke found that immobility measured during a 10-min acclimation period was highly correlated with immobility measured in the test period conducted 24 h later.40 Therefore, in the current study, the subjects were video recorded for a 10-min test period only (without the preceding acclimation to the water), and time spent immobile was scored post hoc. Immobility was characterized as a lack of any movement, except those required to keep the head above water.41 Immobility is interpreted as a symptom of learned helplessness and characteristic of depression in rodent subjects.
Changes in appetite
Using daily food-weight recordings, baseline average daily food consumption (over the 5 days immediately before injury; see Fig. 1) was calculated before injury. Changes in average food consumption were then determined for the acute (days 9–10) and chronic phase (19–20) of injury. The formula for detecting changes in appetite was as follows:
=Absolute Value (average baseline food consumption – average acute/chronic phase food consumption).
Appetite deviation, either increased or decreased, is a symptom of depression-like behavior.
Behavioral assessment of recovery and general health
Locomotor recovery
The recovery of hindlimb stepping ability was scored using the Basso, Beattie, and Bresnahan (BBB) scale.42 This 21-point scale is used as an index of hindlimb functioning after a spinal injury. Using this scale, no movement of the hindlimbs (ankle, knee, or hip) is designated a score of 0, and intermediate milestones include slight movement of one joint (1), extensive movement of all three joints (7), occasional weight-supported stepping in the absence of coordination (10), and consistent weight-supported stepping with consistent forelimb/hindlimb coordination (14). Higher scores reflect consistent limb coordination and improved fine motor skill.
In our studies, subjects were placed in an open-field enclosure (99 cm in diameter and 23 cm deep) and allowed to move freely. Because rats often freeze when first introduced to a new environment, they were acclimated to the open-field test area for 5 min on 3 consecutive days before surgery. After injury, the locomotor capacity (BBB) of subjects was observed for 5 min and scored by a trained observer on days 1–7, 9, 11, 13, 15, 18, and 21. In experiment 2, subjects were also assessed on days 24 and 27. Care was taken to ensure that all observers' scoring behavior had high intra- and interobserver reliability (all rs>0.90) and that they were blind to the subject's experimental treatment.
Nociceptive reactivity
Thermal reactivity was assessed using radiant heat in the tail-flick test. Subjects were placed in the restraining tubes with their tail positioned in a 0.5-cm-deep groove, cut into an aluminum block, and allowed to acclimate to the apparatus (IITC Life Science, Woodland Hills, CA) and testing room for 15 min. The testing room was maintained at 26.5°C. Thermal thresholds were then assessed. Thermal reactivity was tested using a halogen light that was focused onto the rat's tail. Before testing, the temperature of the light, focused on the tail, was set to elicit a baseline tail-flick response in 3–4 sec (average). This preset temperature was maintained across all subjects. In testing, the latency to flick the tail away from the radiant heat source (light) was recorded. If a subject failed to respond, the test trial was automatically terminated after 8 sec of heat exposure. Two tests occurred at 2-min intervals, and the second test tail-flick latencies were recorded. To confirm that subjects did not respond in the absence of the stimuli, blank trials were also performed. A “false alarm” was recorded if subjects made a motor or vocalization response during the blank tests. The blank trials were performed 1 min before or after each sensory test (in a counterbalanced fashion). No false alarms were recorded. After assessment of thermal reactivity, subjects were returned to their home cages for a minimum of 2 h. Thermal reactivity was assessed on days 4 and 22 postinjury.
After 2 h (on days 4 and 22 postinjury), subjects were placed back into restraint tubes and presented with von Frey stimulation (von Frey stimuli formed from nylon monofilaments; Semmes-Weinstein Anesthesiometer; Stoelting Co., Chicago, IL) to test tactile reactivity. Filaments of increasing strength were applied every 2 sec in sequence to the plantar surface of the paw. The stimuli were presented until subjects exhibited a paw withdrawal/motor and vocalization response. The intensity of the stimuli that produced the responses was reported using the formula provided by Semmes-Weinstein: Intensity=log10 (10,000 * g force). If one or both responses were not observed, testing was terminated at a force of 300g. Each subject was tested twice on each foot in a counterbalanced ABBA order.
Tactile reactivity was also assessed, on days 4 and 22 postinjury, at the level of injury using the girdle test.43 For this test, the girdle region was shaved and a grid map of the girdle zone for allodynic responding was made on rats using an indelible marker (44 squares). To ensure that rats remained calm for testing, they were handled for 5 min immediately before beginning the girdle test. A von Frey hair with a bending force of 204.14 mN (26g force) was then applied to each point on the grid, and vocalization responses were recorded and mapped onto a grid map of that animal. Because animals do not normally vocalize with this stimulus, a vocalization response indicates that a noxious stimulus was experienced. In mapping the area of response, the number of vocalizations are recorded (Nv) and normalized by the following formula: [Nv×100]/total number of applications (44), indicating the percent vocalizations out of the total number of applications.
Histology
Histological analyses were conducted at the end of experiment 1 to examine whether the sparing of spinal tissue, or, conversely, the extent of the lesion, affected performance on the tests of depression. At the end of behavioral testing, subjects were deeply anesthetized (100 mg/kg of pentobarbital, i.p.) and perfused (intracardially) with 4% paraformaldehyde. A 1-cm-long segment of the spinal cord that included the lesion center was taken and frozen for sectioning. Tissue was sectioned coronally in 20-μm-thick sections and every 10th slice was preserved for staining. All sections were stained with cresyl violet for Nissl substance and luxol fast blue for myelin.44,45
Total cross-sectional area of the cord and spared tissue was assessed at the lesion center (averaged across three sections −600, 0, and +600 μm from the lesion center) using MicroBrightField software (MBF Bioscience, Williston, VT). Assessments were made by an experimenter who was blind to the subject's treatment condition. Four indices of lesion magnitude were derived: lesion; residual gray matter (GM); residual white matter (WM); and width. To determine the area of lesion, an observer who was blind to the experimental treatments traced around the boundaries of cystic formations and areas of dense gliosis.42 Nissl-stained areas that contained neurons and glia of approximately normal densities denoted residual GM. WM was judged spared in myelin-stained areas lacking dense gliosis and swollen fibers. Total area of each cross-section was derived by summing the areas of damage, GM, and WM. Width was determined from the most lateral points along the transverse plane. These analyses yielded six parameters for each section: WM area, GM area, spared tissue (white+gray), damaged tissue area, net area (white+gray+damage), and section width.
To control for variability in section area across subjects, we applied a correction factor derived from standard undamaged cord sections, taken from age-matched controls. This correction factor is based on section widths and is multiplied by all area measurements to standardize area across analyses.46 By standardizing area across sections, we were able to estimate the degree to which tissue was “missing” (i.e., tissue loss from atrophy, necrosis, or apoptosis). An accurate assessment of the degree to which a treatment has affected the cord includes both the remaining “damaged” tissue as well as resolved lesioned areas. When we sum the amount of missing tissue and the measured damaged area, we derive an index of the relative lesion (percent relative lesion) in each section that is comparable across sections. We also compute the relative percent of GM and WM remaining in each section, relative to intact controls.
Statistical analyses
Principal components analysis
Principal components analysis (PCA) is a variable reduction technique that transforms a group of observations from a related set of variables into a (typically) smaller set of linear uncorrelated variables. These uncorrelated variables are referred to as principal components. In experiment 1, PCA was used in order to determine which behavioral measures were correlated with each other. Subjects' scores on each of the behavioral measures (SP, forced swim, open-field activity, social exploration, burrowing, and food deviation change) were averaged across days 9–10 and 19–20 and then subjected to a PCA using orthogonal Varimax rotation. Scores were averaged so that the equation derived in subsequent analyses would characterize symptoms that persisted into the chronic phase as well as having strong predictive value for the early phase of SCI. Factors with loadings of ≥0.32 on a component were retained and used in subsequent cluster and discriminant function analyses. Variables with a complex structure, which loaded onto more than one component, were removed from the PCA and the analysis was repeated.47
Cluster analysis
Hierarchical cluster analysis is a statistical procedure used to separate a sample into clusters that the experimenter can operationally define. A hierarchical cluster analysis was performed using the measures with moderate-to-strong loadings on the components retained in the PCA. Specifically, average scores (derived from both days 9–10 and 19–21), on each of the retained behavioral tests, were first standardized by z scores. Then, hierarchical cluster analysis was performed using Ward's method and applying squared Euclidean distance as the distance measure. The number of appropriate clusters (2) based on the behavioral measures was obtained by looking for a break in the agglomeration coefficient change and by observing the dendrogram (shown in Fig. 2), which visually depicts the distance between linked clusters. It must be noted that the cluster sizes need not be even. The cluster analysis was repeated using the same parameters, but requesting a single solution of two clusters. A new variable, cluster membership was generated for all subjects.
FIG. 2.

The dendogram depicts the results of the hierarchical cluster analysis separating the groups into two clusters based on the average of subjects' performances in the acute and chronic phase of injury on each behavioral test. The numbers on the y-axis of the figure denote the individual subjects. As shown, one cluster was comprised of 9 of the subjects, with the remaining 17 subjects in a second cluster.
The two clusters' performance on each of the behavioral measures collected (depression and recovery) were compared across the recovery period (days 9–10 and 19–20) using repeated-measures analysis of variance (ANOVA) tests. Baseline scores were used as a covariate when significant (p<0.05). Based on the pattern of behaviors exhibited by each cluster, they were labeled as “depressed” and “not depressed.”
Discriminant function analysis
A two-group discriminant function analysis was performed to develop an equation that could be used to predict depression membership in the acute recovery phase for experiment 2. Discriminant analysis is a statistical test used to determine which continuous variables best distinguish two or more naturally occurring groups. It generates a function using an optimal combination of the variables and coefficients that can be used to predict group membership. A discriminant function analysis compared the two groups defined by the hierarchical cluster analysis on the behavioral measures retained after the PCAs. The structure matrix produced was examined. The matrix gives the standardized beta coefficients as an indication of the contribution each variable makes to the discrimination equation. Behavioral measures with a coefficient <0.3 were removed from the analysis one by one, starting with the measure with the smallest coefficient. When all measures had standardized beta coefficients ≥0.3, the discriminant equation was retained.
Discriminant function scores were referred to as “depression scores.” Subjects were classified as depressed or not depressed based on whether their depression score was closer to the mean group value (centroid value) derived for the original depressed or nondepressed clusters. Discriminant function classification equations were used to identify depressed subjects in experiment 2, and groups were compared using repeated-measures ANOVA, as described above.
Results
Experiment 1
Principal component analyses: assessment of test validity for identifying depression
The PCA produced two components, which cumulatively explained 72.2% of the variance between subjects. The first component contained both of the widely accepted measures of depressive-like behavior: the FST and SPT (see Table 2). Open-field activity and social exploration loaded on the second component. Both components had eigenvalues greater than 1 and explained a significant proportion of the variance between subjects. They were retained for subsequent analyses. Burrowing did not load significantly on either component and was not used in subsequent cluster and discriminant function analyses (DFAs).
Table 2.
Principal Component Loadings
| Behavioral test | Component 1 | Component 2 |
|---|---|---|
| Sucrose preference | 0.829 | |
| Forced swim test | −0.900 | |
| Open-field activity | 0.727 | |
| Social exploration | 0.841 |
Rotated using orthogonal Varimax rotation with Kaiser normalization. Only component loadings>0.3 are shown.
Hierarchical cluster analyses: classification of depressed/not depressed subjects
Average scores (derived from both days 9–10 and 19–21), for each of the behavioral tests retained in the PCA analysis, were used in the hierarchical cluster analysis. The dendrogram produced by this analysis clearly showed that subjects separated into two clusters, with 9 subjects in one cluster and 17 in the other (Fig. 2). To determine the behavioral pattern characteristic of the clusters, the two groups were compared on each of the depression measures across days 9–10 and 19–21. Based on a decreased SP, decreased open-field activity, decreased social exploration and burrowing, and increased immobility in the FST, subjects in cluster 1 were labeled as “depressed” and subjects in cluster 2 were labeled as “not depressed.” Therefore, 9 of 26 subjects (35%) were found to exhibit depression-like symptoms.
First, a repeated-measures ANOVA revealed that clusters differed significantly on SP throughout the recovery period (F(1, 25)=7.99; p<0.01; Fig. 3A). Baseline SP scores were not significant covariates for performance on this or later tests. Subsequent ANOVAs, comparing SP on days 9–10 and 19–21 separately, confirmed that cluster 1 (depressed) displayed a lower SP than cluster 2 (not depressed) in both test periods, although the difference only approached significance at the latter time point (F(1, 24)=8.60, p<0.01; F(1, 24)=3.56, p=0.07; on days 9–10 and 19–21, respectively). Cluster 1 displayed anhedonia, characteristic of depression.
FIG. 3.

The average (±standard error of the mean) performance of the depressed and not depressed groups are shown on each task. Depressed subjects displayed significant anhedonia (decreased sucrose preference, A) and decreased open-field activity (B), relative to the not depressed group, in both the acute (days 9–10) and chronic (days 19–21) phases of injury. Depressed subjects also displayed significantly lower levels of social exploration in the acute phase of injury (C) and burrowing in the chronic phase of injury (D). Although effects were not significant, depressed subjects displayed higher levels of appetite deviation (E) and increased immobility on the forced swim test (F), both indicators of depression-like behavior. **p<0.05.
A repeated-measures ANOVA also revealed that clusters differed significantly for open-field activity throughout the recovery period (F(1, 25)=10.22; p<0.005). Baseline scores were not a significant covariate for this measure and did not differ across groups before injury (F(1, 24)<1.0; p>0.05). As seen in Figure 3B, however, cluster 1 (depressed) crossed into fewer squares per second than cluster 2 in both test periods (F(1, 24)=7.69, p<0.05; F(1, 24)=5.36, p<0.05; on days 9–10 and 19–21, respectively). Clusters 1 and 2 also displayed significantly different levels of social exploration, when compared on days 9 and 19 alone (F(1, 24)=23.61, p<0.0001; F(1, 24)=4.68, p<0.05; on days 9–10 and 19–21, respectively; Fig. 3C), but there was no significant difference across groups, when compared with a repeated-measures ANOVA across both time points. Baseline scores were not a significant covariate for social exploration. For burrowing, baseline scores were a significant covariate (F(1, 23)=8.94; p<0.01) and were used in the repeated-measures ANOVA across test sessions. This ANOVA also revealed that the clusters differed significantly for burrowing throughout the recovery period (F(1, 23)=6.82; p<0.05). For this measure, the depressed cluster displayed significantly less burrowing than the not-depressed cohort in the chronic, but not acute, phase of injury (F(1, 24)=2.34, p>0.05; F(1, 23)=9.06, p<0.01; on days 9–10 and 19–21, respectively; Fig. 3D).
There was no effect of depression on food consumption or appetite deviation, calculated as an average change from preinjury food consumption, in either the acute or chronic periods of recovery (Fig. 3E). Also, whereas cluster 1 displayed more immobility than cluster 2 in the FST (as shown in Fig. 3F), the difference across the groups was not significant (F(1, 24)=3.06; p=0.09).
Discriminant function analyses: generating an equation to identify depression
Commensurate with the ANOVA results, the DFAs indicated that at days 9–10, SP, open-field activity, and social exploration defined the depressed and not-depressed groups (structure matrix correlations, >0.3). Wilk's lambda tests confirmed that the depressed and not-depressed clusters did not have identical means, and the equation was acceptable for classifying subjects (λ=14.74; p<0.01). Using the canonical discriminant function coefficients, the following equation was generated to predict group membership at days 9–10:
 |
where SP is sucrose preference, SE is social exploration, and OFA is open-field activity for the acute phase/days 9–10 of injury.
This equation concurs with the cluster analysis, correctly classifying 92.3% of subjects as either depressed or not depressed. Subjects are labeled as depressed or not depressed in accord with the cluster center that their depression classification score is closest to. Therefore, based on the depression scores generated, subjects would be categorized as depressed if their score was closer to the mean for the original depressed cluster (mean, −1.714) and nondepressed if it was closer to the mean for the original nondepressed cluster (mean, 0.907). This classification equation was used to categorize subjects in experiment 2.
Assessment of recovery and general health
Additional measures of sensory and locomotor function were examined for any effects of depression on recovery of function after SCI. An analysis of covariance (ANCOVA) (with day 1 scores as a significant covariate) revealed no effect of depression on locomotor recovery, as measured with the BBB scale (F(1, 23)=1.97; p>0.05; Fig. 4A). There was also no effect of depression group on weight loss or gain (F(1, 24)<1.0; p>0.05). There was, however, a significant effect of group on girdle reactivity in the acute phase of injury (F(1, 24)=12.47; p<005). Depressed subjects displayed significantly greater reactivity than nondepressed subjects at day 4 postinjury. However, it is noted that reactivity was minimal for both groups (the depressed group vocalized for 2.44±0.84 of 44 stimulations, whereas the nondepressed group vocalized 0.24±0.14 times). There were no other significant effects of depression on sensory or pain reactivity measured with the tail-flick and paw withdrawal tests on days 4 or 22 postinjury and no effect of depression at day 22 on the girdle test.
FIG. 4.
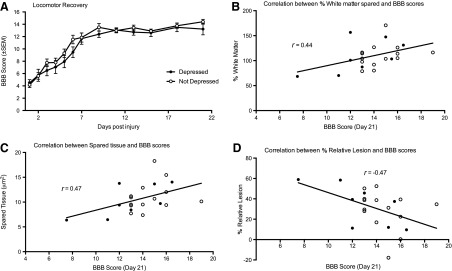
There were no significant differences between the levels of recovery of locomotor function displayed by depressed (black circles) and not depressed (white circles) rats across the 21-day assessment period (A). Locomotor recovery was, however, significantly correlated with the percent white matter spared (B), tissue spared overall (C), and the percent relative lesion (D) at the lesion epicenter. The line of best fit depicts the correlation for the total sample, irrespective of depression cohort. BBB, Basso, Beattie, and Bresnahan scale.
Pearson-product moment correlations were used to further examine potential relationships between motor/sensory function and depression-like behavior. No significant correlations were found. There was no correlation between locomotor scores, assessed with the BBB scale, and performance on any of the depression tests (–0.31>rs<0.31 for all analyses; p>0.05). Similarly, there was no relationship between depression scores, calculated using the canonical discriminant function equation at day 9 and day 9 BBB scores (r=0.07; p>0.05). Sensory reactivity scores, collected with the tail-flick, tactile, and girdle tests, were also not correlated with the overall depression scores derived at day 9 postinjury (–0.35>rs<0.28 for all analyses; p>0.05) or with performances on any of the individual tests of depression-like symptoms (–0.22>rs<0.34 for all analyses; p>0.05).
Histology
Spared tissue (GM and WM) as well as percent relative lesion (damaged and missing) were assessed at the end of the recovery period. There were no significant differences between depressed and nondepressed groups on any of the histological measures: GM and WM sparing, percent relative lesion, percent damage, and percent missing (all Fs<1.0; p>0.05).
Pearson-product moment correlations were also calculated to determine the relationships between the extent of the lesion and performance on the tests of depression as well as measures of recovery (motor and sensory/pain tests). There were no correlations between the histological indices and performance on any of the tests of depression or the overall depression score calculated with the canonical discriminant function (–0.29>rs<0.30 for all analyses; p>0.05). Locomotor recovery, measured with the BBB scale, however, was significantly correlated with WM sparing (r=0.44; p<0.05), spared tissue (r=0.47; p<0.05), and percent relative lesion (r=–0.47; p<0.05). These correlations are depicted in Figure 4B–D. There were no correlations between histological measures of injury and pain reactivity measured with the tail-flick, paw withdrawal, or girdle tests (–0.40>rs<0.26 for all analyses; p>0.05).
Experiment 2
Assessment of depression: effects of fluoxetine
Using the equation generated in experiment 1, 39% (14 of 36 tested in experiment 2 alone) of subjects displayed significant depression-like behavior on days 9–10 postinjury. ANOVAs (using baseline scores as a covariate when significant) confirmed that subjects categorized as depressed displayed significantly lower SP (F(1, 33)=30.97; p<0.0001) and social exploration (F(1, 34)=23.21; p<0.0001) scores in the acute phase of injury (Fig. 5).
FIG. 5.

As found in experiment 1 subjects identified as depressed, with the depression equation, in Experiment 2 displayed significant anhedonia (A) and decreased social exploration (B), relative to the not depressed group, in the acute (days 9–10) phase of injury. **p<0.05.
Beginning on day 14 postinjury, approximately one half of the subjects in each of the depressed/nondepressed cohorts began daily injections of fluoxetine (5 mg/kg, i.p.), with the remaining subjects receiving daily injections of saline. The fluoxetine and vehicle treatment groups were not significantly different on any of the behavioral indices of depression measured on days 9–10 (before the initiation of drug treatment). When assessed on day 31, however, the FST revealed a significant main effect of drug treatment (F(1, 32)=13.53; p<0.001) and an effect of depression (F(1, 32)=11.69; p<0.005). Comparisons between depressed and nondepressed subjects treated with vehicle revealed a significant effect of depression at this time point, with depressed subjects displaying significantly more time immobile (F(1, 16)=9.99; p<0.01). For the fluoxetine-treated subjects, however, there were no differences between previously depressed and nondepressed subjects (F(1, 16)=3.13; p>0.05). Fluoxetine appeared to reverse this depression-like symptom after SCI (Fig. 6D).
FIG. 6.

There was no effect of fluoxetine on depression-like symptoms expressed on the sucrose preference task (A) or for social exploration (B) or open-field activity (C). Despite treatment with the antidepressant, contused subjects diagnosed as depressed continued to display signs of anhedonia and reduced social exploration and open-field activity during testing in the chronic phase. Fluoxetine treatment, however, reduced immobility time, and there was no significant difference between time immobile in the fluoxetine-treated depressed and not depressed subjects in the chronic phase of injury. (D) Depressed subjects treated with saline displayed more time immobile on the forced swim task, compared to the not depressed subjects.
There was no effect of drug treatment, however, on SP or other indices of depression-like symptoms. On days 29–30, there was a significant main, albeit small, effect of depression on sucrose preference (F(1, 31)=6.86; p<0.05), but no effects of drug treatment (Fig. 6A). There was also a main effect of depression on social exploration (F(1, 32)=8.72; p<0.01; Fig. 6C), with no effect of drug treatment (F(1, 32)=2.37; p>0.05). For social exploration, however, there was also a significant drug×depression interaction (F(1, 32)=5.20; p<0.05). Interestingly, fluoxetine treatment appeared to reduce social exploration in the depressed subjects, relative to all other groups (Fig. 6C). Similarly, there was a significant drug×depression interaction for open-field activity (F(1, 32)=5.41; p<0.05), with reduced exploration in the fluoxetine-treated depressed subjects (Fig. 6B). No significant main effects of depression or drug treatment were observed for open-field activity (depression, F(1, 32)=3.33, p>0.05; drug, F(1, 32)<1.0, p>0.05). There were no significant main effects (or interactions) for depression or drug treatment on burrowing (depression, F(1, 31)<1.0, p>0.05; drug, F(1, 31)=1.34; p>0.05) or appetite deviation assessed from days 12–31 (depression, F(1, 32)<1.0, p>0.05; drug, F(1, 32)<1.0, p>0.05).
Assessment of recovery and general health
In addition to efficacy in reversing depression, we examined potential effects of fluoxetine on recovery of locomotor and sensory function as well as weight gain after injury. As found in experiment 1, there was no effect of depression, diagnosed in the acute phase of injury, on recovery of locomotor function (ANCOVA) with day 1 as a significant covariate (F(1, 31)<1.00; p>0.05; Fig. 7A). There was also no effect of drug treatment or an interaction between drug treatment and depression diagnosis for locomotor recovery (days 15–28), using day 13 as a covariate in the analyses (F(1,31)<1.48 in both analyses; p>0.05). Similarly, fluoxetine treatment did not significantly affect weight gain or loss after injury, and there was no effect of depression on weight loss in this experiment (F(1, 31)<2.02; p>0.05 in all analyses).
FIG. 7.

There were no significant differences between levels of recovery of locomotor function displayed by depressed (black symbols) and not depressed (white symbols) rats across the 27-day assessment period and no effect of fluoxetine on recovery (A). For this experiment, open-field activity was significantly correlated with BBB scores at day 27 postinjury (B). However, this correlation was not selective to one depression or drug cohort. Depressed and not depressed, as well as fluoxetine (square symbols) or vehicle-treated (circle symbols), subjects were represented across the range of BBB and open-field activity scores. For sensory function, there was a significant correlation between tactile reactivity on day 32 and immobility on the forced swim test on day 31 (C). Again, this correlation was not selective to one depression or drug cohort: Both depressed and not depressed, as well as fluoxetine or vehicle-treated, subjects were represented across the range of tactile thresholds recorded. The line of best fit depicts the correlation for the total sample, irrespective of depression or drug treatment. BBB, Basso, Beattie, and Bresnahan scale; SEM, standard error of the mean; FST, forced swim test.
For sensory function, there was no main effect of depression (F(1,32)<1.0; p>0.05) or fluoxetine treatment (F(1,32)=3.54; p>0.05) on tail-flick latency, but there was a significant depression×drug treatment interaction (F(1,32)=4.30; p<0.05). Fluoxetine decreased tail-flick latencies in depressed subjects, relative to all other groups. No significant effects of depression or drug treatment were found on either the tactile or girdle tests of mechanical reactivity.
As in experiment 1, Pearson-product moment correlations were used to further examine the relationships between motor/sensory function and depression-like behavior. For this experiment, there was a significant correlation between open-field activity on day 29 and BBB scores collected on day 27 postinjury (r=0.48; p>0.05; Fig. 7B). BBB scores were not correlated with performance on any other test of depression (–0.03>rs<0.32 for all analyses; p>0.05) nor were they correlated with the overall depression score generated with the canonical discriminant function (r=0.11; p<0.05).
For sensory function, there was also a significant correlation between tactile reactivity and immobility on the FST (r=0.49; p>0.05; Fig. 7C). However, the relationship was opposite to that expected between pain and depression; as tactile reactivity decreased, immobility increased. There were no other significant correlations between sensory/pain reactivity (tail-flick or girdle test) and performances on the tests of depression (–0.20>rs<0.26 for all analyses; p>0.05). There was also no correlation between the overall depression scores, calculated with the canonical discriminant function, and sensory function measured on any of the tests (–0.18>rs<0.05 for all analyses; p>0.05).
Discussion
Based on the battery of tests, and subsequent statistical analyses, commonly used to measure depression-like symptoms in rodents, we determined that approximately 35% of subjects with an SCI display characteristics of depression. This estimate derived from hierarchical cluster analysis in experiment 1 was similar to the incidence derived for the second set of subjects (39%) using the discriminant function equation in experiment 2. In each experiment, depressed subjects displayed a decreased SP (anhedonia), decreased social exploration, and increased immobility on the FST. Fluoxetine reversed the symptoms of depression on the FST. However, the effects of fluoxetine appear to be task specific, and fluoxetine did not reverse depression-like symptoms in the SP or social exploration tasks.
Compared to the clinical incidence of depression,6 an incidence of 35–39% depression in the contused rodent population seems quite high.1,2,5,6 However, it is comparable to figures summating the clinical incidence of MDD (11–24%) and patients exhibiting depression without MDD (16–34%). Indeed, the depression equation, developed in experiment 1, produced depression scores in experiment 2 that ranged from −4.22 to 2.67, with the more-negative numbers indicative of depression. The scores and incidences derived therefore represent the underlying spectrum of depression, with some subjects expressing more symptoms of depression than others, as is observed in the clinical population.25 Further, supporting the validity of this approach, even with the small group sizes reported in these initial studies, we found reversal of depression diagnosed with the pilot equation in experiment 2 for the FST, a standard screen of antidepressant efficacy.48,49 The depression identified with the equation, therefore, meets the criterion proposed by McKinney and Bunney.14 Depression symptoms are 1) reasonably analogous to those observed in humans, 2) replicable, and 3) are reversed by fluoxetine, a drug that is also effective in attenuating depression in humans. The results obtained with this preliminary equation suggest that the behavioral and statistical methods outlined above could be applied to a larger data set to generate reliable relative depression scores that would be invaluable in the investigation of relationships between molecular changes and behavioral indices of depression-like symptoms.
Importantly, for an SCI model, the characterization of depression did not depend on motor recovery. Overall, locomotor function assessed with the BBB scale did not differ between depressed and nondepressed cohorts, and there was no effect of fluoxetine treatment on recovery of function. We also found no correlations between measures of depression and locomotor scores, in experiment 1, and only one correlation between open-field activity and BBB scores in experiment 2. The interaction between open-field activity and the BBB scores is not surprising, given that open-field activity is an index of distance traversed in a fixed amount of time. Indeed, the absence of a correlation in experiment 1 was probably a result of the high level of locomotor recovery across all subjects, with all but 1 subject displaying frequent coordinated stepping. In experiment 2, recovery was more variable (range, 8–15 on the BBB scale), which would enable identification of a correlation. Despite this, however, the other tests of depression did not correlate with locomotor function. Moreover, there was no correlation between tissue sparing, or the inverse percent relative lesion, and the measures of depression. Nonetheless, tissue sparing and lesion volume were correlated with locomotor function at the end of recovery, which is commensurate with the original findings of Basso and colleagues.42 These histological analyses therefore support the validity of the T12 contusion model and, with no correlation to the tests of depression, suggest that sparing of the spinal cord tissue is not related to depression assessment outcomes.
Similarly, measures of sensory reactivity were not, for the most part, correlated with the outcomes observed on the tests of depression or the overall depression scores generated with the canonical discriminant function. One significant correlation did emerge, however, between paw withdrawal thresholds and immobility on the FST in experiment 2. Interestingly, the correlation was opposite to what would be expected if depression was potentiated by pain; it appears that increased sensory reactivity is associated with less immobility or more swimming. As depicted in Figure 7, this correlation was not attributable to one drug treatment or depression cohort. Subjects in each drug and depression cohort were represented across the range of tactile thresholds recorded. Moreover, the absence of correlations for either measure (paw withdrawal thresholds and immobility on the FST) and open-field activity or BBB scores also suggests that this correlation is not driven by an improvement in motor function per se. However, it is possible that the correlation between tactile reactivity and swimming time might reflect subtle sparing of specific spinal tracts related to sensorimotor functions that are not fundamental to walking. Indeed, Smith and colleagues50 found a correlation between spared WM at the SCI epicenter and swimming ability assessed with the Louisville Swim Scale. Whereas the FST after a contusion injury relies on forelimb function primarily,50 any spared hindlimb function would facilitate swimming. Relationships between tract sparing and specific sensorimotor functions need to be further evaluated. A second potential explanation is that this correlation may be the result of the induction of “stress-induced analgesia” with increased learned helplessness (greater immobility) generating a form of analgesia. Indeed, the FST is considered to be a stressor, and it was conducted 24 h before the tactile reactivity test. However, this hypothesis would be discounted by studies that indicate that analgesic responses to an acute stressor dissipate in less than 1 h.51,52 In sum, though this correlation is intriguing, it is clear that increased pain reactivity or sensory function does not appear to potentiate depression or modulate the effects of fluoxetine. Based on the overall pattern of results, spared sensorimotor function is not affecting the categorization of depression-like behavior, using the battery of tests described, after SCI.
Although fluoxetine reversed symptoms of depression on the FST, it must also be acknowledged that the effects were task specific. Fluoxetine did not reverse symptoms of depression expressed in the SP or social exploration tasks. The selective reversal of behavioral symptoms indicates that depression in this model is not completely explained by serotonergic dysfunction. Instead, as suggested by Anisman and Merali, we posit that symptoms of depression may be differentially modulated by the type of cytokine expression that precipitates supraspinal changes.53 Learned helplessness (immobility in the FST) is increased by systemic interferon-alpha administration, which reduces 5-HT-mediated neuronal activity and synthesis, thereby rendering an SSRI, such as fluoxetine, an effective treatment.54–57 By contrast, interleukin-2 (IL-2) produces symptoms of anhedonia in rats responding for rewarding electrical stimulation of the nucleus accumbens.58 Systemic IL-2 treatment also appears to inhibit the release of dopamine while increasing norepinephrine and 5-HT release from the hippocampus and nucleus accumbens.59 A dopamine agonist may be an alternative to antidepressants for treatment of anhedonic symptoms. Based on these data, we propose that the differential expression of the specific cytokines will underlie the manifestation of distinct symptoms of depression. According to this hypothesis, the subtype of depression expressed may be more complex than atypical versus typical depressive disorder and, depending on the etiology, will require discrete therapeutic management. The establishment of a protocol for assessing depression after SCI in the rodent contusion model will allow us to systematically assess the necessity and sufficiency of specific proinflammatory cytokines in conjunction with behavioral indices of depression.
Indeed, differing patterns of cytokine expression are characteristic of the human SCI population. Hayes and colleagues60 noted that the chronic active immunoreactivity was restricted to a subset of patients with SCI. They reported that 24% of SCI patients had significantly elevated serum levels of proinflammatory (IL-2 and tumor necrosis factor alpha [TNF-α]) cytokines 1 year after injury, 8% had elevated levels of anti-inflammatory cytokines (IL-4 and IL-10), and 8% displayed elevated levels of both pro- and anti-inflammatory cytokines.60 Similarly, Davies and colleagues61 reported that approximately 25% of SCI patients had elevated levels of IL-6 or TNF-α in the postacute (2–52 weeks) to chronic (greater than 52 weeks) stage of injury. Therefore, not all SCI patients exhibit ongoing humoral immunity, or the same pattern of cytokine expression, but there is a subset that may be increasingly vulnerable to the development of depression mediated by excitation of the immune system. Though the parallels between elevated Th1-like immune activation in depression and SCI are not evidence of a causative relationship, they warrant further investigation. As suggested for the animal model, effective clinical therapies for managing depression after SCI may depend on the pattern of cytokine expression.
Although we have argued that the potentiation of depression-like symptoms in the rodent model of SCI might be a result of excitation of the immune system, it is recognized that many of the molecular changes linked to depression are typical in the pathophysiological response to spinal trauma. We know that levels of IL-1β, TNF-α, and IL-6 are up-regulated in the acute phase of SCI, and, though there is likely variation in the degree of expression (with injury severity), it would be difficult to claim that this variation denotes whether a subject with similar injuries develops depression.62 In fact, increased levels of IL-1β and TNF-α have been linked to allodynia and decreased motor recovery in experimental models of SCI, but we found no differences in pain reactivity or locomotor recovery across the depressed and nondepressed groups.63,64 One could argue that the presence of chronic subclinical infections, that are difficult to observe in rodents, might lead to a synergism between injury and infection-mediated systemic immune responses that precipitate depression, but this remains to be investigated. Moreover, other molecular changes associated with depression, such as decreased brain-derived neurotrophic factor (BDNF) levels and changes in glucocorticoid expression, are also observed in spinal tissue after injury.65–73 Fumagalli and colleagues74 also reported that SCI reduced hippocampal expression of BDNF messenger RNA levels for at least 7 days after injury, and elevations in serum corticosterone levels appear within 24 h after a mid-thoracic (T9) contusion injury persisting for at least 1 month after injury.75,76 Whereas there is evidence that BDNF and corticosterone levels are modulated by cytokines, it is also possible that changes in the levels of BDNF and corticosterone after SCI affect psychological well-being through processes independent of proinflammatory cytokine expression.77
The individual variability in the expression of depression-like symptoms clearly requires further investigation. Despite the fact that rodent models are developed for homogeneity across subjects reducing confounding variables, such as genetic modifications and experiential factors (injury variables, individual epigenetic variability, and social housing conditions), that are known to affect depression-like behavior in rodents, there are clear differences in the expression of depression-like behaviors.78–80 The evidence of depression in some subjects, but not others, is intriguing, but is commensurate with the human clinical condition. Indeed, in both human and animal populations, it is clear that not all individuals display all of the symptoms, or even the same constellation of symptoms, of depression.81 Subjective responses to experimental testing, handling, or even housing environments (routine husbandry procedures with disruption of the light-dark cycle) might significantly influence the expression of depression-like symptoms at both a molecular and behavioral level. The effects of social and environmental manipulations on depression-like behavior should be assessed in future studies. The paradigm reported here provides methods for assessment of depression in the rodent model of SCI that incorporate multiple behavioral tests to assess a range of symptoms that characterize human depressive illnesses. This comprehensive approach will enable detailed evaluations of molecular changes that are associated with depression and can be utilized for deriving the proximate causes of depression while controlling confounding distal, experiential factors.
Understanding the molecular changes associated with, and possibly precipitating, depression after SCI will have a significant clinical effect. First, it will alter the clinical management of depression in this population. Serum levels of proinflammatory cytokines, or other biomarkers, could be used to pinpoint antidepressants that are likely to alleviate individual depression symptoms. Second, based on the idea that depression might result from an imbalance between T-helper (Th)1 and Th2 responses, one might envisage treating patients with IL-4 or IL-10 to tip the balance away from the proinflammatory biased Th1 response toward a more Th2-like response. Reducing inflammation may be beneficial after SCI on multiple fronts. However, it is first critical to assess the timing and nature of changes in animal models of SCI. Importantly, it should also be noted that there have been no systematic analyses of the side effects of commonly used antidepressants after SCI. Based on the experimental data reported here, fluoxetine, a commonly prescribed antidepressant therapy, does not appear to undermine sensory or motor recovery after SCI in the rodent model. There is, in fact, evidence that fluoxetine facilitates locomotor recovery when administration is initiated immediately after SCI by inhibiting matrix metalloprotease activation, preventing blood–spinal cord barrier disruption, and reducing proinflammatory cytokine expression.30 Although a beneficial effect of fluoxetine was not observed in the current study, when treatment was initiated in a more chronic phase of injury, no adverse effects of drug treatment were observed. Finally, recognizing that reduced psychological well-being after SCI is not purely cognitive, and a reflection of character, will change the stigma and attitudes associated with depression. This, in itself, may prove beneficial by alleviating some of the social stress placed on the individual with diagnosis of this disease. Indeed, the role of cognitive factors in depression is not explained by the molecular underpinnings. Ultimately, a better understanding of modifiable risk factors underlying depression in people with SCI could lead to the development of more-effective interventions to treat these symptoms.
Acknowledgments
We thank James Grau, Sandra Garraway, Adam Ferguson, and Kuan H. Lee for their comments on an earlier draft of this article. These experiments were supported by DA 031197 (to M.H.). A portion of the data from this study has been previously presented in abstract form.
Author Disclosure Statement
No competing financial interests exist.
References
- 1.Krause J.S., Kemp B., and Coker J. (2000). Depression after spinal cord injury: relation to gender, ethnicity, aging, and socioeconomic indicators. Arch. Phys. Med. Rehabil. 81, 1099–1109 [DOI] [PubMed] [Google Scholar]
- 2.Kessler R.C., Petukhova M., Sampson N.A., Zaslavsky A.M., and Wittchen H.U. (2012). Twelve-month and lifetime prevalence and lifetime morbid risk of anxiety and mood disorders in the United States. Int. J. Methods Psychiatr. Res. 21, 169–184 [DOI] [PMC free article] [PubMed] [Google Scholar]
- 3.Fullerton D.T., Harvey R.F., Klein M.H., and Howell T. (1981). Psychiatric disorders in patients with spinal cord injuries. Arch. Gen. Psychiatry 38, 1369–1371 [DOI] [PubMed] [Google Scholar]
- 4.Frank R.G., Kashani J.H., Wonderlich S.A., Lising A., and Visot L.R. (1985). Depression and adrenal function in spinal cord injury. Am. J. Psychiatry 142, 252–253 [DOI] [PubMed] [Google Scholar]
- 5.Migliorini C.E., New P.W., and Tonge B.J. (2009). Comparison of depression, anxiety and stress in persons with traumatic and non-traumatic post-acute spinal cord injury. Spinal Cord 47, 783–788 [DOI] [PubMed] [Google Scholar]
- 6.Bombardier C.H., Fann J.R., Tate D.G., Richards J.S., Wilson C.S., Warren A.M., Temkin N.R., and Heinemann A.W. (2012). An exploration of modifiable risk factors for depression after spinal cord injury: which factors should we target? Arch. Phys. Med. Rehabil. 93, 775–781 [DOI] [PubMed] [Google Scholar]
- 7.Smith R.S. (1991). The macrophage theory of depression. Med. Hypotheses 35, 298–306 [DOI] [PubMed] [Google Scholar]
- 8.Maes M. (1999). Major depression and activation of the inflammatory response system. Adv. Exp. Med. Biol. 461, 25–46 [DOI] [PubMed] [Google Scholar]
- 9.Krueger H., Noonan V.K., Williams D., Trenaman L.M., and Rivers C.S. (2013). The influence of depression on physical complications in spinal cord injury: behavioral mechanisms and health-care implications. Spinal Cord 51, 260–266 [DOI] [PubMed] [Google Scholar]
- 10.Bombardier C.H., Richards J.S., Krause J.S., Tulsky D., and Tate D.G. (2004). Symptoms of major depression in people with spinal cord injury: implications for screening. Arch. Phys. Med. Rehabil. 85, 1749–1756 [DOI] [PubMed] [Google Scholar]
- 11.de Carvalho S.A., Andrade M.J., Tavares M.A., and de Freitas J.L. (1998). Spinal cord injury and psychological response. Gen. Hosp. Psychiatry 20, 353–359 [DOI] [PubMed] [Google Scholar]
- 12.Kishi Y., Robinson R.G., and Kosier J.T. (2001). Suicidal ideation among patients with acute life-threatening physical illness: patients with stroke, traumatic brain injury, myocardial infarction, and spinal cord injury. Psychosomatics 42:382–390 [DOI] [PubMed] [Google Scholar]
- 13.Hartkopp A., Brønnum-Hansen H., Seidenschnur A.M., and Biering-Sørensen F. (1998). Suicide in a spinal cord injured population: its relation to functional status. Arch. Phys. Med. Rehabil. 79, 1356–1361 [DOI] [PubMed] [Google Scholar]
- 14.McKinney W.T., Jr., and Bunney W.E., Jr. (1969). Animal model of depression. I. Review of evidence: implications for research. Arch. Gen. Psychiatry 21, 240–248 [DOI] [PubMed] [Google Scholar]
- 15.APA. (1994). Diagnostic and Statistical Manual of Mental Disorders, Fourth Edition (DSM-IV). American Psychiatric Association: Arlington, VA [Google Scholar]
- 16.Jones N.C., Salzberg M.R., Kumar G., Couper A., Morris M.J., and O'Brien T.J. (2008). Elevated anxiety and depressive-like behavior in a rat model of genetic generalized epilepsy suggesting common causation. Exp. Neurol. 209, 254–260 [DOI] [PubMed] [Google Scholar]
- 17.Fromm L., Heath D.L., Vink R., and Nimmo A.J. (2004). Magnesium attenuates post-traumatic depression/anxiety following diffuse traumatic brain injury in rats. J. Am. Coll. Nutr. 23, 529S–533S [DOI] [PubMed] [Google Scholar]
- 18.Lamkin D.M., Lutgendorf S.K., Lubaroff D., Sood A.K., Beltz T.G., and Johnson A.K. (2010). Cancer induces inflammation and depressive-like behavior in the mouse: modulation by social housing. Brain Behav. Immun. 25, 555–564 [DOI] [PMC free article] [PubMed] [Google Scholar]
- 19.Pyter L.M., Pineros V., Galang J.A., McClintock M.K., and Prendergast B.J. (2009). Peripheral tumors induce depressive-like behaviors and cytokine production and alter hypothalamic-pituitary-adrenal axis regulation. Proc. Natl. Acad. Sci. U. S. A. 106, 9069–9074 [DOI] [PMC free article] [PubMed] [Google Scholar]
- 20.Hilakivi-Clarke L.A., Wozniak K.M., Durcan M.J., and Linnoila M. (1990). Behavior of streptozotocin-diabetic mice in tests of exploration, locomotion, anxiety, depression and aggression. Physiol. Behav. 48, 429–433 [DOI] [PubMed] [Google Scholar]
- 21.Wang S., Zhang Z., Guo Y., Zhou H., Teng G., and Chen B. (2009). Anhedonia and activity deficits in rats: impact of post-stroke depression. J. Psychopharmacol. 23, 295–304 [DOI] [PubMed] [Google Scholar]
- 22.Minkoff K., Bergman E., Beck A.T., and Beck R. (1973). Hopelessness, depression, and attempted suicide. Am. J. Psychiatry 130, 455–459 [DOI] [PubMed] [Google Scholar]
- 23.Cryan J.F., Page M.E., and Lucki I. (2005). Differential behavioral effects of the antidepressants reboxetine, fluoxetine, and moclobemide in a modified forced swim test following chronic treatment. Psychopharmacology (Berl.) 182, 335–344 [DOI] [PubMed] [Google Scholar]
- 24.Cryan J.F., and Mombereau C. (2004). In search of a depressed mouse: utility of models for studying depression-related behavior in genetically modified mice. Mol. Psychiatry 9, 326–357 [DOI] [PubMed] [Google Scholar]
- 25.Angst J., and Merikangas K. (1997). The depressive spectrum: diagnostic classification and course. J. Affect. Disord. 45, 31–39 [DOI] [PubMed] [Google Scholar]
- 26.Kalpakjian C.Z., and Albright K.J. (2006). An examination of depression through the lens of spinal cord injury. Comparative prevalence rates and severity in women and men. Womens Health Issues 16, 380–388 [DOI] [PubMed] [Google Scholar]
- 27.Raison C.L., and Miller A.H. (2011). Is depression an inflammatory disorder? Curr. Psychiatry Rep. 13, 467–475 [DOI] [PMC free article] [PubMed] [Google Scholar]
- 28.Elliott T.R., and Kennedy P. (2004). Treatment of depression following spinal cord injury: an evidence-based review. Rehabil. Psychol. 49, 134–139 [Google Scholar]
- 29.Anisman H., Merali Z., Poulter M.O., and Hayley S. (2005). Cytokines as a precipitant of depressive illness: animal and human studies. Curr. Pharm. Des. 11, 963–972 [DOI] [PubMed] [Google Scholar]
- 30.Lee J.Y., Kim H.S., Choi H.Y., Oh T.H., and Yune T.Y. (2012). Fluoxetine inhibits matrix metalloprotease activation and prevents disruption of blood-spinal cord barrier after spinal cord injury. Brain 135, 2375–2389 [DOI] [PubMed] [Google Scholar]
- 31.Scali M., Begenisic T., Mainardi M., Milanese M., Bonifacino T., Bonanno G., Sale A., and Maffei L. (2013). Fluoxetine treatment promotes functional recovery in a rat model of cervical spinal cord injury. Sci. Rep. 3, 2217. [DOI] [PMC free article] [PubMed] [Google Scholar]
- 32.Cristante A.F., Filho T.E., Oliveira R.P., Marcon R.M., Ferreira R., and Santos G.B. (2013). Effects of antidepressant and treadmill gait training on recovery from spinal cord injury in rats. Spinal Cord 51, 501–507 [DOI] [PubMed] [Google Scholar]
- 33.Barbeau H., and Rossignol S. (1991). Initiation and modulation of the locomotor pattern in the adult chronic spinal cat by noradrenergic, serotonergic and dopaminergic drugs. Brain Res. 546, 250–260 [DOI] [PubMed] [Google Scholar]
- 34.Ribotta M.G., Provencher J., Feraboli-Lohnherr D., Rossignol S., Privat A., and Orsal D. (2000). Activation of locomotion in adult chronic spinal rats is achieved by transplantation of embryonic raphe cells reinnervating a precise lumbar level. J. Neurosci. 20, 5144–5152 [DOI] [PMC free article] [PubMed] [Google Scholar]
- 35.Fong A.J., Cai L.L., Otoshi C.K., Reinkensmeyer D.J., Burdick J.W., Roy R.R., and Edgerton V.R. (2005). Spinal cord-transected mice learn to step in response to quipazine treatment and robotic training. J. Neurosci. 25, 11738–11747 [DOI] [PMC free article] [PubMed] [Google Scholar]
- 36.Engesser-Cesar C., Anderson A.J., and Cotman C.W. (2007). Wheel running and fluoxetine antidepressant treatment have differential effects in the hippocampus and the spinal cord. Neuroscience 144, 1033–1044 [DOI] [PubMed] [Google Scholar]
- 37.Hook M.A., Moreno G., Woller S., Puga D., Hoy K., Jr., Balden R., and Grau J.W. (2009). Intrathecal morphine attenuates recovery of function after a spinal cord injury. J. Neurotrauma 26, 741–752 [DOI] [PMC free article] [PubMed] [Google Scholar]
- 38.Vazquez-Palacios G., Bonilla-Jaime H., and Velazquez-Moctezuma J. (2005). Antidepressant effects of nicotine and fluoxetine in an animal model of depression induced by neonatal treatment with clomipramine. Prog. Neuropsychopharmacol. Biol. Psychiatry 29, 39–46 [DOI] [PubMed] [Google Scholar]
- 39.Swain M.G., and Le T. (1998). Chronic cholestasis in rats induces anhedonia and a loss of social interest. Hepatology 28, 6–10 [DOI] [PubMed] [Google Scholar]
- 40.Abel E.L., and Bilitzke P.J. (1990). A possible alarm substance in the forced swimming test. Physiol. Behav. 48, 233–239 [DOI] [PubMed] [Google Scholar]
- 41.Porsolt R.D., Bertin A., and Jalfre M. (1977). Behavioral despair in mice: a primary screening test for antidepressants. Arch. Int. Pharmacodyn. Ther. 229, 327–336 [PubMed] [Google Scholar]
- 42.Basso D.M., Beattie M.S., and Bresnahan J.C. (1995). A sensitive and reliable locomotor rating scale for open field testing in rats. J. Neurotrauma 12, 1–21 [DOI] [PubMed] [Google Scholar]
- 43.Christensen M.D., and Hulsebosch C.E. (1997). Chronic central pain after spinal cord injury. J. Neurotrauma 14, 517–537 [DOI] [PubMed] [Google Scholar]
- 44.Beattie M.S. (1992). Anatomic and behavioral outcome after spinal cord injury produced by a displacement controlled impact device. J. Neurotrauma, 9, 157–159 [DOI] [PubMed] [Google Scholar]
- 45.Behrmann D.L., Bresnahan J.C., Beattie M.S., and Shah B.R. (1992). Spinal cord injury produced by consistent mechanical displacement of the cord in rats: behavioral and histologic analysis. J. Neurotrauma 9, 197–217 [DOI] [PubMed] [Google Scholar]
- 46.Grau J.W., Washburn S.N., Hook M.A., Ferguson A.R., Crown E.D., Garcia G., Bolding K.A. and Miranda R.C. (2004). Uncontrollable stimulation undermines recovery after spinal cord injury. J. Neurotrauma 21, 1795–1817 [DOI] [PubMed] [Google Scholar]
- 47.Tabachnick B.G., and Fidel L.S. (2007). Principal Components and Factor Analysis Using Multivariate Statistics (fifth ed.). Pearson Education Inc.: Boston, MA [Google Scholar]
- 48.Petit-Demouliere B., Chenu F., and Bourin M. (2005). Forced swimming test in mice: a review of antidepressant activity. Psychopharmacology (Berl.) 177, 245–255 [DOI] [PubMed] [Google Scholar]
- 49.Perona M.T., Waters S., Hall F.S., Sora I., Lesch K.P., Murphy D.L., Caron M., and Uhl G.R. (2008). Animal models of depression in dopamine, serotonin, and norepinephrine transporter knockout mice: prominent effects of dopamine transporter deletions. Behav. Pharmacol. 19, 566–574 [DOI] [PMC free article] [PubMed] [Google Scholar]
- 50.Smith R.R., Burke D.A., Baldini A.D., Shum-Siu A., Baltzley R., Bunger M., and Magnuson D.S. (2006). The Louisville Swim Scale: a novel assessment of hindlimb function following spinal cord injury in adult rats. J. Neurotrauma 23, 1654–1670 [DOI] [PMC free article] [PubMed] [Google Scholar]
- 51.Li N., Han Z.L., Fang Q., Wang Z.L., Tang H.Z., Ren H., and Wang R. (2012). Neuropeptide FF and related peptides attenuates warm-, but not cold-water swim stress-induced analgesia in mice. Behav. Brain Res. 233, 428–433 [DOI] [PubMed] [Google Scholar]
- 52.Spradley J.M., Davoodi A., Carstens M.I., and Carstens E. (2012). Effects of acute stressors on itch- and pain-related behaviors in rats. Pain 153, 1890–1897 [DOI] [PMC free article] [PubMed] [Google Scholar]
- 53.Anisman H., and Merali Z. (1999). Anhedonic and anxiogenic effects of cytokine exposure. Adv. Exp. Med. Biol. 461, 199–233 [DOI] [PubMed] [Google Scholar]
- 54.Makino M., Kitano Y., Komiyama C., and Takasuna K. (2000). Human interferon-alpha increases immobility in the forced swimming test in rats. Psychopharmacology (Berl.) 148, 106–110 [DOI] [PubMed] [Google Scholar]
- 55.Morikawa O., Sakai N., Obara H., and Saito N. (1998). Effects of interferon-alpha, interferon-gamma and cAMP on the transcriptional regulation of the serotonin transporter. Eur. J. Pharmacol. 349, 317–324 [DOI] [PubMed] [Google Scholar]
- 56.Menkes D.B., and MacDonald J.A. (2000). Interferons, serotonin and neurotoxicity. Psychol. Med. 30, 259–268 [DOI] [PubMed] [Google Scholar]
- 57.Capuron L., Ravaud A., Neveu P.J., Miller A.H., Maes M., and Dantzer R. (2002). Association between decreased serum tryptophan concentrations and depressive symptoms in cancer patients undergoing cytokine therapy. Mol. Psychiatry 7, 468–473 [DOI] [PubMed] [Google Scholar]
- 58.Anisman H., Kokkinidis L., and Merali Z. (1996). Interleukin-2 decreases accumbal dopamine efflux and responding for rewarding lateral hypothalamic stimulation. Brain Res. 731, 1–11 [DOI] [PubMed] [Google Scholar]
- 59.Song C., Merali Z., and Anisman H. (1999).Variations of nucleus accumbens dopamine and serotonin following systemic interleukin-1, interleukin-2 or interleukin-6 treatment. Neuroscience 88, 823–836 [DOI] [PubMed] [Google Scholar]
- 60.Hayes K.C., Hull T.C., Delaney G.A., Potter P.J., Sequeira K.A., Campbell K., and Popovich P.G. (2002). Elevated serum titers of proinflammatory cytokines and CNS autoantibodies in patients with chronic spinal cord injury. J. Neurotrauma 19, 753–761 [DOI] [PubMed] [Google Scholar]
- 61.Davies A.L., Hayes K.C., and Dekaban G.A. (2007). Clinical correlates of elevated serum concentrations of cytokines and autoantibodies in patients with spinal cord injury. Arch. Phys. Med. Rehabil. 88, 1384–1393 [DOI] [PubMed] [Google Scholar]
- 62.Donnelly D.J., and Popovich P.G. (2008). Inflammation and its role in neuroprotection, axonal regeneration and functional recovery after spinal cord injury. Exp. Neurol. 209, 378–388 [DOI] [PMC free article] [PubMed] [Google Scholar]
- 63.Yang L., Jones N.R., Blumbergs P.C., Van Den Heuvel C., Moore E.J., Manavis J., Sarvestani G.T., and Ghabriel M.N. (2005). Severity-dependent expression of pro-inflammatory cytokines in traumatic spinal cord injury in the rat. J. Clin. Neurosci. 12, 276–284 [DOI] [PubMed] [Google Scholar]
- 64.Detloff M.R., Fisher L.C., McGaughy V., Longbrake E.E., Popovich P.G., and Basso D.M. (2008). Remote activation of microglia and pro-inflammatory cytokines predict the onset and severity of below-level neuropathic pain after spinal cord injury in rats. Exp. Neurol. 212, 337–347 [DOI] [PMC free article] [PubMed] [Google Scholar]
- 65.Manji H.K., Drevets W.C., and Charney D.S. (2001). The cellular neurobiology of depression. Nat. Med. 7, 541–547 [DOI] [PubMed] [Google Scholar]
- 66.Huang T.L., Lee C.T., and Liu Y.L. (2008). Serum brain-derived neurotrophic factor levels in patients with major depression: effects of antidepressants. J. Psychiatr. Res. 42, 521–525 [DOI] [PubMed] [Google Scholar]
- 67.Juruena M.F., Cleare A.J., Papadopoulos A.S., Poon L., Lightman S., and Pariante C.M. (2006). Different responses to dexamethasone and prednisolone in the same depressed patients. Psychopharmacology (Berl.) 189, 225–235 [DOI] [PubMed] [Google Scholar]
- 68.Pace T. W., and Miller A. H. (2009). Cytokines and glucocorticoid receptor signaling. Relevance to major depression. Ann. N. Y. Acad. Sci. 1179, 86–105 [DOI] [PMC free article] [PubMed] [Google Scholar]
- 69.King V.R., Bradbury E.J., McMahon S.B., and Priestley J.V. (2000). Changes in truncated trkB and p75 receptor expression in the rat spinal cord following spinal cord hemisection and spinal cord hemisection plus neurotrophin treatment. Exp. Neurol. 165, 327–341 [DOI] [PubMed] [Google Scholar]
- 70.Liebl D.J., Huang W., Young W., and Parada L.F. (2001). Regulation of Trk receptors following contusion of the rat spinal cord. Exp. Neurol. 167, 15–26 [DOI] [PubMed] [Google Scholar]
- 71.Hajebrahimi Z., Mowla S.J., Movahedin M., and Tavallaei M. (2008). Gene expression alterations of neurotrophins, their receptors and prohormone convertases in a rat model of spinal cord contusion. Neurosci. Lett. 441, 261–266 [DOI] [PubMed] [Google Scholar]
- 72.Hyun J.K., Lee Y.I., Son Y.J., and Park J.S. (2009). Serial changes in bladder, locomotion, and levels of neurotrophic factors in rats with spinal cord contusion. J. Neurotrauma 26, 1773–1782 [DOI] [PMC free article] [PubMed] [Google Scholar]
- 73.Garraway S.M., Turtle J.D., Huie J.R., Lee K.H., Hook M.A., Woller S.A., and Grau J.W. (2011). Intermittent noxious stimulation following spinal cord contusion injury impairs locomotor recovery and reduces spinal brain-derived neurotrophic factor-tropomyosin-receptor kinase signaling in adult rats. Neuroscience 199, 86–102 [DOI] [PMC free article] [PubMed] [Google Scholar]
- 74.Fumagalli F., Madaschi L., Caffino L., Marfia G., Di Giulio A.M., Racagni G., and Gorio A. (2009). Acute spinal cord injury reduces brain derived neurotrohic factor expression in rat hippocampus. Neuroscience 159, 936–939 [DOI] [PubMed] [Google Scholar]
- 75.Popovich P.G., Stuckman S., Gienapp I.E., and Whitacre C.C. (2001). Alterations in immune cell phenotype and function after experimental spinal cord injury. J. Neurotrauma 18, 957–966 [DOI] [PubMed] [Google Scholar]
- 76.Lucin K.M., Sanders V.M., Jones T.B., Malarkey W.B., and Popovich P.G. (2007). Impaired antibody synthesis after spinal cord injury is level dependent and is due to sympathetic nervous system dysregulation. Exp. Neurol. 207, 75–84 [DOI] [PMC free article] [PubMed] [Google Scholar]
- 77.Anisman H. (2009). Cascading effects of stressors and inflammatory immune system activation: implications for major depressive disorder. J. Psychiatry Neurosci. 34, 4–20 [PMC free article] [PubMed] [Google Scholar]
- 78.Brenes J.C., and Fornaguera J. (2009). The effect of chronic fluoxetine on social isolation-induced changes on sucrose consumption, immobility behavior, and on serotonin and dopamine function in hippocampus and ventral striatum. Behav. Brain Res. 198, 199–205 [DOI] [PubMed] [Google Scholar]
- 79.Hollis F., Duclot F., Gunjan A., and Kabbaj M. (2011). Individual differences in the effect of social defeat on anhedonia and histone acetylation in the rat hippocampus. Horm. Behav. 59, 331–337 [DOI] [PMC free article] [PubMed] [Google Scholar]
- 80.Berry A., Bellisario V., Capoccia S., Tirassa P., Calza A., Alleva E., and Cirulli F. (2012). Social deprivation stress is a triggering factor for the emergence of anxiety- and depression-like behaviours and leads to reduced brain BDNF levels in C57BL/6J mice. Psychoneuroendocrinology 37, 762–772 [DOI] [PubMed] [Google Scholar]
- 81.Anisman H., and Matheson K. (2005). Stress, depression, and anhedonia: caveats concerning animal models. Neurosci. Biobehav. Rev. 29, 525–546 [DOI] [PubMed] [Google Scholar]