Abstract
Ultrasound imaging often calls for the injection of contrast agents, micron-sized bubbles which echo strongly in blood and help distinguish vascularized tissue. Such microbubbles are also being augmented for targeted drug delivery and gene therapy, by the addition of surface receptors and therapeutic payloads. Unfortunately, conventional production methods yield a polydisperse population, whose nonuniform resonance and drug-loading are less than ideal. An alternative technique, microfluidic flow-focusing, is able to produce highly monodisperse microbubbles with stabilizing lipid membranes and drug-carrying oil layers. However, the published 1 kHz production rate for these uniform drug bubbles is very low compared to conventional methods, and must be improved before clinical use can be practical. In this study, flow-focusing production of oil-layered lipid microbubbles was tested up to 300 kHz, with coalescence suppressed by high lipid concentrations or inclusion of Pluronic F68 surfactant in the lipid solution. The transition between geometry-controlled and dripping production regimes was analysed, and production scaling was found to be continuous, with a power trend of exponent ~5/12 similar to literature. Unlike prior studies with this trend, however, scaling curves here were found to be pressure-dependent, particularly at lower pressure-flow equilibria (e.g. <15 psi). Adjustments in oil flow rate were observed to have a similar effect, akin to a pressure change of 1–3 psi. This analysis and characterization of high-speed dual-layer bubble generation will enable more-predictive production control, at rates practical for in vivo or clinical use.
Introduction
Ultrasound, a medical imaging modality, works by emitting low-MHz sonic pulses into tissue and processing the echoes to generate images.1,2 Unlike X-ray and CT, the equipment does not employ ionizing radiation, and is relatively inexpensive and portable; A wheeled unit costs up to $250,000, compared to $1.5–2.5 million for a stationary CT or MRI scanner.3 Ultrasound imaging is also real-time, enabling video capture of rapid phenomena such as a patient’s heartbeat and blood flow. In cases where the image is unclear due to target depth or tissue composition (~20% of echocardiograms4), ultrasound contrast agents (UCAs) can be injected to enhance blood visibility.
Commercial UCAs have been approved for clinical use in more than 50 countries,5 including Definity (Lantheus Medical Imaging) and Optison (GE Healthcare) in the United States, Sonovue (Bracco Imaging) in Europe, and Sonazoid (GE Healthcare) in Japan. Modern contrast-enhanced ultrasound relies on the ability of the ultrasound device to detect gas-filled microbubbles, stabilized by lipid, protein, or polymer shells, in the intravascular system; the gas cores are compressible and acoustically mismatched with blood and soft tissue surroundings, enhancing echo by 500–1000 times after bolus injection.2,5,6 Bubbles of suitable size for intravenous injection (< 6–8 μm in diameter to safely travel the pulmonary capillaries7) are resonant in the sub-10 MHz range used for ultrasound imaging,6,8 producing harmonic and sub-harmonic echoes not exhibited by soft tissue.5,6,9 In addition to aiding in the diagnosis of various cardiovascular pathologies, contrast-enhanced ultrasound has been proposed as a modality to indicate potentially cancerous lesions in a number of organs, including the liver, kidneys, and pancreas.5
Beyond diagnosis, researchers are experimenting with microbubbles as vehicles for site-specific drug delivery, by adding surface receptors for targeting2,8 and therapeutic payloads for release by ultrasonic destruction.7,10–17 Fortuitously, the acoustic excitation and destruction of microbubbles also enhances local uptake of therapeutic agents by generating microjets that temporarily perforate cell membranes, i.e. sonoporation.7,11,16–18 Kang et al.,15 for instance, found that a combination of Docetaxil-loaded microbubbles and ultrasound (DOC+MB/US) was more effective against rabbit liver tumors than treatments that omitted one element or the other (i.e. DOC, DOC+MB, DOC+US, MB+US). Similar results have been observed in gene delivery experiments in vitro16,17,19 and in vivo;18,20–22 used as such, sonoporation presents an alternative to immunogenic viral vectors for gene transfection.
Conventionally, microbubbles are produced using mechanical agitation or sonication of a solution under a headspace gas. However, these techniques are not ideal for either contrast enhancement or drug delivery, due to the produced bubbles’ polydispersity. Talu et al.8 found that about half of the bubbles in a conventional population resonated outside the bandwidth of a typical ultrasound transducer, reducing the efficiency of contrast-enhancement. Additionally, stray large bubbles (e.g. 2% of Definity contrast agents exceeding 10 μm in diameter) can cause capillary embolisms, which give rise to such side effects as inflammation and clotting.23 Further, drug loading in conventional production methods is inconsistent, with typical loading efficiencies of 50–60%.15,24
Microfluidic flow-focusing is an alternative method to produce microbubbles, in which fluids are forced through a narrow orifice where high shear and capillary instability break bubbles off the tip of a gas bulb (Fig 1).25,26 The technique results in uniform bubble sizes and payloads, tunable by adjusting gas pressure and liquid flow rates.14,27,28 One challenge it has faced, however, is generating clinically useful amounts in a practical timeframe, due to production being serial rather than bulk. For reference, a whole-body human dose requires tens of millions of monodisperse bubbles,5 and mechanical shaking produces 12 billion Definity contrast agents in 45 seconds. By comparison, although Hettiarachchi et al.28 experimented with production rates up to 1 MHz sans drug-loading, the close bubble spacing and high shear resulted in bubble coalescence and polydispersity in excess of 50%. More recently, Seo et al.29 achieved monodisperse production at up to 1 MHz with a narrower orifice, Castro-Hernández et al.30 reached hundreds of kHz with a wider orifice in a jetting regime, and Peyman et al.31 demonstrated 1 MHz with a more-polydisperse spraying regime. These rates are sufficient to produce a human dose of contrast agent within minutes, but have not incorporated therapeutic payloads. When adding an oil phase for drug loading, Hettiarachchi et al.14 reduced their design’s generation rate to a more modest 1 kHz, which would take 5–6 hours to reach 20 million. Kendall et al.32 advanced this work by developing a multi-layer parallelized design, demonstrating eight simultaneous production streams of oil-carrying bubbles. However, since parallelization progressively increases design size and complexity, improving the per-channel production rate remains of great interest as a complementary approach.
Fig. 1.
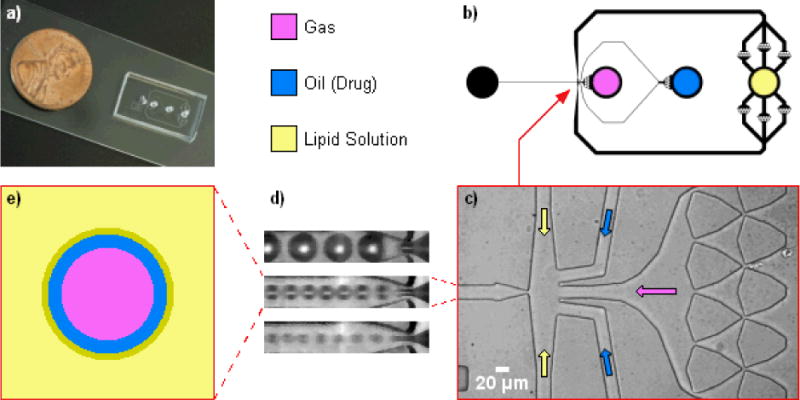
Flow-focusing microfluidic design, adapted from Hettiarachchi et al.14 for high-speed production. a) Photo of microfluidic device, with penny for scale. b) Top-view schematic of microfluidic design. The lipid inlet was augmented with parallel debris-filter arrays since its flow rate is highest. c) Microscope view of empty flow-focusing intersection, with arrows denoting how phases were flowed in. d) Magnified view of three flow-focusing regimes; from top to bottom: geometry-controlled, dripping, and jetting. e) Diagram of dual-layer, oil-carrying bubble. A condensed lipid monolayer self-assembles at the oil/aqueous interface.
Anna et al.33 observed that flow-focusing droplet formation transitions through at least three regimes as the continuous-phase velocity is increased: geometry-controlled, where the dispersed phase briefly plugs the orifice cross-section while extruding each droplet, and then retracts; dripping, where a sharp dispersed-phase tip remains at the orifice, spawning droplets without plugging or retracting; and jetting, where a thin dispersed-phase filament stretches through the orifice and breaks up further downstream without retracting. We have observed that each mode likewise exists in multilayer bubble formation (Fig 1d) while working to increase the per-channel production rate of oil-loaded microbubbles.
In this study we report flow-focusing production of drug-loadable microbubbles at rates up to 300 kHz, over 2 orders of magnitude higher than Hettiarachchi et al.,14 through modulation of the bubble formation regime. Our device features a dual hydrodynamic flow-focusing region with a much-narrowed orifice and outlet channel, optimizing the design of Hettiarachchi et al.14 for high-speed dripping production. We thoroughly investigate the transition from geometry-controlled production to dripping in bubbles, and the influence of the intermediate oil layer on production characteristics. As a complementary approach to parallelization,32 our single-channel device, operated in the dripping regime, accelerates drug-loadable microbubble production toward clinical practicality.
Materials and Methods
Microfluidic device layouts were designed in L-Edit 10 (Tanner EDA), and printed as transparency masks at 20,000 DPI (Cad/Art Services). Devices were fabricated using rapid prototyping techniques,14,28,34 casting silicone elastomer from photopolymer-on-silicon molds.
Microfluidic Design
The device design was based on that of Hettiarachchi et al.,14 with the gas, lipid, and oil phases converging into a single flow-focusing intersection (Fig 1). This intersection geometry was kept unchanged from Hettiarachchi, with 30 μm lipid channels, and 20 μm gas and oil channels. The orifice itself was narrowed from 20 to ~5 μm, similar to Seo et al.,29 proportionally reducing the volumetric flow rate required to raise flow speed into dripping-mode production. Debris filters were narrowed correspondingly. To maintain separation between the closely-spaced bubbles and prevent coalescence, the post-orifice expansion zone was narrowed and shortened from a 100 × 300 μm triangle (104° angle) to 60 × 30 μm (36°), and the ensuing outlet channel narrowed from 300 to 20 μm. This 15× narrowing yields a proportional increase in bubble spacing at equivalent flow/pressure settings, enabling higher production rates without pileup.
Other changes were made to improve pressure and flow rate tolerance. The debris filters were redesigned with larger bonding areas to resist delamination. The lipid channels, which carry the most flow, were widened to 200 μm to reduce resistance (tapering to 30 μm prior to the flow-focusing intersection). Finally, the lipid inlet was augmented with six parallel filters to increase debris-trapping redundancy and divide the flow rate each filter must endure.
Mold Fabrication
The mold was fabricated in a class 1,000 cleanroom according to MicroChem’s SU-8 protocol. Using a spin coater (Laurell Technologies), a 25-μm layer of SU-8 25 photoresist (MicroChem) was spread onto a 3″ silicon wafer. The wafer was soft-baked, allowed to cool, then covered with the printed mask and exposed to a UV flood lamp (ABM-USA). Following a postexposure bake, the wafer was submerged in SU-8 developer to wash away the unexposed areas, leaving raised microfluidic features on the silicon surface. This mold was then hard-baked to smooth out minor cracks. Finally, the mold was silanized to facilitate removal of cast devices: in a fume hood, the wafer was sealed in a vacuum chamber along with an open 15 mL conical tube containing a few drops of tridecafluoro-1,1,2,2-tetrahydrooctyl-1-trichlorosilane (Gelest) in a pipette tip. The chamber was vacuumed for 20 minutes to produce silane vapor, then allowed to gradually repressurize over at least 1 hour as the vapor bonded to the mold surface.
Device Fabrication
Individual devices were made of poly(dimethylsiloxane) (PDMS) elastomer plasma-bonded to glass. First, 20 g of Sylgard 184 (Dow Corning) PDMS base and curing agent were mixed at a 10:1 weight ratio and poured over the mold in a Petri dish. The mixture was degassed in a vacuum chamber for a few hours to remove all bubbles, then transferred into a 65°C oven and cured fully. A device unit was cut out of the cured PDMS, and inlets and outlets were punched using a 16G sharpened, unbeveled needle (B–D). This PDMS part was placed in an air plasma cleaner (Harrick Plasma) along with a glass slide, and plasma-treated on High for 2 minutes at 300–500 mTorr. The PDMS part was then pressed face-down against the slide to bond, forming a complete device with glass-floored microchannels. DI water was wicked into the channels to help preserve their hydrophilicity. A device was prepared at the start of each experiment, or stored underwater between experiments if multiple tests were desired.
Lipid Solution
Lipid solution was prepared in the manner of Hettiarachchi et al.14 Lipid powder was purchased from Avanti Polar Lipids – specifically 1,2-distearoyl-sn-glycero-3-phosphocholine (DSPC), and 1,2-distearoyl-sn-glycero-3-phosphoethanolamine-N-[methoxy(polyethylene glycol)-2000] (DSPE-PEG2000). For most experiments, DSPC and DSPE-PEG2000 were weighed out in a 9:1 molar ratio, dissolved with a few mL of chloroform (Fisher Scientific) in a 20 mL glass vial, and vortexed for 1 minute at medium speed to facilitate dissolution. The chloroform was then evaporated in a fume hood with a gentle nitrogen stream. The waxy lipid residue was placed in a vacuum chamber for 30 minutes to completely dry, then resuspended with ultra-pure filtered DI water (Millipore) at a stock 2× concentration of 1 mg/mL DSPC (or 1.266 mM), to be diluted in half before use. The suspension was sonicated at 50–55°C, just below the gel/liquid phase transition temperature of DSPC, until fully dissolved. The vial was magnetically stirred overnight to air-saturate, and stored at 9°C.
To minimize bubble coalescence at high production rates, a nonionic surfactant, Pluronic F68 (aka Poloxamer 188), was added to either the lipid solution, the oil phase, or both. For lipid solution, the stock 2× concentration was diluted in half by adding 3 parts ultra-pure DI water and 2 parts 10% Pluronic F68 solution (Sigma Aldrich) to 5 parts stock, then vortexing for 1 minute and sonicating for 15 minutes before use. For oil, the 10% Pluronic F68 solution was gently evaporated with a nitrogen gun, then resuspended with triacetin oil at 5× or 10× the prior volume, sonicating as necessary to dissolve.
Bubble Production
Gas, oil, and lipid were flowed into the device as depicted in Figure 1b, via flexible Tygon tubing. The gas consisted of house air, nitrogen (Airgas), or C4F8 (Specialty Chemical Products), and was controlled by either an SMC ITV0011-2UMS digital regulator (Automation Distribution) up to 14.4 psi, or an analog regulator (Swagelok) up to 30 psi. The oil triacetin (glyceryl triacetate, Sigma-Aldrich), capable of carrying hydrophobic drugs such as Paclitaxel,14 was dyed with Oil Blue N (Sigma-Aldrich) at 0.01 mg/mL for visibility. The lipid and oil were loaded in syringes and tipped with 23g needles (BD) to fit the tubing. Liquid flows were controlled by PicoPlus syringe pumps (Harvard) with volumetric flow rate settings.
Characterization of Bubble Production
Microbubble production was observed through a Nikon Eclipse TE2000-S inverted microscope and recorded at up to 480 kfps using a Phantom v310 high-speed camera (Vision Research). A Fiber-Lite Series 180 high-intensity illuminator (Dolan-Jenner Industries) provided strong light for recording at shutter speeds in the hundreds of kHz.
To observe how production behaved over a range of parameters, gas pressure and oil flow rate were held constant while lipid flow rate was incremented, starting at low flow with large geometry-controlled bubbles, and ending when production destabilized at high flow. Gas pressure was then adjusted, and another sweep of the lipid flow rate performed. This process was repeated to test a range of pressures. Finally, oil flow rate was adjusted, and the gas and lipid settings were swept through again. At each setting, a 300-frame video clip was captured at 200, 340, or 480 kfps, corresponding to time-lengths of 1.5, 0.88, or 0.625 ms, respectively. To confirm production consistency over a longer timeframe, some trials were recorded with five 600-frame clips per setting, spaced ~20 seconds apart.
Bubble diameters were measured manually in Irfanview, or calculated from circular cross-sections measured by ImageJ’s “Analyze Particles” tool. In videos with closely-spaced or touching bubbles, ImageJ’s “Fill Holes” and “Watershed” functions were used to distinguish the bubbles for particle analysis. Using R and Microsoft Excel, measurements were processed for average size, standard deviation, and polydispersity index (PDI):14,28
Bubble production rate was calculated by counting the number of bubbles (e.g. 10–100) produced within 100 video frames, and dividing by the time elapsed. Equivalently:
For production rates exceeding the camera’s Nyquist frequency of 240 kHz (half the maximum recording frame rate), where aliasing can interfere with frequency measurements, the results from counting were corroborated by tracking the displacement of specific bubbles (see Appendix† for details).
The volumetric gas flow rate was obtained by calculating bubble volume from diameter, then multiplying volume with production rate:
Stability
Bubble stability tests used C4F8 gas, for lower water-solubility and membrane-permeability compared to nitrogen. The lipid solution was also saturated with C4F8 in the manner of Talu et al.35 before each stability experiment. Briefly, a 2 mL vial of lipid solution was vacuumed overnight, then alternately exposed to C4F8 and vacuum using a three-way valve connected to the cap. A three-step cycle was repeated five times: 5 seconds of vacuum, 1 minute of 5-psi C4F8, and 5 minutes of sealed wait time. Throughout preparation, the vial was continually stirred with a magnetic mixer.
To collect bubbles from an active microfluidic device, old bubbles were first cleared away from the outlet, e.g. by vacuum. Then a drop of lipid solution was extruded onto the outlet with a disposable pipet, drawn back up, and ejected onto a microscope slide. The bubble mixture was spread flat for viewing with a slightly-raised cover glass, supported by either a second cover glass to form an overhang, or by a PDMS membrane with a large punched well to hold the bubble sample. Time-lapse photography was performed by using Irfanview’s “Capture” function to take periodic screenshots of the Phantom camera’s program window (e.g. every 10 seconds). Bubble sizes were measured and analysed using ImageJ and R, as described above.
Fluorescence Imaging
To visualize the oil in dual-layer bubbles, an excess of Fluorol Yellow 088 (Sigma-Aldrich) was added to the triacetin oil in place of Oil Blue N. Bubbles were transferred to a glass slide for viewing as described above. Fluorescence imaging was done on an Olympus IX51 inverted microscope with a FITC filter and mercury lamp (Olympus U-LH100HG). Two cameras were used: a black-and-white Hamamatsu C4742-80-12AG, and a Canon EOS 5D Mark II.
Results and Discussion
Coalescence Prevention
Adding Pluronic F68 surfactant to the lipid and/or oil phases greatly reduced bubble coalescence, particularly when added to the lipid solution (Fig 2). Notably, the addition of Pluronic F68 to the oil phase also reduced the size of bubbles produced, all else being equal. However, mixtures of oil and Pluronic F68 tended to develop congealed debris after a few days on the shelf. Due to this, and the oil’s primary purpose as a drug carrier, Pluronic was only used in the lipid for subsequent production characterization.
Fig. 2.
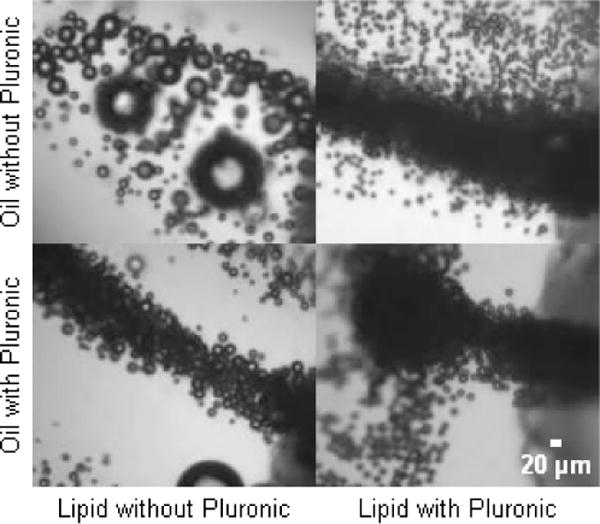
Reduction of bubble coalescence while exiting microdevice, by premixing of Pluronic F68 surfactant into oil or lipid solution at a concentration of 20 mg/mL. Dramatic benefits were evident when adding to either phase, but more so with lipid.
Bubble Formation Regime Transitions
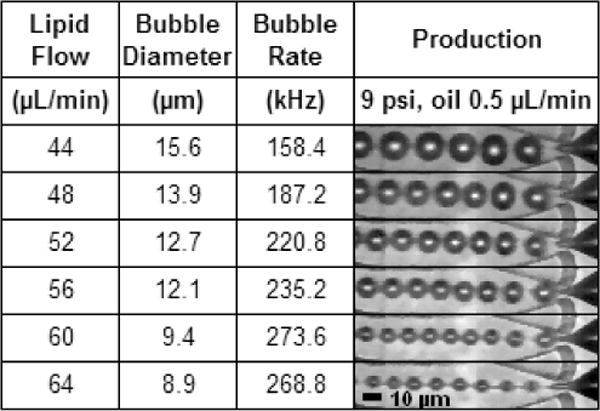
The transition from the geometry-controlled regime to dripping was observed to be smooth and continuous with increasing lipid flow rate (Table 1). Due to the narrow sub-10 μm orifice, much of the production range was geometry-controlled, even as production rates exceeded 100 kHz. But with increasing lipid flow, bubble diameter decreased until the gas phase definitively avoided contact with the orifice walls, and formation could be classified as dripping. This continuity was also evident in plots of size-scaling and production rate (Figs 3–5): in both cases, the two formation regimes fell along a unified curve when parameters aside from lipid flow rate were held constant. By contrast, a more abrupt transition is observed in droplet production,36 with Anna et al.33 clearly demarcating the two regimes in their graphs of flow ratio vs. capillary number.
Table 1.
Production regime transition from geometry-controlled to dripping was smooth and continuous.
|
Fig. 3.
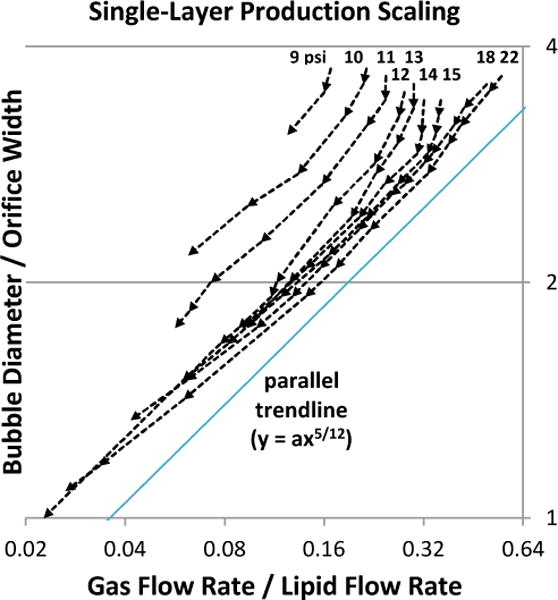
Effect of gas pressure on size scaling. Orifice width measured ~5.7 μm. Oil was not used. Lipid flow-rate sweeps were performed at nine gas pressures (9–15, 18, and 22 psi), with arrows denoting the sequence of increasing lipid flow. Production transitioned gradually from geometry-controlled to dripping, becoming the latter definitively below y = 2. At each pressure, scaling roughly followed a power trend of y = ax5/12 (a = 4 shown), similar to observations by Castro-Hernández et al.30 Here, however, a was found to vary with gas pressure.
Fig. 5.
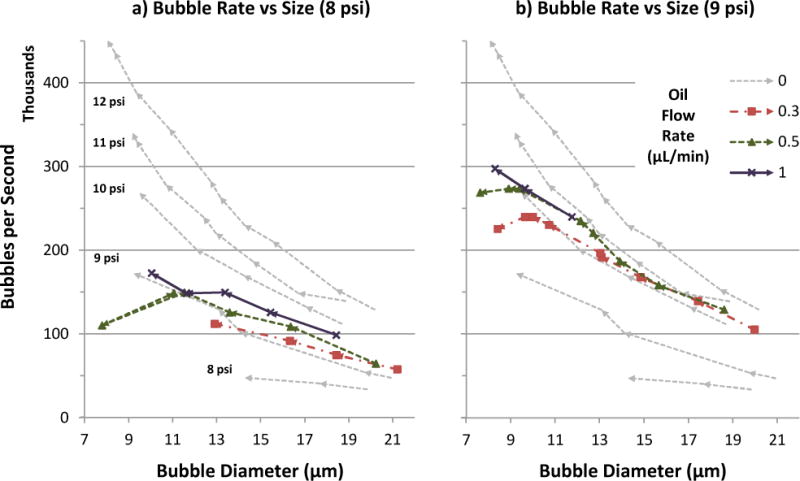
Bubble production rate vs. diameter over a range of lipid and oil flow rates, at gas pressure 8 psi (a) or 9 psi (b). For reference, oil flow 0 (single-layer lipid bubble) data was taken at five gas pressures (8–12 psi), and included in both graphs. In each data series, arrows denote the sequence of increasing lipid flow. Production curves generally exhibited inverse power law trends (axk, where k < 0), but inclusion of oil added a dip at high flow rates prior to production destabilization. Oil also shifted production curves upward, similar to a gas pressure increase of 1–2 psi.
As gas flow rate decreased relative to oil, production could exhibit jetting of the oil phase while the gas phase remained in geometry-controlled or dripping mode (Table 1, bottom row). This difference is likely due to oil’s higher viscosity delaying capillary breakup. For the oil flow rates used in this study (≤1 μL/min), breakup downstream of the orifice still resulted in an oil layer around each bubble as desired, thanks to hydrophobic affinity between the oil and gas phases.
Effect of Gas Pressure on Size Scaling
Bubble scaling with respect to gas/liquid flow ratio (Figs 3a, 4a–b) roughly followed a trend of the form:
where db is bubble diameter, D is orifice width, Q is volumetric flow rate, and a was found to be dependent on gas pressure and oil flow rate. The exponent 5/12 was derived by Castro-Hernández et al.30 for their jetting production in a square microchannel; it is numerically similar to, but physically distinct from, an earlier derivation of exponent 0.4 by Garstecki and Gañán-Calvo26,37 for inertia-dominated flows.
Fig. 4.
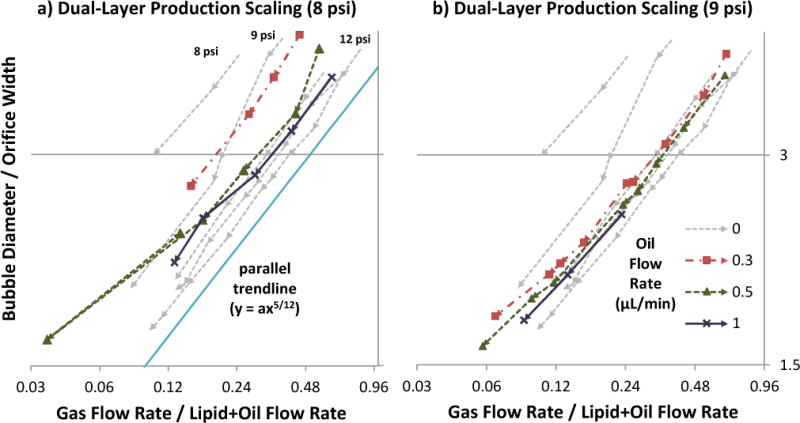
Size scaling behavior for various oil flow rates, at gas pressure 8 psi (a) or 9 psi (b). For reference, oil flow 0 (single-layer lipid bubble) data was taken at five gas pressures (8–12 psi), and included on both graphs. Orifice width measured ~4.8 μm. In each data series, arrows denote the sequence of increasing lipid flow. The scaling curves roughly followed a power trend of y = ax5/12 (a = 4 shown), similar to the observations of Castro-Hernández et al.30 with oil-less production. Inclusion of oil altered a, similar to a gas pressure increase of 1–3 psi depending on oil amount.
Interestingly, whereas the above authors each presented a single scaling curve applicable to all their pressures/flows, the current study observed gas pressure displacing the scaling curve (Fig 3), essentially changing the value of a. As pressure was increased, curves shifted downward/rightward in Figure 3 in progressively smaller increments. This can be interpreted as:
For a given gas/lipid flow ratio, higher pressure produced smaller bubbles.
For a given bubble size, when using higher pressure, the gas/lipid flow ratio was higher, meaning the bubbles were more closely-spaced.
Indeed, the effect on bubble spacing was observed in production videos of same-sized bubbles at different settings: at low pressure, the gas tip would retract between pinch-offs, resulting in a wide spacing between bubbles. But with increasing pressure, retraction decreased and bubble spacing became tighter, until the gas tip essentially remained in the orifice and further increases in pressure had little effect on spacing.
As described by Anna et al.33 and Utada et al.,38 flow-focusing production and the transitions between formation regimes are a competition between viscous drag and surface tension, embodied by the capillary number:
where μ is the dynamic viscosity (cP) of the continuous phase, V is the characteristic velocity (m/s), and γ is surface tension (N/m). Thus, in low-pressure production, cyclic gas-bulb retraction is driven by surface tension γ, whereas in high-pressure production, the retraction is suppressed by viscous drag from the quicker lipid flow V needed to balance the increased gas pressure.
Another perspective is provided by Cubaud and Ho39, who describe a partial-wetting effect for gas fraction <0.9 that increases channel resistance and pressure drop with decreasing flow speed. Higher resistance at low speeds may contribute to gas bulb retraction and thus bubble spacing. When the current study’s data is rescaled in terms of gas fraction, scaling curves become roughly linear, with slopes depending on gas pressure (Appendix). This mirrors the liquid-fraction graphs of Cubaud et al. Figs 16–1739, where slopes depended on flow speed.
Scaling-curve displacement may have gone unmentioned in Castro- Hernández, Garstecki, and Gañán-Calvo’s studies due to their higher pressure/flow operating range, where the effect is subtler. Microfluidic designs with wide orifices (e.g. 20–40 μm26 or 50 μm30) require dripping or jetting regimes to produce sub-20 μm bubbles. But since capillary number depends on linear flow speed, wide designs require higher volumetric flow rates, which in turn necessitate higher gas pressures. By contrast, this study’s design featured a narrow ~5 μm orifice, operated mostly under 15 psi where the curve-displacing effects are more pronounced.
Effect of Oil Flow Rate on Size Scaling
The addition of oil as an intermediate layer tended to shift size scaling curves like a gas pressure increase of 1–3 psi, with decreasing incremental effect as more oil was added (Fig 4). It can be inferred that for bubbles produced at the same size and gas pressure, the addition of an oil phase decreased bubble spacing (via less retraction of the gas tip between bubble pinch-offs). Possible mechanisms for this effect include triacetin oil’s higher viscosity (17 cP at 25°C, versus 1.28 cP for 2% Pluronic F68 solution40) and hydrophobic affinity for the gas phase, which may cause the oil to act as a “glue” layer between the aqueous lipid and gas phases, transmitting viscous drag with less slippage. The observed decline in incremental benefit may be due to saturation, i.e. full coverage of the gas bulb.
Production Rate
By increasing the pressure and flow rates exerted on our narrow orifice, production rates of 7–8 μm microbubbles were pushed up to 300 kHz with oil, and 450 kHz without (Fig 5). For oil-less bubbles at a given gas pressure, production rate exhibited an inverse power law trend (axk, where k < 0) relative to bubble diameter as lipid flow rate was increased. Higher gas pressure increased the production rate roughly 50 kHz per psi, and the gains did not diminish over the range of pressures observed in this study. This influence of gas pressure on production rate may explain the apparent scatter in the corresponding rate-vs-size plot of Castro-Hernández et al.,30 where gas pressure was not specified for each data point.
The addition of an oil phase displaced production-rate curves upward and leftward, much like a gas pressure increase of 1–2 psi (Fig 5). The effect is somewhat less than oil’s displacement of size-scaling curves (Fig 4), which ranged up to 3 psi. Oil also caused production-rate curves to dip at high flow rates instead of pick up, producing more-linear trends in some cases. Including the dip, dual-layer production could reach smaller diameters than single-layer production before destabilizing.
For a given bubble size and gas pressure, increasing the oil flow rate also increased the bubble production rate (Fig 5), which logically agrees with oil’s effect of decreasing bubble spacing, as previously deduced from size-scaling plots (Fig 4). Unlike higher gas pressure, however, higher oil flow encountered diminishing returns for production rate. This difference may be due to oil increasingly competing with gas flow for passage through the orifice, whereas turning up gas pressure increases gas flow directly.
Size Uniformity
Production polydispersity averaged ~4% overall, with a maximum of 9.42% and a standard deviation under 2 percentage points (Fig 6a, b). The use of oil produced more scatter and slightly higher polydispersity on average, partly due to outliers. Neither oil flow rate nor gas pressure exhibited correlation with PDI. However, polydispersity was inversely related to bubble size, due partly to measurement precision limits: with each pixel in an image corresponding to ~1 μm, one pixel represents 12.5% of an 8 μm bubble’s diameter, versus 5% for a 20 μm bubble. Despite this, the PDI for 8 μm bubbles remained ~6%, just slightly higher than the 5% threshold reported by Hettiarachchi et al.14
Fig. 6.
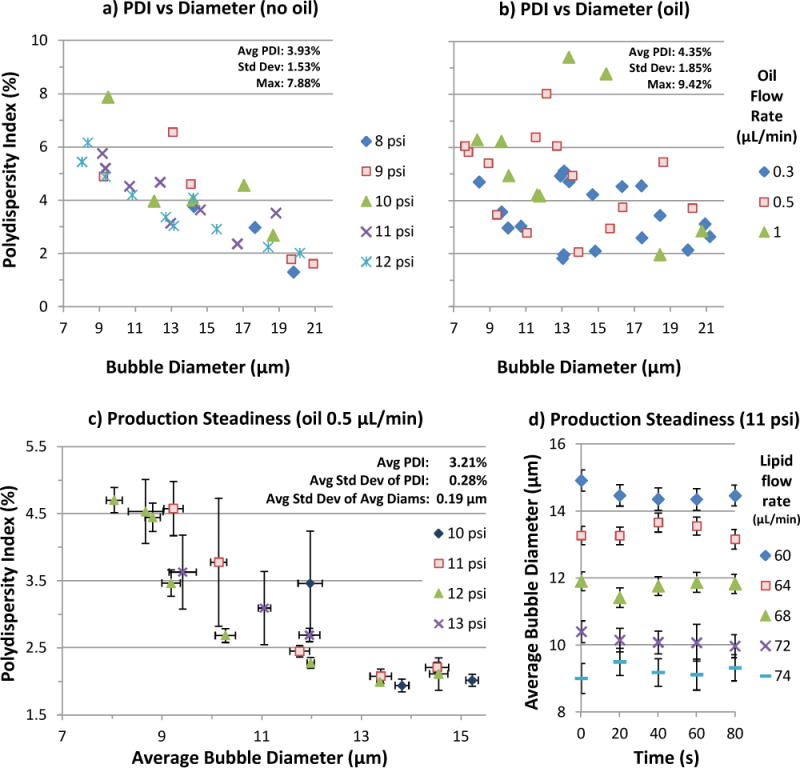
Bubble production polydispersity over a range of parameters. No correlation with pressure or oil flow rate emerged. Due partly to measurement precision limits, polydispersity was inversely related with bubble size, ranging from 2% at 20 μm to 6% at 8 μm, for an average of ~4% overall in (a) and (b). Oil bubble polydispersity averaged slightly higher, partly due to outliers. c) Production steadiness for various gas pressures and lipid flow rates at oil flow 0.5 μL/min. Error bars represent standard deviations among five videos per data point. Diameters and PDI were generally consistent, with the latter averaging 3.21% (max 6.43%). d) Average diameter vs time for the 11-psi data from (c). For each setting, average diameter fluctuated within ~1 μm over five recordings (each 1–2 ms) taken at 20-second intervals.
In experiments where five recordings were taken per setting at ~20-second intervals, data was analyzed as follows: For each recording, the average diameter and standard deviation were calculated (Fig 6d), as well as the polydispersity index. Then for each setting (five videos), the five average diameters and five PDIs were used to calculate another level of averages and standard deviations (Fig 6c). It was found that average diameters had a standard deviation of 0.19 μm per setting, on average. PDI averaged 3.21% overall (max 6.43%), with a standard deviation of 0.28% per setting, on average.
Stability
Microbubble samples were observed for Ostwald ripening, a degradation of size uniformity due to gas exchange through the solution (Fig 7). Polydispersity for both types grew linearly at ~3.75% per minute, with the dual-layer bubbles starting at 10% rather than 5% due to greater coalescence tendency during collection. Despite the widening size range, average diameter remained relatively stable for single-layer bubbles (down ~1 μm in 10 minutes). By contrast, dual-layer bubbles dipped ~3 μm in 4 minutes, implying shrinkage outweighed expansion in the population. Subsequently the dual-layer average regrew, possibly due to the smallest bubbles disappearing; this would also account for the dip in polydispersity after 8 minutes, which coincided with a slight jump in average size. Notably, whereas shrinking dual-layer bubbles were observed to dissolve out of existence, shrinking single-layer bubbles tended to reach a stable size below 5 μm, stopping short of disappearance. This result suggests that oil interfered with the formation of a stable, condensed lipid membrane.
Fig. 7.
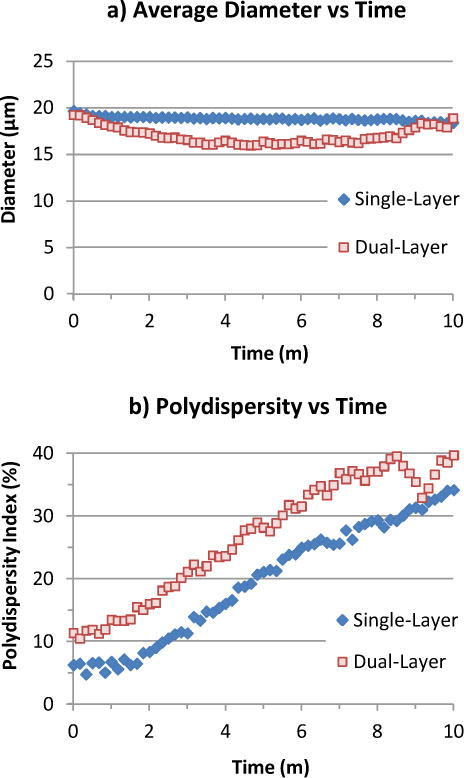
Stability of C4F8 bubble samples (200–300 count) with and without oil, observed floating in C4F8-saturated lipid solution under a raised cover glass. a) Average bubble diameter remained relatively constant for single-layer bubbles (down ~1 μm in 10 minutes), but dipped ~3 μm for dual-layer bubbles before recovering. b) Polydispersity (std dev / avg diam) grew linearly at ~3.75% per minute for both single- and dual-layer bubbles.
Fluorescence Imaging
The presence of an oil phase in the bubbles was confirmed by fluorescence imaging (Fig 8), in keeping with the results of Hettiarachchi et al.14 In some cases, a brighter drop was visible on the bubble surface, suggesting a bead of excess oil.
Fig. 8.
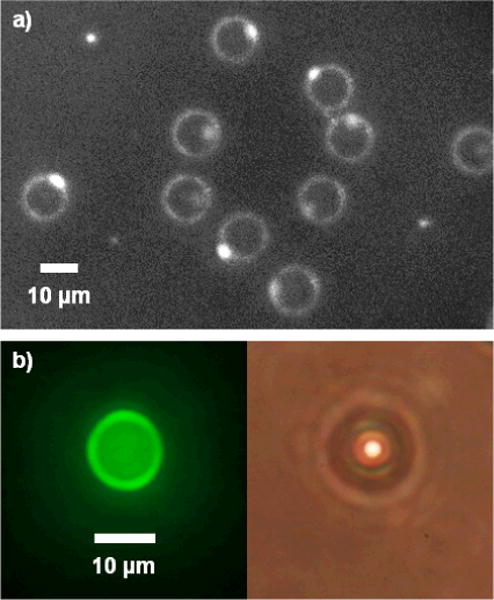
Fluorescent images of microbubbles with Fluorol Yellow 088 in oil phase. a) Black-and-white contrast-enhanced photo. Excess oil seemed to bead up on one side of bubble. b) Color photos of fluorescent and brightfield view.
Drug Capacity
Oil volume per bubble, calculated from oil flow rate divided by bubble production rate, was ~0.031 pL per 7.6 μm bubble produced at 0.5 μL/min oil flow, or 0.056 pL per 8.3 μm bubble at 1 μL/min oil flow. As an example, the anticancer drug Paclitaxel (Bristol-Myers Squibb) is highly soluble in triacetin oil at 75 mg/mL.41 Assuming 8 μm bubbles carrying 0.05 pL of oil, each bubble would contain 3.75 pg of the drug. Conventionally, Paclitaxel is diluted to 0.3–1.2 mg/mL for infusion, which corresponds to a suspension of 80–320 million bubs/mL to achieve the same concentration. As a safety comparison, the commercial UCA Definity (Lantheus Medical Imaging) consists of 1.2 × 10¹⁰ bubbles per 2 mL vial (with 1.5 mL fill volume), of which 1.3 mL is taken and diluted in 50 mL saline for infusion. This works out to a concentration of 152–203 million bubs/mL in the infusion, which overlaps with the 80–320 million drug bubs/mL calculated above (albeit for different bubble sizes), suggesting that a Paclitaxel bubble suspension at conventional dosage concentrations should also be safe to inject. Moreover, smaller concentrations may suffice for targeted drug delivery: although an individual bubble’s payload is small, ligand binding and ultrasonic deflection42 can increase local concentrations while avoiding systemic toxicity.
Conclusion
Microfluidic flow-focusing can generate highly monodisperse microbubbles with consistent therapeutic payloads, presenting potential to advance ultrasound contrast enhancement and targeted therapy of cancers. However, devices capable of improving the production rate are necessary to move microfluidics from laboratory tool to clinical practicality. The exploration of production regimes beyond geometry-controlled breakup is a logical step in this transition, in complement with the development of parallelized designs.32 By producing at 300 kHz as demonstrated, a whole-body imaging dose of 20 million drug-loaded bubbles can theoretically be achieved in just over a minute, down from 5–6 hours at the prior 1 kHz rate.14 Monodisperse bubble doses should also be up to twice as efficient for harmonic imaging, due to near-uniform resonance versus the wider size distribution of conventional bubbles.8
On that note, future work for drug-delivery applications should investigate the mechanism of oil-carrying bubble dissolution, and aim to preserve bubble monodispersity after collection, particularly in bulk. Collecting small amounts under a cover glass in the manner of Talu et al.35 is convenient for observation, but not for practical use. Initial attempts to collect larger amounts in suspension have encountered dissolution and size variation, which may be improved by experimenting with the collecting solution and apparatus.
Supplementary Material
Acknowledgments
Funding for this work was provided by The National Institutes of Health, Grant #1 RO1 EB008733-01A1, as well as the Integrative Graduate Education and Research Traineeship Program (IGERT) sponsored by the NSF (NSF IGERT DGE 0549479).
Footnotes
Electronic Supplementary Information (ESI) available: Appendix on measures taken against aliasing. See DOI: 10.1039/b000000x/
References
- 1.Lindner JR. Nat Rev Drug Discovery. 2004;3:527–533. doi: 10.1038/nrd1417. [DOI] [PubMed] [Google Scholar]
- 2.Klibanov AL. Bioconjugate Chem. 2005;16:9–17. doi: 10.1021/bc049898y. [DOI] [PubMed] [Google Scholar]
- 3.Pai RG, Varadarajan P, Pohost GM. Diagnostic Imaging. 2006;28:23–27. [Google Scholar]
- 4.Chesson E. Health Imaging & IT. 2004:2. [Google Scholar]
- 5.Wilson SR, Burns PN. Radiology. 2010;257:24–39. doi: 10.1148/radiol.10091210. [DOI] [PubMed] [Google Scholar]
- 6.Dayton PA, Ferrara KW. J Magn Reson Imaging. 2002;16:362–377. doi: 10.1002/jmri.10173. [DOI] [PubMed] [Google Scholar]
- 7.Hernot S, Klibanov AL. Adv Drug Delivery Rev. 2008;60:1153–1166. doi: 10.1016/j.addr.2008.03.005. [DOI] [PMC free article] [PubMed] [Google Scholar]
- 8.Talu E, Hettiarachchi K, Zhao S, Powell RL, Lee AP, Longo ML, Dayton PA. Mol Imaging. 2007;6:384–392. [PMC free article] [PubMed] [Google Scholar]
- 9.Forsberg F, Shi WT, Goldberg BB. Ultrasonics. 2000;38:93–98. doi: 10.1016/s0041-624x(99)00148-1. [DOI] [PubMed] [Google Scholar]
- 10.Unger EC, McCreery TP, Sweitzer RH, Caldwell VE, Wu Y. Invest Radiol. 1998;33:886–892. doi: 10.1097/00004424-199812000-00007. [DOI] [PubMed] [Google Scholar]
- 11.Unger EC, Hersh E, Vannan M, McCreery T. Echocardiography. 2001;18:355–361. doi: 10.1046/j.1540-8175.2001.00355.x. [DOI] [PubMed] [Google Scholar]
- 12.Shortencarier MJ, Dayton PA, Bloch SH, Schumann PA, Matsunaga TO, Ferrara KW. IEEE Trans Ultrason Ferroelectr Freq Control. 2004;51:822–831. doi: 10.1109/tuffc.2004.1320741. [DOI] [PubMed] [Google Scholar]
- 13.Tartis MS, McCallan J, Lum AFH, LaBell R, Stieger SM, Matsunaga TO, Ferrara KW. Ultrasound Med Biol. 2006;32:1771–1780. doi: 10.1016/j.ultrasmedbio.2006.03.017. [DOI] [PubMed] [Google Scholar]
- 14.Hettiarachchi K, Feingold S, Zhang S, Lee AP, Dayton PA. Biotechnol Prog. 2009;25:938–945. doi: 10.1002/btpr.214. [DOI] [PMC free article] [PubMed] [Google Scholar]
- 15.Kang J, Wu X, Wang Z, Ran H, Xu C, Wu J, Wang Z, Zhang Y. J Ultrasound Med. 2010;29:61–70. doi: 10.7863/jum.2010.29.1.61. [DOI] [PubMed] [Google Scholar]
- 16.Lentacker I, De Smedt SC, Sanders NN. Soft Matter. 2009;5:2161. [Google Scholar]
- 17.Lentacker I, Geers B, Demeester J, Smedt SCD, Sanders NN. Mol Ther. 2010;18:101–108. doi: 10.1038/mt.2009.160. [DOI] [PMC free article] [PubMed] [Google Scholar]
- 18.Li X, Wang Z, Ran H, Li X, Yuan Q, Zheng Y, Ren J, Su L, Zhang W, Li Q, Xu C. J Ultrasound Med. 2008;27:453–460. doi: 10.7863/jum.2008.27.3.453. [DOI] [PubMed] [Google Scholar]
- 19.Lawrie A, Briksen AF, Francis SE, Cumberland DC, Crossman DC, Newman CM. Gene Ther. 2000;7:2023–2027. doi: 10.1038/sj.gt.3301339. [DOI] [PubMed] [Google Scholar]
- 20.Zhigang W, Zhiyu L, Haitao R, Hong R, Qunxia Z, Ailong H, Qi L, Chunjing Z, Hailin T, Lin G, Mingli P, Shiyu P. Clin Imaging. 2004;28:395–398. doi: 10.1016/j.clinimag.2004.04.003. [DOI] [PubMed] [Google Scholar]
- 21.Hauff P, Seemann S, Reszka R, Schultze-Mosgau M, Reinhardt M, Buzasi T, Plath T, Rosewicz S, Schirner M. Radiology. 2005;236:572–578. doi: 10.1148/radiol.2362040870. [DOI] [PubMed] [Google Scholar]
- 22.Greco A, Benedetto AD, Howard CM, Kelly S, Nande R, Dementieva Y, Miranda M, Brunetti A, Salvatore M, Claudio L, Sarkar D, Dent P, Curiel DT, Fisher PB, Claudio PP. Mol Ther. 2010;18:295–306. doi: 10.1038/mt.2009.252. [DOI] [PMC free article] [PubMed] [Google Scholar]
- 23.Barak M, Katz Y. CHEST. 2005;128:2918–2932. doi: 10.1378/chest.128.4.2918. [DOI] [PubMed] [Google Scholar]
- 24.Pan J, Hou Z, Zhu P, Wang Y, Wang Q, Zhang Q. International Conference on BioMedical Engineering and Informatics, 2008 BMEI 2008. 2008;1:400–406. [Google Scholar]
- 25.Gañán-Calvo AM, Gordillo JM. Phys Rev Lett. 2001;87:274501. doi: 10.1103/PhysRevLett.87.274501. [DOI] [PubMed] [Google Scholar]
- 26.Gañán-Calvo AM. Phys Rev E. 2004;69:027301. doi: 10.1103/PhysRevE.69.027301. [DOI] [PubMed] [Google Scholar]
- 27.Talu E, Lozano MM, Powell RL, Dayton PA, Longo ML. Langmuir. 2006;22:9487–9490. doi: 10.1021/la062095+. [DOI] [PMC free article] [PubMed] [Google Scholar]
- 28.Hettiarachchi K, Talu E, Longo ML, Dayton PA, Lee AP. Lab Chip. 2007;7:463–468. doi: 10.1039/b701481n. [DOI] [PMC free article] [PubMed] [Google Scholar]
- 29.Seo M, Gorelikov I, Williams R, Matsuura N. Langmuir. 2010;26:13855–13860. doi: 10.1021/la102272d. [DOI] [PubMed] [Google Scholar]
- 30.Castro-Hernández E, van Hoeve W, Lohse D, Gordillo JM. Lab Chip. 2011;11:2023. doi: 10.1039/c0lc00731e. [DOI] [PubMed] [Google Scholar]
- 31.Peyman SA, Abou-Saleh RH, McLaughlan JR, Ingram N, Johnson BRG, Critchley K, Freear S, Evans JA, Markham AF, Coletta PL, Evans SD. Lab on a Chip. 2012;12:4544. doi: 10.1039/c2lc40634a. [DOI] [PubMed] [Google Scholar]
- 32.Kendall MR, Bardin D, Shih R, Dayton PA, Lee AP. Bubble Sci Eng Technol. 2012;4:12–20. doi: 10.1179/1758897912Y.0000000004. [DOI] [PMC free article] [PubMed] [Google Scholar]
- 33.Anna SL, Mayer HC. Phys Fluids. 2006;18:121512–121512–13. [Google Scholar]
- 34.Duffy DC, McDonald JC, Schueller OJA, Whitesides GM. Anal Chem. 1998;70:4974–4984. doi: 10.1021/ac980656z. [DOI] [PubMed] [Google Scholar]
- 35.Talu E, Hettiarachchi K, Powell RL, Lee AP, Dayton PA, Longo ML. Langmuir. 2008;24:1745–1749. doi: 10.1021/la703065v. [DOI] [PMC free article] [PubMed] [Google Scholar]
- 36.Bardin D, Martz TD, Sheeran PS, Shih R, Dayton PA, Lee AP. Lab Chip. 2011;11:3990. doi: 10.1039/c1lc20615j. [DOI] [PMC free article] [PubMed] [Google Scholar]
- 37.Garstecki P, Gañán-Calvo AM. Bull Pol Ac: Tech. 2005;53:361–372. [Google Scholar]
- 38.Utada AS, Chu LY, Fernandez-Nieves A, Link DR, Holtze C, Weitz DA. MRS Bulletin. 2007;32:702–708. [Google Scholar]
- 39.Cubaud T, Ho CM. Physics of Fluids. 2004;16:4575. [Google Scholar]
- 40.Dragosavac MM, Holdich RG, Vladisavljević GT, Sovilj MN. J Membr Sci. 2012;392–393:122–129. [Google Scholar]
- 41.Surapaneni MS, Das SK, Das NG. ISRN Pharmacol. 2012;2012 doi: 10.5402/2012/623139. [DOI] [PMC free article] [PubMed] [Google Scholar]
- 42.Lum AFH, Borden MA, Dayton PA, Kruse DE, Simon SI, Ferrara KW. J Controlled Release. 2006;111:128–134. doi: 10.1016/j.jconrel.2005.11.006. [DOI] [PMC free article] [PubMed] [Google Scholar]
Associated Data
This section collects any data citations, data availability statements, or supplementary materials included in this article.


