

SUMMARY
Microtubules (MTs) are cytoskeletal polymers that undergo dynamic instability, the stochastic transition between growth and shrinkage phases. MT dynamics are required for diverse cellular processes, and, while intrinsic to tubulin, are highly regulated. However, little is known about how MT dynamics facilitate or are regulated by tissue biogenesis and differentiation. We imaged MT dynamics in a smooth muscle-like lineage in intact developing C. elegans. All aspects of MT dynamics change significantly as stem-like precursors exit mitosis and, secondarily, as they differentiate. We found that suppression but not enhancement of dynamics perturbs differentiated muscle function in vivo. Distinct ensembles of MT-associated proteins are specifically required for tissue biogenesis versus tissue function. A CLASP family MT stabilizer and the depolymerizing kinesin MCAK are differentially required for MT dynamics in the precursor or differentiated cells, respectively. All these multidimensional phenotypic comparisons were facilitated by a novel data display method, the diamond graph.
INTRODUCTION
Microtubules (MTs) are cytoskeletal filaments composed of an assembly of α/β-tubulin heterodimers. MTs can rapidly and stochastically alternate between polymerization and depolymerization, a process called dynamic instability (Mitchison and Kirschner, 1984). The dynamic properties of a MT can be summarized by the rates of growth and shortening, and the frequencies of alternation between these two states (catastrophe and rescue), as well as the time spent neither growing nor shrinking (in pause) (Desai and Mitchison, 1997; Gardner et al., 2013). Dynamic instability is required for the plasticity and diversity of cellular organization (de Forges et al., 2012). Accordingly, the values of dynamics parameters vary among cell types (Wadsworth and McGrail, 1990).
MT dynamics are collectively impacted by the constituent tubulin isotypes (Panda et al., 1994), the numerous post-translational modifications of tubulin (Janke and Bulinski, 2011) and finally by a myriad of MT-associated proteins (MAPs) and molecular motors (Heald and Nogales, 2002; van der Vaart et al., 2009) that can affect MT stability and organization. In vitro models of cell differentiation have highlighted that some MT network components (isotypes, post-translational modifications, MAPs) vary among cell types and during differentiation. The levels of certain modifications, such as acetylation and detyrosination, increase during differentiation of muscles and neurons, respectively (Bulinski and Gundersen, 1991; Gundersen et al., 1989; Lim et al., 1989). Cell differentiation is often accompanied by selective expression of certain MAPs, for example, the MT stabilizers tau and MAP2 are specifically expressed and targeted to MT subpopulations during neuronal differentiation (Cassimeris and Spittle, 2001; Haque et al., 2004). In sum, the MT cytoskeleton in a given context has molecular, posttranslational, and dynamics signatures, depending on the cell type and function.
Changes of cell size, shape, and function occurring during tissue expansion and cell differentiation involve alterations of intercellular and intracellular communication, remodeling of organelle morphology and other aspects of cell mechanics and architecture. MTs are important regulators of all these processes, (Desai and Mitchison, 1997; Fletcher and Mullins, 2010) and are thus prominently implicated in differentiation and tissue biogenesis.
MT dynamics and regulation have primarily been characterized using cultured cells, zygotes, unicellular organisms, Xenopus egg extracts and MTs reconstituted from purified mammalian brain tubulin. While each of these systems offers distinct and powerful advantages, none recapitulates tissue biogenesis and cell differentiation in vivo.
Characterizing cell biological behaviors in situ is motivated by the observation that the MT growth rate in mouse muscle fibers is different depending on whether the cells are plated on coverslips or visualized by intravital imaging (Oddoux et al., 2013). Some aspects of MT dynamics and reorganization have been observed during tissue biogenesis in vivo including tracheal morphogenesis in Drosophila (Brodu et al., 2010), cell migration and axonogenesis in zebrafish (Distel et al., 2010; Yoo et al., 2012) and neuronal morphogenesis in the fruit fly, nematode, zebrafish and mouse (for review, see (Sakakibara et al., 2013). Collectively, these studies describe a central role of MTs in organelle dynamics and cellular organization during tissue biogenesis. However, it is poorly understood how and when the dynamic properties are modulated by differentiation and, conversely, how modulation of MT dynamics drives differentiation. Thus, investigating MT regulation in vivo in a tissue context is important in identifying and understanding the physiologically relevant mechanisms that regulate MT dynamics during development.
The nematode Caenorhabditis elegans is a powerful system for developmental biology due to its simple body plan and invariant development. Organogenesis of the C. elegans egg-laying apparatus is well characterized and comprises a small circuit of interacting neurons, epithelial and muscles cells (Sharma-Kishore et al., 1999; Thomas et al., 1990). Egg-laying apparatus biogenesis includes the sex myoblast (SM) lineage, which transforms from a pair of stem-like spheroid myoblasts into several large smooth muscle-like cells over the course of 24 hours of post-embryonic development (Sulston and Horvitz, 1977).
We developed a model system to study MT dynamics over the course of post-embryonic development in an intact living organism by driving expression of GFP-tagged tubulin in specific cells of the C. elegans egg-laying apparatus. As SM lineage cells exit mitosis and differentiate, MTs grow and shrink faster and more persistently than in the precursor cells. Interestingly, the changes in the four major dynamics parameters over the course of differentiation do not occur simultaneously; rescue frequency shifts earlier than all other parameters. To define the molecular mechanisms of MT regulation underlying the dynamics differences between a developing tissue and its fully developed counterpart, we performed stage-specific RNAi to deplete a panel of conserved MAPs, and first scored brood size to determine their effect on either tissue biogenesis or tissue function. Perturbing egg laying did not result in a particular MT dynamics “signature,” but in general, dynamics were decreased in these conditions, indicating that high magnitude dynamics are important during muscle cell differentiation and function. Finally, we correlated tissue-level phenotype with the alteration of MT dynamics for two MAPs with opposing functions, CLS-1CLASP and KLP-7MCAK, and which also appear to act specifically in precursor cells and the differentiated tissue, respectively. Together, our work comprises the characterization of the evolution of all aspects of MT dynamics throughout cell differentiation in an intact tissue where we reveal parameters of change in MTs and specific MAPs that are required for development versus function of a differentiated cell.
RESULTS
Microtubule network architecture and dynamics change throughout differentiation of a single cell lineage in situ
To measure and follow MT dynamics in an intact animal during differentiation and tissue biogenesis, we generated a C. elegans strain that expresses GFP-tagged β-tubulin in specific lineages of the egg-laying apparatus (see Supplemental Experimental Procedures, Figures 1A, 1B and S1). We used swept-field confocal imaging of intact worms to acquire high-resolution time-lapse movies of the precursor cell (sex myoblast; SM; Figure 1B, Movie S1) and the terminally differentiated uterine muscle cells (UMCs; Figure 1B, Movie S2 and S3) of the SM lineage. The SM is ellipsoidal with its major axis anterio-posterior. The UMCs are non-striated muscles similar to vertebrate smooth muscle cells and are involved in egg laying (Trent et al., 1983). In both, MTs grew centrifugally in an apparently non-centrosomal array. In the UMC cell bodies near the vulva on the ventral side of the worm, MTs grew centrifugally with apparently random orientation (Figure 1C and Movie S2). UMCs extend dorsally to surround the uterine cavity (Figure 1A and S3). In the dorsal flattened extensions of UMC, MTs were all oriented in the ventral-to-dorsal direction with their plus ends towards the dorsal cell periphery (Figure 1B, S3 and Movie S4). In general, UMC MT organization was similar to that of isolated mammalian vascular smooth muscle cells in 2-dimensional culture (Zhang et al., 2000).
Figure 1. Microtubule dynamics are modulated throughout cell differentiation of the sex myoblast lineage in intact C. elegans.

(A) The SM lineage is followed during post-embryonic development from L3 to adult. SM: sex myoblast, VPCs: vulval precursor cells, UMC: uterine muscle cell, VMC: vulval muscle cell. (B) Egg-laying apparatus expressing GFP::tubulin in vulval cells and the SM lineage. Images are maximal intensity projection of 10 μm (L3) or 20 μm (adult). (C) Magnified views of the MT cytoskeleton in the SM and the UMC. (D) Representative kymographs of MTs in the SM and UMC. (E) Scatter plots represent individual MT dynamics parameters of the precursor (SM; green) and differentiated cell (UMC; blue). ** p value < 0.001 unpaired t test. Error bars = SD. (F) Average values for the 4 parameters used in the diamond graphs. MT dynamics in the SM and UMC are displayed and compared using jointly normalized diamond graphs. The table represents the mean values in the diamond graphs. n(MTs) ≥ 120, n(worms) ≥ 10.
We measured dynamics parameters from kymographs generated from 2D time-lapse movies (Figure 1D, see Experimental Procedures). All dynamics parameters differed significantly between SM precursor and the fully differentiated UMCs (Figure 1E and 1F and Table 1). MTs in the SM underwent catastrophe and rescue more frequently, whereas MTs in the UMCs grew and shrunk more persistently and had higher growth and shrinkage rates than in the precursor cell (Table 1). In both the SM and UMCs, MTs almost constantly grew or shrunk; transient pausing at the cell periphery was rare and only seen in UMCs (Figure 6A and 6B). Another distinction of differentiated UMCs, as compared with SMs, was the presence of bundled MTs (Figure S1 and 6C). MTs growing on a preexisting MT (“on-track” MTs) grew significantly faster than isolated MTs (0.18 vs. 0.12 μm/sec; Table S1) and had a significantly higher catastrophe frequency (0.067 vs. 0.045 sec−1; Table S1).
Table 1. Dynamics parameters in 1 SM, 8 SMs, adult stage of the SM lineage and following perturbations of cell differentiation.
The table summarizes the main dynamics parameters in control worms during development at larval stage L3 for the SM, L4 for the 8 SMs descendants and adult stage for the UMCs. Dynamics was also measured in adult worms after inhibition of differentiation by LIN-12Notch or HLH-8Twist depletion, as described in Figure 2. SEM = standard error of the mean; n = number of MTs tracked. n(worms per experiment) > 10.
| 1 SM (L3-stage) | 8 SMs (L4-stage) | UMCs (Adult) | lin-12(RNAi) | hlh-8(RNAi) | |||||||||||
|---|---|---|---|---|---|---|---|---|---|---|---|---|---|---|---|
|
| |||||||||||||||
| mean | SEM | n | mean | SEM | n | mean | SEM | n | mean | SEM | n | mean | SEM | n | |
| Growth rate (μm/sec) | 0.13 | 0.004 | 79 | 0.15 | 0.005 | 356 | 0.17 | 0.004 | 275 | 0.13 | 0.003 | 274 | 0.19 | 0.005 | 221 |
| Shrinking rate (μm/sec) | 0.63 | 0.06 | 75 | 0.54 | 0.02 | 312 | 0.93 | 0.03 | 230 | 0.35 | 0.02 | 234 | 0.46 | 0.01 | 210 |
| Catastrophe (sec-1) | 0.17 | 0.01 | 79 | 0.13 | 0.003 | 356 | 0.06 | 0.003 | 275 | 0.19 | 0.01 | 274 | 0.14 | 0.003 | 221 |
| Rescue (sec-1) | 0.35 | 0.03 | 75 | 0.25 | 0.01 | 312 | 0.28 | 0.01 | 230 | 0.26 | 0.01 | 234 | 0.16 | 0.005 | 210 |
Figure 6. Depletions of two conserved MAPs selectively affect MT dynamics in a stage-dependent manner.

(A) Kymographs of MTs in the dorsal extension of UMCs in control worms and those depleted of CLS-1CLASP or KLP-7MCAK. (B) The residence time of MTs at the cortex is displayed in the scatter plot. Error bars = SEM, n > 30 MTs in 6 worms. ** p value < 0.01. (C) Histogram: ratio of MTs growing in bundles compared with the total number of MTs observed. Error bars = SEM, n > 30 MTs in 6 different worms. ** p value < 0.01. (D) Red diamond graphs of MT dynamics in CLS-1CLASP or KLP-7MCAK depleted SM and UMCs are superimposed with the non-depleted controls (dashed lines). Green: SM, cyan: total MT-population in UMCs and grey: dynamics of on-track or bundled MTs in UMCs. p value: * < 0.05; ** < 0.01 and n.s. > 0.05, unpaired t test.
To facilitate further comparison of dynamics parameters among conditions and to visually summarize MT dynamics, we generated four-axis plots (“diamond graphs”; Figure 1F and Figure S2). Diamond graphs display rates on the horizontal axes (shrinkage, left; growth, right), and frequencies on the vertical axes (catastrophe, down; rescue, up). The vertically elongated shape of the precursor SM diamond graph reflected high switching frequencies and low assembly/disassembly rates, compared to more persistent assembly/disassembly of MTs in UMCs, illustrated by the horizontally elongated diamond graph (Figure 1F and S2). Together, the significant differences in dynamics between SM in UMC demonstrated that changes in regulation of MT dynamics occur during the differentiation of precursor to differentiated cells within the SM lineage.
Step-wise regulation of MT dynamics over the course of mitotic exit and differentiation
During SM lineage development from SM to UMC, the 8 SM descendants exit mitosis and initiate the elongation process during differentiation (Figure 2A, Figure S1). To determine when, over the course of this differentiation program, MT dynamics are altered, we measured dynamics parameters at an intermediate stage after mitotic exit but before elongation. Growth rate and catastrophe frequency (Figure 2B and 2C) significantly and gradually changed from L3 to adult. Interestingly, rescue frequency significantly dropped as cells exited mitosis to a level similar to that measured in differentiated UMCs (Figure 2C). Thus, its regulation is an early event compared to that of other parameters. Conversely, depolymerization rate did not significantly change between L3 and L4, indicating that its regulation occurs later during development, likely in concert with cell elongation. The independent regulation of a single parameter (rescue frequency) has been observed in cultured cells treated with okadaïc acid (Gliksman et al., 1992) and in interphase and mitotic Xenopus extracts (Belmont et al., 1990). The uncoupled regulation of MT dynamics parameters suggests that specific MAPs are selectively regulated at distinct steps of differentiation.
Figure 2. Selective regulation of microtubule dynamics parameters during differentiation.

(A) Maximal intensity projections of Z-stacks of worms expressing GFP::tubulin. Schematic: SM (green) gives rise to 8 SM daughter cells (dark blue) in L4 that differentiate into VMCs (yellow) and UMCs (cyan). In lin-12Notch(RNAi) adults, the 8 ‘SM-like’ cells did not differentiate (grey). In hlh-8Twist(RNAi) adults the SM give rise to 4 – 6 SM descendants that do not differentiate (orange). Scale bar = 20 μm. (B) Jointly normalized diamond graphs represent MT dynamics in each condition. (C) Dashed curves represent evolution of dynamic parameters in SM lineage: SM precursor (green), 8 SM daughter cells in L4 (dark blue) and fully differentiated UMCs (cyan). lin-12(RNAi): grey; hlh-8(RNAi): orange. Error bars = SEM. n.s.: p value > 0.05 unpaired t test. Unlabeled means are significantly different, p value < 0.01. n(worms) > 10, n(MTs) > 220 for each data set
To test whether the differences between SM and UMC MT dynamics depend on differentiation state or cell size and shape, we allowed expansion of the SM cells, but blocked their differentiation into UMCs (Figure 2A) via RNAi mediated knockdown of lin-12, a Notch family transmembrane receptor (Greenwald et al., 1983; Newman et al., 1995), or hlh-8, a helix-loop-helix protein homolog of the transcription factor Twist (Corsi et al., 2000; Liu and Fire, 2000). LIN-12Notch protein is specifically required for UMC differentiation but not divisions within the lineage: the 8 SM descendants were ellipsoidal, undifferentiated, and smaller than the SM precursor (Figure 2A). As observed in hlh-8 mutant worms (Corsi et al., 2000), HLH-8Twist depletion also blocked differentiation of the SM lineage but also inhibited SM divisions, resulting in 4 to 6 ellipsoidal undifferentiated cells that were slightly larger than those of LIN-12Notch depleted or control L4 worms (Figure 2A). The shapes of the diamond graphs revealed that the relative magnitudes of MT dynamics parameters in LIN-12Notch and HLH-8Twist depleted cells were qualitatively similar to those of undifferentiated SM descendants in L4s (Figure 2B). Generally, when differentiation was blocked, all parameters except rescue frequency were quantitatively more similar to those of the SM precursor or its undifferentiated descendants than to values for the UMC (Figure 2C and Table 1), indicating that changes of cell shape and size during differentiation, rather than mitotic exit, induced changes in dynamics. The exception to this trend was growth rate in HLH-8Twist depleted cells, which reached that of UMCs. Since these cells are larger than the undifferentiated cells in other conditions, the high growth rate could relate to scaling of MT growth rate with cell size. Indeed, MT growth rates scale with spindle size (Reber et al., 2013), which in turn scales with cell volume (Good et al., 2013) suggesting a potential correlation between MT growth rate and cell volume. Taken together, these results suggest that mitotic exit and differentiation induce selective changes in MT dynamics.
Distinct complements of MAPs are required for tissue biogenesis versus tissue function
In cells, MT dynamics are collectively dictated by the relative abundance and activity of the complete ensemble of MAPs. The dramatic differences in MT dynamics between UMC and SM suggested that distinct subsets of MAPs are selectively expressed and regulated at these two developmental stages of the SM lineage. We therefore first set out to define the distinct subset of MAPs required at the precursor stage. MTs likely act in a myriad of cellular events in the SM, including cell division and other cell shape changes. No cell divisions during post-embryonic development are essential for animal viability (O’Connell et al., 1998). However, SM divisions and the subsequent morphogenetic events are required for egg laying. To affect MTs as early as SM division and morphogenesis, we fed first larval stage (L1) synchronized worms with bacterial strains expressing dsRNAs targeting 63 conserved candidate MT regulators encoded in the C. elegans genome (Figure 3A). As a proxy for SM cell function, we first scored the ability of the worms to lay eggs (brood size). Depletion of individual MAPs had variable effects on brood size (Figure 3D, dark bars). These results are consistent with the idea that many of these MAPs regulate cell division, differentiation and morphogenesis within the worm reproductive system.
Figure 3. Distinct complements of MAPs are required for biogenesis versus function of the egg-laying apparatus.

(A) For L1-feeding, bacteria expressing dsRNAs were fed to worms synchronized at the L1 by starvation. (B) For L4-feeding, worms synchronized at L1 as above were grown on normal growth medium until the fourth larval stage, when tissue biogenesis of the egg laying apparatus is complete. (A and B) Phenotypes were scored at adult using a stereoscope. (C) Example DIC images of the tissue-scale scored phenotypes. Scale bars = 20 μm. tba-6: α-tubulin isoform (F32H2.9); tbb-1: β-tubulin isoform (K01G5.7); dhc-1: dynein heavy chain (T21E12.4); ccpp6: cytosolic carboxy-peptidase protein 6 (EEED8.6). (D) Histogram displays number of eggs laid per worm for each RNAi condition. Error bars = SD; n (worms per experiment) = 3; n (experiments) = 2. Below the dashed line = significant reduction compared to control (p <0.001).
To refine the list of MAPs potentially acting in the egg laying apparatus, we next explored the morphological basis for the reduced brood size we observed. This could result from developmental arrest (Dev), vulval morphology defects (protruded vulva; Pvl), sterility (Ste), or egg-laying defective alone (Egl). Pvl, Ste and Egl occurred in various combinations after depletion of MAPs (Table S2). Developmental arrest and sterility do not arise from defects in the SM lineage. Therefore, to define MAPs acting in the SM lineage, we further considered only depletions resulting in Pvl or Egl.
Pvl can result from defects in division of the precursor cells or tissue morphogenesis, or in the environment of these cells (Eisenmann and Kim, 2000; Kamath et al., 2003). However, the reported Pvl phenotypes resulted from systemic RNAi. To determine which MAPs are specifically required cell-autonomously within the SM lineage, we generated an RNAi-insensitive mutant strain (rde-1(ne219)) in which RNAi is restored specifically in the egg-laying apparatus by driving the rde-1 gene by the unc-62 promoter (see Experimental Procedures). Of the 31 targets inducing Pvl in systemic RNAi, 26 caused similar defects following tissue-specific RNAi (Figure 4A), indicating that they indeed affect MT function in the egg-laying tissue. The 5 negative hits are likely essential in other cells or may indirectly affect the SM lineage. Thus we have begun to define the conserved MAPs important in this somatic lineage.
Figure 4. Pvl phenotype is induced by tissue/cell autonomous defects.
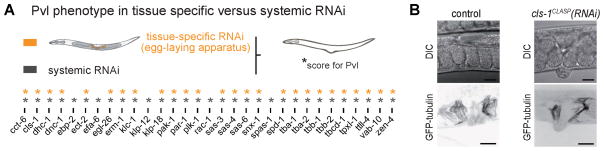
(A) Comparison of Pvl following systemic RNAi (grey) vs. tissue specific RNAi (orange) targeting MAPs (L1 feeding). * = Pvl. (B) Control worm (left) and cls-1CLASP(RNAi) Pvl worm (right). DIC image (top) and maximal intensity projection of confocal z-stack (bottom) in GFP::tubulin expressing worms. Scale bar = 20 μm.
Depletion of MAPs beginning at L1 could affect the egg laying apparatus not only by perturbing the precursor cells during tissue formation, but also by affecting the function of differentiated cells including the UMCs later in development. To determine the complement of MAPs specifically required for function of the egg-laying apparatus we introduced dsRNA starting at L4, after all SM lineage cell divisions and tissue morphogenesis are completed (Figure 3B, 3D grey bars).
Targets whose depletion from L1, but not from L4, had a strong effect on egg laying likely act primarily in proliferative tissue biogenesis (Figure 3D and Table S2; L1- vs. L4-feeding brood size). These targets included, as expected, proteins involved in centrosome duplication and thus cell division (three centrosomal proteins, SAS-3 SAS-4 and SAS-6, plus-end binding proteins CLS-1CLASP and EBP-2EB1, and TPXL-1TPX2; Table S2; (Espiritu et al., 2012; Kirkham et al., 2003; Leidel et al., 2005; Rogers et al., 2002; Wittmann et al., 2000). The milder effect resulting from depletion of the same proteins later in development suggests that these proteins are largely dispensable for egg-laying apparatus function. Conversely, targets inducing egg-laying defects (Egl) whether depleted before or after development are likely required for the function but not the biogenesis of the egg-laying apparatus (Figure 3C, Table S2). Interestingly, this category contains pairs of proteins with related functions. These include KLP-7MCAK and KLP-13Kip3, two MT-depolymerizing kinesins with non-redundant but similar function (Gardner et al., 2011), TTLL-12 and TTLL-15, predicted tubulin polyglutamylases (Kimura et al., 2010), and CCPP-1 and CCPP-6, carboxypeptidases, which perform the reverse modification, deglutamylation (Kimura et al., 2010; Rogowski et al., 2010). These four enzymes perform post-translational modifications of tubulin characteristic of differentiated cells (Janke and Bulinski, 2011).
This two-stage screen highlighted two categories of MAPs: essential regulators of tissue expansion and morphogenesis, and those acting in differentiated cells. Thus, we have started to reveal the temporal and selective requirement of conserved MT regulator in the SM lineage that may contribute to the differences in dynamics between precursor and differentiated cells.
Conserved depolymerizing kinesins, tubulin-modifying enzymes, and a tubulin isoform are required in the uterine muscles for egg laying
The Egl effects reported above resulted from systemic RNAi, whereas egg laying relies on specific cell types, including the 16 SM lineage cells (the UMCs and the vulval muscle cells), 8 hermaphrodite-specific neurons (White et al., 1986), and 22 vulval cells, as well as the proper formation of the uterine-vulval connection, and germline development. To determine which MAPs are specifically required cell-autonomously within the SM lineage for egg laying, we performed tissue-specific RNAi as introduced above. We measured egg laying following tissue-specific depletion of the 7 targets that induced Egl following systemic RNAi. Tissue-specific RNAi of 5 of these MAPs induced Egl (Figure 5A; KLP-7, KLP-13, CCPP-6, TTLL-15, and TBB-5), confirming that they act in egg laying via a role in the non-neuronal cells of the egg-laying apparatus. Only depletion of CCPP-1 did not induce Egl following tissue-specific RNAi, indicating that it acts elsewhere in the egg-laying apparatus, such as in the neurons.
Figure 5. Selective targeting of MT dynamics in UMCs affects egg laying.

(A) Comparison of brood size after depletion of MAPs inducing Egl by systemic RNAi (grey) vs. tissue-specific RNAi (orange). Asterisk (*) on orange bar = a 0.25 fold decrease in brood size compared to control worms. EGL-2, -3, -8 and -26 served as controls for Egl. EGL-2 and EGL-3 are positive controls for response to imipramine or to both drugs, respectively (Desai and Horvitz, 1989). EGL-8 depletion affects the ability of muscles to respond to both drugs (Lackner et al., 1999; Trent et al., 1983). EGL-26 is a positive control for Pvl and Egl with functional neurons (Hanna-Rose and Han, 2002). (A and B) Error bars = SEM. (B) Number of eggs laid by Egl worms per hour in liquid culture after drug stimulation by imipramine (green) or serotonin (purple). * significant reduction, p < 0.0001 in one-way ANOVA. Grey bars = 24h brood size of these worms on a plate. (C) Summary table and interpretation of results presented in A and B. (D) Individually normalized graphs representing dynamics parameters of UMCs in control and egg-laying defective (Egl) worms. Cyan = control UMC; grey = Egl worms with functional egg-laying muscles; red = Egl worms with non-functional egg-laying muscles. p value: ** < 0.01 and n.s. > 0.05, unpaired t test.
To confirm that SM-specific MAP depletion causes Egl because of muscle dysfunction, we pharmacologically stimulated egg-laying function with imipramine and serotonin. Exogenous serotonin restores egg laying when the hermaphrodite specific neurons that induce VMCs and UMCs contraction are defective or absent (Desai and Horvitz, 1989; Trent et al., 1983). Imipramine stimulates egg laying by inhibiting re-uptake of serotonin released by functional neurons (Desai and Horvitz, 1989). Restoration of egg laying in Egl worms by serotonin reveals that the muscles are functional; a response to imipramine indicates that neurons and muscles are functional. Egl worms not responding to either drug likely have non-functional muscles (Figure 5C). Egl worms that respond to both drugs are rare and likely bear defects in a yet unknown component of the egg-laying apparatus (Desai and Horvitz, 1989; Trent et al., 1983; Weinshenker et al., 1995).
In agreement with our results above that tissue specific ccpp-1(RNAi) did not induce Egl (Figure 5A), ccpp-1(RNAi) worms significantly responded to serotonin (Figure 5B), further indicating that CCPP-1 depletion does not affect muscle function. Egg laying in ttll-12(RNAi) worms was not significantly affected by tissue specific RNAi, indicating that the Egl observed in systemic RNAi strain was not due to a defect in the egg laying apparatus (Figure 5A). However, these worms failed to respond to imipramine and serotonin (Figure 5B), indicating that both the neurons and muscles were dysfunctional. All other Egl worms tested failed to respond to both drugs, demonstrating that CCPP-6, KLP-7, KLP-13, TBB-5 and TTLL-15 are required in UMCs for proper egg-laying (Figure 5B and 5C). Collectively, these results suggest that UMC function requires MT dynamics regulated at at least three levels (tubulin isoform, tubulin post-translational modification and MT dynamics regulation by MAPs).
MT dynamics are dampened in dysfunctional uterine muscles
To test whether UMC egg laying dysfunction correlates with alteration of MT dynamics, we analyzed MT dynamics in UMCs after depletion of MAPs inducing Egl (Figure 5D, Table S3). The depletions that affect muscle functions each caused different modifications of dynamic parameters, but all had reduced global MT dynamics (smaller diamond graphs). In each condition that resulted in Egl, at least two parameters were significantly reduced. These depletions inducing Egl did not dramatically change cellular morphology of the UMCs (Figure S3), supporting the idea that the functional defects are caused in part by alterations of MT dynamics in these cells rather than defects in tissue morphogenesis. Interestingly, CCPP-1 and TTLL-12 depletions, which did not affect muscle function, either had no effect or significantly increased MT dynamics parameter values (Figure 5D and Table S3). These results suggest that proper UMC function requires highly dynamic MTs.
CLS-1CLASP and KLP-7MCAK are differentially required for MT dynamics and cell function in the precursor SM and differentiated UMC
Our RNAi screen, tissue specific RNAi and drug treatments refined the list of candidates for selective MT regulation in precursor versus differentiated cells. We next tested whether MAPs implicated specifically in tissue biogenesis or in tissue function contribute to the differences in MT dynamics between the SM and UMCs. We selected two targets based on three criteria. First, they are expected to have opposite effects on MT dynamics. CLS-1 is a conserved TOG domain containing MAP that stabilizes MTs by promoting rescue (Al-Bassam et al., 2010). KLP-7, the only known C. elegans kinesin-13 (Siddiqui, 2002), is a homolog of mitotic centrosome associated kinesin (MCAK), a MT depolymerizing motor protein (Desai et al., 1999; Gardner et al., 2011; Srayko et al., 2005; Walczak et al., 1996). Also, they are both expressed in the SM lineage (Hill et al., 2000; McKay et al., 2003). Lastly, the effects of their depletion on brood size suggested that CLS-1CLASP and KLP-7MCAK act preferentially during tissue biogenesis and tissue function, respectively (Table S2).
CLS-1CLASP depletion specifically perturbed tissue biogenesis, as depletion early, but not late, affected egg laying and perturbed vulval morphogenesis, resulting in Pvl following both systemic and tissue specific RNAi (Figure 4 and Table S2). This early effect on egg laying was specific to somatic cells, as germline expansion and gametogenesis were unaffected (Figure 4B and Table S2). Conversely, KLP-7MCAK depletion disrupted egg laying whether it was initiated before or after tissue biogenesis (Figure 3D, Table S2). Worms depleted of KLP-7MCAK also failed to respond to serotonin (Figure 5B) and tissue specific depletion also resulted in Egl (Figure 5A). Several published findings also support the idea that MCAK plays an important role in MT dynamics in differentiated cells (Ghosh-Roy et al., 2012; Peris et al., 2009).
Analysis of MT dynamics in CLS-1CLASP depleted SM cells revealed a significant increase in shrinkage rate and catastrophe frequency, in agreement with published activities of CLASPs (Al-Bassam et al., 2010; Mimori-Kiyosue et al., 2005). The strong increases in catastrophe frequency and shrinkage rate collectively reflect MT destabilization. Interestingly, although CLS-1CLASP depletion from SM strongly increases rescue frequency and shrinkage rate, it did not affect these parameters in UMCs. However, CLS-1CLASP depletion increased the shrinkage rate specifically of bundled MTs in UMCs and reduced the abundance of bundles (Figure 6C and 6D, Table S4), suggesting that, like its homologs in yeast, flies and mammals (Akhmanova et al., 2001; Bratman and Chang, 2007; Mimori-Kiyosue et al., 2005), CLS-1CLASP preferentially associates with and stabilizes bundled MTs. Despite the effects on MT dynamics in UMCs (Figure 6D), egg laying was quantitatively normal (Figure 3D and Table S2), demonstrating that UMCs are also robust to some alterations of cytoskeletal dynamics. As shown earlier in Figure 5D, this result also suggests that an increase in dynamics is not necessarily deleterious for differentiated cells, while dampened dynamics does correlate with cellular dysfunction.
We next measured MT dynamics in worms treated with klp-7 RNAi. As observed in cultured mammalian cells (Kline-Smith and Walczak, 2002), catastrophe frequency was reduced following depletion of KLP-7MCAK from UMCs. Growth and shrinkage rates, and catastrophe frequency were also significantly reduced following KLP-7MCAK depletion from UMCs. KLP-7MCAK depletion from UMCs caused prominent MT buckling (Movie S5) and an increase in MT residence time at the cortex (10.02 ± 1.11 sec versus 3.84 ± 0.18 sec in controls; Figure 6A and 6B). Although KLP-7MCAK depletion did not affect tissue biogenesis, MT dynamics were quantitatively different in control and KLP-7MCAK depleted SM cells (Figure 6D, Table S4), indicating that the cell fitness required for tissue biogenesis is robust to some variation in dynamics, notably an increase in growth rate and rescue frequency. Interestingly, KLP-7MCAK depletion induces the opposite effect on growth rate and rescue frequency in the SM versus UMCs, suggesting that differentiation induces a distinct role or regulation of the same protein or a change in the suite of MAPs that regulates a given dynamics parameter. This inverse effect of the same depletion at two different stages of the same lineage may help explain the stage specific phenotype observed in our screens.
Collectively, this work has begun to define the molecular differences underlying the evolution of MT dynamics over the course of differentiation in vivo.
DISCUSSION
The dynamic properties of MTs enable them to both adapt to and promote morphological changes at the subcellular and cellular level. The large diversity of tubulin isotypes, post-translational modifications and MAPs combine to generate seemingly infinite possibilities of MT dynamics, such that measurements from different cell types and contexts may not be generalizable, and data from diverse cell types and divergent species will be necessary for a thorough understanding of MT functions. Here, we explored how MT dynamics are modified during cell differentiation and tissue morphogenesis of a somatic cell lineage within an intact developing organism. Both molecular and dynamics signatures change in a manner dependent on differentiation. In addition, the modulation of the four major MT dynamics parameters is uncoupled, indicating their regulation can be altered independently.
The dynamics parameters of the SM lineage are within an order of magnitude of those of other cell types and other species, revealing a relative universality of MT dynamics among various taxa and culture conditions. Interestingly, dynamics parameters in the SM lineage are similar to those in the C. elegans zygote, with the exception of growth rate, which is around 3 times higher in the zygote (~0.12 versus ~0.4 μm/sec; (Labbe et al., 2003; Srayko et al., 2005)). Catastrophe frequency in the SM (0.18 sec−1) is relatively close to that of the mitotic zygote (0.20 sec−1) and significantly higher than in UMCs (0.045 sec−1), indicating that a decrease in catastrophe frequency occurs during cell differentiation in C. elegans. The most divergent measure in our study compared to the literature is the depolymerization rate in UMCs, at 0.85 μm/sec, lower only than that observed in clarified Xenopus extract (Parsons and Salmon, 1997).
Published work suggested that the MT network must be rapidly remodeled in mitotically active cells (Cassimeris et al., 1988) whereas in differentiated cells, it is thought to be more stable (Baas et al., 1993; Baas et al., 1991; Bre et al., 1991; Bulinski and Gundersen, 1991; Lim et al., 1989; Schulze and Kirschner, 1987), presumably to maintain cell integrity, compartmentalization or polarization. We were therefore surprised by the relatively high dynamicity of MTs in differentiated UMCs, where MTs grow persistently and are relatively long. This observation is however consistent with the relatively high MT dynamics measured in mouse skeletal muscles in vivo (Oddoux et al., 2013). The length of MT filaments confers different physical properties including flexural rigidity (Li et al., 2006; Tounsi et al., 2010) and resistance to compressive loads (Brangwynne et al., 2006), and the activity of MAPs such as the depolymerizing kinesin Kip3 has been shown to be dependent on MT length (Gardner et al., 2011). The prominent MT bundling we observed in UMCs, together with persistent growth and substantial length, may endow the MT network with properties required for the function of particular differentiated cells such as contractile cells.
Depletion of CLS-1CLASP and KLP-7MCAK, as well as of MAPs inducing Egl, differentially affected MT dynamics at different stages of development. Surprisingly, catastrophe frequency was not reduced in KLP-7MCAK-depleted SM cells, whereas KLP-7MCAK depletion in UMCs (Figure 6D) and in Ptk2 cells (Kline-Smith and Walczak, 2002) decreased catastrophe frequency. Compared to mammalian cultured cells, the control catastrophe frequency is very high in our system (0.15 ± 0.0068 versus 0.012 ± 0.0018 sec−1). Catastrophe frequency is regulated by multiple other factors including tubulin concentration (Erickson and O’Brien, 1992). It is possible that KLP-7MCAK depletion from C. elegans SM-lineage cells increases polymer mass and thus decreases tubulin concentration, resulting in higher catastrophe frequency.
Our screens implicated sets of MAPs in the biogenesis versus function of several tissues. Interestingly, depletion of some MAPs specifically perturbed morphogenesis of somatic cells of the egg-laying apparatus without blocking expansion and differentiation of the germline (Pvl non sterile; Table S2). Egg production begins at the adult stage but the formation of the somatic gonad relies on cell divisions occurring at the L3 stage, at the same time as the SM lineage divisions (Kipreos, 2005; Sulston and Horvitz, 1977). This tissue-specific effect of RNAi suggests that the protein requirements for cell division or early differentiation are different in the somatic gonad versus muscle lineage. Egg production also requires meiotic divisions and proliferation of germline stem cells, which are the sole stem cells in adult worms (Kimble and Hirsh, 1979; Seydoux and Schedl, 2001). The concept that stem cells and somatic cells have distinct molecular requirements for cell division has implications for selective inhibition of cell proliferation by anti-mitotic cancer chemotherapeutics.
Various MT-binding anti-cancer agents block cell division by inhibiting MT dynamics but also lead to severe side effects by affecting MTs in normal, non-mitotic cardiovascular (Yeh et al., 2004) and neurological tissues (Dumontet and Jordan, 2010; Jordan and Wilson, 2004; Zhou and Giannakakou, 2005). Our characterization of MT dynamics during differentiation of a single cell lineage in vivo reveals several concepts that could aid distinguishing the nature of MTs among proliferating, post-mitotic and differentiated cells, and the characterization and selection of more selective anti-cancer MT-binding agents with less deleterious effects on differentiated cells. Our assays for MT dynamics in vivo could be used for the development of such drugs, as well as the cell biological characterization of other subcellular events in tissue biogenesis, morphogenesis, differentiation and function.
EXPERIMENTAL PROCEDURES
Worm culture
Worm strains N2 (Bristol), NK682, NK741 and MDX12 were maintained at 25°C and MDX20 at 20°C using standard procedures (Brenner, 1974). For in vivo imaging and feeding experiments, worms were synchronized with alkaline bleach (1.2% NaOCl, 250 mM KOH in water; (Stiernagle, 2006). Time of postembryonic development after plating synchronized starved L1 worms on feeding plates and growth at 25°C: imaging SM cells in L3: 25–27h; first SM division: 27.5–28h; imaging 8 undifferentiated SM cells: 38h post-hatching; initiation of cell elongation: 42h; imaging UMC in adults: 48–55h.
Live imaging of intact nematodes
L3 larvae or adult worms were anesthetized (see details in Supplemental Experimental Procedures) and imaged with a real-time Swept Field Confocal (Nikon Canada, Mississauga, ON, Canada; and Prairie Technologies, Madison, WI, USA) using the 50 μm slit mode without binning on a CoolSnap HQ2 camera (Photometrics, Tucson, AZ). For Z-series and volume view, 60X or 100X/1.4 NA Plan-Apochromat objectives were used to acquire confocal Z sections with 500 μm steps.
RNA interference
20 to 30 worms were placed on a plate seeded with HT115 bacterial strain containing the L4440 vector for IPTG mediated induction of dsRNA expression as described (Kamath et al., 2001). Individual bacterial clones from the Arhinger library were kindly provided by Jean-Claude Labbé (IRIC, Université de Montréal) and targets of all clones used in this study were confirmed by sequencing. For L1-feeding, L1-stage synchronized worms were plated for at least 50 hours. Three hermaphrodites were then transferred to a new feeding plate to count eggs laid in 24 hours. For L4-feeding, L1-stage synchronized worms were grown on regular NGM plates for 44 hours, on RNA feeding plates for 24 hours, and then transferred in groups of three to a fresh feeding plate for the calculation of a 24 hour brood size.
Egg laying based screen and phenotype scoring
Developmental arrest (Dev), sterility (Ste) and protruded vulva (Pvl) after L1- and L4-feeding and number of eggs were observed using a stereomicroscope (Nikon Canada, Mississauga, ON, Canada; Table S2). Defective egg laying (Egl) was scored by counting the number of eggs laid per day and per worm. MDX12 and NK741 worms fed with control empty vector L4440 laid 58.9±6.6 and 43.9±3.4 eggs per day, respectively. A significant decrease in egg-laying was defined as less than 0.75 times the number laid by control worms i.e., < 44.1 and < 32.9 eggs/worm/24h for MDX12 and NK741 respectively. Results were plotted and statistically analyzed using Prism 6 (GraphPad Software, Inc.).
Pharmacological stimulation of egg laying
Stimulation of egg laying was performed as described (Desai and Horvitz, 1989; Trent et al., 1983). Adult worms grown on RNAi feeding plates were transferred singly to liquid culture in 100 μl of M9 solution (22 mM KH2PO4, 42 mM Na2HPO4, 85.5 mM NaCl and 1 mM MgSO4) in transparent 96-well plates and incubated 1 h with 0.5 mg/ml (1.6 mM) imipramine or 3 mg/ml (14 mM) serotonin. Without any drug, worms do not lay eggs in liquid culture. The number of eggs laid after drug stimulation was counted using a stereoscope. Results were plotted and statistically analyzed using Prism 6 (GraphPad Software, Inc.).
Image processing and Analysis of MT dynamics
Images, Z-stacks and movies were processed in ImageJ software (32 bits; NIH). Kymographs were extracted using the ImageJ plugin ‘Multiple kymograph’ (http://www.embl.de/eamnet/html/kymograph.html). The characterization of MT dynamics primarily refers to the measurement of growth and shrinking rates as well as the frequency of transition between events (Desai and Mitchison, 1997). The term catastrophe is defined as the transition between polymerization and depolymerization, whereas rescue describes the reverse transition. We calculated dynamic parameters by defining catastrophe frequency per unit time or per unit distance as the inverse of the average growth time or the average growth distance, respectively (Desai and Mitchison, 1997; Komarova et al., 2002; Walker et al., 1988). Similarly, rescue frequencies per unit time and per unit distance are the inverse of the average shrinkage time and the average shrinkage distance, respectively. Dynamics parameters were extracted from kymographs using ImageJ and compiled in Excel (Microsoft). Scatter plots, histograms and statistical analyses were generated and performed using Prism 6 (GraphPad Software). Diamond graphs were created using custom MATLAB-based software (MathWorks). Parameters were either individually or jointly normalized as follows: for joint normalization, rates and frequencies were each jointly normalized since they are expressed with the same units. Jointly normalized diamond graphs allow a visual emphasis on one parameter but have lower dynamic range per parameter.
Statistical analysis
All p values were determined using Prism 6 (GraphPad software) using unpaired t tests, except for Figure 5B (Ordinary one-way ANOVA). Since dynamics parameters have different variances in SM and UMCs, we used the unequal variance unpaired t test with the Welch’s correction for normally distributed populations with unequal standard deviation.
Alteration of differentiation by RNAi feeding
To block differentiation but not expansion of the SM lineage, we depleted LIN-12Notch starting from L2, such that the SM cells were born before RNAi. Depletion initiated at the L1 stage eliminated GFP::tubulin expression in the SM lineage (not shown), likely due to a ventral-to-dorsal fate transformation of the M lineage (Foehr and Liu, 2008).
Supplementary Material
Highlights.
Microtubule (MT) dynamics were followed throughout differentiation in situ
MT dynamics are regulates step-wise over the course of differentiation
Distinct MAPs are required for tissue biogenesis and tissue function
Selective MT dynamics are required in proliferative versus differentiated cells
Acknowledgments
We thank Juliette van Dijk, Joël Ryan, Gloria Assaker and Ben Kwok for critical reading of the manuscript and Joël Ryan for technical assistance. We are grateful to Abigail Gerhold and Jean-Claude Labbé (IRIC) for providing essential reagents. This work was supported by CRS postdoctoral fellowship F2011-16307 to B.L. and operating funds from the National Science and Engineering Research Council of Canada (355657-2011) and National Institutes of Health (USA; GM102390-01) to A.S.M.
Footnotes
Publisher's Disclaimer: This is a PDF file of an unedited manuscript that has been accepted for publication. As a service to our customers we are providing this early version of the manuscript. The manuscript will undergo copyediting, typesetting, and review of the resulting proof before it is published in its final citable form. Please note that during the production process errors may be discovered which could affect the content, and all legal disclaimers that apply to the journal pertain.
References
- Akhmanova A, Hoogenraad CC, Drabek K, Stepanova T, Dortland B, Verkerk T, Vermeulen W, Burgering BM, De Zeeuw CI, Grosveld F, et al. Clasps are CLIP-115 and -170 associating proteins involved in the regional regulation of microtubule dynamics in motile fibroblasts. Cell. 2001;104:923–935. doi: 10.1016/s0092-8674(01)00288-4. [DOI] [PubMed] [Google Scholar]
- Al-Bassam J, Kim H, Brouhard G, van Oijen A, Harrison SC, Chang F. CLASP promotes microtubule rescue by recruiting tubulin dimers to the microtubule. Dev Cell. 2010;19:245–258. doi: 10.1016/j.devcel.2010.07.016. [DOI] [PMC free article] [PubMed] [Google Scholar]
- Baas PW, Ahmad FJ, Pienkowski TP, Brown A, Black MM. Sites of microtubule stabilization for the axon. J Neurosci. 1993;13:2177–2185. doi: 10.1523/JNEUROSCI.13-05-02177.1993. [DOI] [PMC free article] [PubMed] [Google Scholar]
- Baas PW, Slaughter T, Brown A, Black MM. Microtubule dynamics in axons and dendrites. J Neurosci Res. 1991;30:134–153. doi: 10.1002/jnr.490300115. [DOI] [PubMed] [Google Scholar]
- Belmont LD, Hyman AA, Sawin KE, Mitchison TJ. Real-time visualization of cell cycle-dependent changes in microtubule dynamics in cytoplasmic extracts. Cell. 1990;62:579–589. doi: 10.1016/0092-8674(90)90022-7. [DOI] [PubMed] [Google Scholar]
- Brangwynne CP, MacKintosh FC, Kumar S, Geisse NA, Talbot J, Mahadevan L, Parker KK, Ingber DE, Weitz DA. Microtubules can bear enhanced compressive loads in living cells because of lateral reinforcement. J Cell Biol. 2006;173:733–741. doi: 10.1083/jcb.200601060. [DOI] [PMC free article] [PubMed] [Google Scholar]
- Bratman SV, Chang F. Stabilization of overlapping microtubules by fission yeast CLASP. Dev Cell. 2007;13:812–827. doi: 10.1016/j.devcel.2007.10.015. [DOI] [PMC free article] [PubMed] [Google Scholar]
- Bre MH, Pepperkok R, Kreis TE, Karsenti E. Cellular interactions and tubulin detyrosination in fibroblastic and epithelial cells. Biol Cell. 1991;71:149–160. doi: 10.1016/0248-4900(91)90061-q. [DOI] [PubMed] [Google Scholar]
- Brenner S. The genetics of Caenorhabditis elegans. Genetics. 1974;77:71–94. doi: 10.1093/genetics/77.1.71. [DOI] [PMC free article] [PubMed] [Google Scholar]
- Brodu V, Baffet AD, Le Droguen PM, Casanova J, Guichet A. A developmentally regulated two-step process generates a noncentrosomal microtubule network in Drosophila tracheal cells. Dev Cell. 2010;18:790–801. doi: 10.1016/j.devcel.2010.03.015. [DOI] [PubMed] [Google Scholar]
- Bulinski JC, Gundersen GG. Stabilization of post-translational modification of microtubules during cellular morphogenesis. Bioessays. 1991;13:285–293. doi: 10.1002/bies.950130605. [DOI] [PubMed] [Google Scholar]
- Cassimeris L, Pryer NK, Salmon ED. Real-time observations of microtubule dynamic instability in living cells. J Cell Biol. 1988;107:2223–2231. doi: 10.1083/jcb.107.6.2223. [DOI] [PMC free article] [PubMed] [Google Scholar]
- Cassimeris L, Spittle C. Regulation of microtubule-associated proteins. Int Rev Cytol. 2001;210:163–226. doi: 10.1016/s0074-7696(01)10006-9. [DOI] [PubMed] [Google Scholar]
- Corsi AK, Kostas SA, Fire A, Krause M. Caenorhabditis elegans twist plays an essential role in non-striated muscle development. Development. 2000;127:2041–2051. doi: 10.1242/dev.127.10.2041. [DOI] [PubMed] [Google Scholar]
- de Forges H, Bouissou A, Perez F. Interplay between microtubule dynamics and intracellular organization. Int J Biochem Cell Biol. 2012;44:266–274. doi: 10.1016/j.biocel.2011.11.009. [DOI] [PubMed] [Google Scholar]
- Desai A, Mitchison TJ. Microtubule polymerization dynamics. Annu Rev Cell Dev Biol. 1997;13:83–117. doi: 10.1146/annurev.cellbio.13.1.83. [DOI] [PubMed] [Google Scholar]
- Desai A, Verma S, Mitchison TJ, Walczak CE. Kin I kinesins are microtubule-destabilizing enzymes. Cell. 1999;96:69–78. doi: 10.1016/s0092-8674(00)80960-5. [DOI] [PubMed] [Google Scholar]
- Desai C, Horvitz HR. Caenorhabditis elegans mutants defective in the functioning of the motor neurons responsible for egg laying. Genetics. 1989;121:703–721. doi: 10.1093/genetics/121.4.703. [DOI] [PMC free article] [PubMed] [Google Scholar]
- Distel M, Hocking JC, Volkmann K, Koster RW. The centrosome neither persistently leads migration nor determines the site of axonogenesis in migrating neurons in vivo. J Cell Biol. 2010;191:875–890. doi: 10.1083/jcb.201004154. [DOI] [PMC free article] [PubMed] [Google Scholar]
- Dumontet C, Jordan MA. Microtubule-binding agents: a dynamic field of cancer therapeutics. Nat Rev Drug Discov. 2010;9:790–803. doi: 10.1038/nrd3253. [DOI] [PMC free article] [PubMed] [Google Scholar]
- Eisenmann DM, Kim SK. Protruding vulva mutants identify novel loci and Wnt signaling factors that function during Caenorhabditis elegans vulva development. Genetics. 2000;156:1097–1116. doi: 10.1093/genetics/156.3.1097. [DOI] [PMC free article] [PubMed] [Google Scholar]
- Erickson HP, O’Brien ET. Microtubule dynamic instability and GTP hydrolysis. Annu Rev Biophys Biomol Struct. 1992;21:145–166. doi: 10.1146/annurev.bb.21.060192.001045. [DOI] [PubMed] [Google Scholar]
- Espiritu EB, Krueger LE, Ye A, Rose LS. CLASPs function redundantly to regulate astral microtubules in the C. elegans embryo. Dev Biol. 2012;368:242–254. doi: 10.1016/j.ydbio.2012.05.016. [DOI] [PMC free article] [PubMed] [Google Scholar]
- Fletcher DA, Mullins RD. Cell mechanics and the cytoskeleton. Nature. 2010;463:485–492. doi: 10.1038/nature08908. [DOI] [PMC free article] [PubMed] [Google Scholar]
- Foehr ML, Liu J. Dorsoventral patterning of the C. elegans postembryonic mesoderm requires both LIN-12/Notch and TGFbeta signaling. Dev Biol. 2008;313:256–266. doi: 10.1016/j.ydbio.2007.10.027. [DOI] [PMC free article] [PubMed] [Google Scholar]
- Gardner MK, Zanic M, Gell C, Bormuth V, Howard J. Depolymerizing kinesins Kip3 and MCAK shape cellular microtubule architecture by differential control of catastrophe. Cell. 2011;147:1092–1103. doi: 10.1016/j.cell.2011.10.037. [DOI] [PubMed] [Google Scholar]
- Gardner MK, Zanic M, Howard J. Microtubule catastrophe and rescue. Curr Opin Cell Biol. 2013;25:14–22. doi: 10.1016/j.ceb.2012.09.006. [DOI] [PMC free article] [PubMed] [Google Scholar]
- Ghosh-Roy A, Goncharov A, Jin Y, Chisholm AD. Kinesin-13 and tubulin posttranslational modifications regulate microtubule growth in axon regeneration. Dev Cell. 2012;23:716–728. doi: 10.1016/j.devcel.2012.08.010. [DOI] [PMC free article] [PubMed] [Google Scholar]
- Gliksman NR, Parsons SF, Salmon ED. Okadaic acid induces interphase to mitotic-like microtubule dynamic instability by inactivating rescue. J Cell Biol. 1992;119:1271–1276. doi: 10.1083/jcb.119.5.1271. [DOI] [PMC free article] [PubMed] [Google Scholar]
- Good MC, Vahey MD, Skandarajah A, Fletcher DA, Heald R. Cytoplasmic volume modulates spindle size during embryogenesis. Science. 2013;342:856–860. doi: 10.1126/science.1243147. [DOI] [PMC free article] [PubMed] [Google Scholar]
- Greenwald IS, Sternberg PW, Horvitz HR. The lin-12 locus specifies cell fates in Caenorhabditis elegans. Cell. 1983;34:435–444. doi: 10.1016/0092-8674(83)90377-x. [DOI] [PubMed] [Google Scholar]
- Gundersen GG, Khawaja S, Bulinski JC. Generation of a stable, posttranslationally modified microtubule array is an early event in myogenic differentiation. J Cell Biol. 1989;109:2275–2288. doi: 10.1083/jcb.109.5.2275. [DOI] [PMC free article] [PubMed] [Google Scholar]
- Hanna-Rose W, Han M. The Caenorhabditis elegans EGL-26 protein mediates vulval cell morphogenesis. Dev Biol. 2002;241:247–258. doi: 10.1006/dbio.2001.0514. [DOI] [PubMed] [Google Scholar]
- Haque N, Gong CX, Sengupta A, Iqbal K, Grundke-Iqbal I. Regulation of microtubule-associated proteins, protein kinases and protein phosphatases during differentiation of SY5Y cells. Brain Res Mol Brain Res. 2004;129:163–170. doi: 10.1016/j.molbrainres.2004.07.001. [DOI] [PubMed] [Google Scholar]
- Heald R, Nogales E. Microtubule dynamics. J Cell Sci. 2002;115:3–4. doi: 10.1242/jcs.115.1.3. [DOI] [PubMed] [Google Scholar]
- Hill AA, Hunter CP, Tsung BT, Tucker-Kellogg G, Brown EL. Genomic analysis of gene expression in C. elegans. Science. 2000;290:809–812. doi: 10.1126/science.290.5492.809. [DOI] [PubMed] [Google Scholar]
- Janke C, Bulinski JC. Post-translational regulation of the microtubule cytoskeleton: mechanisms and functions. Nat Rev Mol Cell Biol. 2011;12:773–786. doi: 10.1038/nrm3227. [DOI] [PubMed] [Google Scholar]
- Jordan MA, Wilson L. Microtubules as a target for anticancer drugs. Nat Rev Cancer. 2004;4:253–265. doi: 10.1038/nrc1317. [DOI] [PubMed] [Google Scholar]
- Kamath RS, Fraser AG, Dong Y, Poulin G, Durbin R, Gotta M, Kanapin A, Le Bot N, Moreno S, Sohrmann M, et al. Systematic functional analysis of the Caenorhabditis elegans genome using RNAi. Nature. 2003;421:231–237. doi: 10.1038/nature01278. [DOI] [PubMed] [Google Scholar]
- Kamath RS, Martinez-Campos M, Zipperlen P, Fraser AG, Ahringer J. Effectiveness of specific RNA-mediated interference through ingested double-stranded RNA in Caenorhabditis elegans. Genome Biol. 2001;2:RESEARCH0002. doi: 10.1186/gb-2000-2-1-research0002. [DOI] [PMC free article] [PubMed] [Google Scholar]
- Kimble J, Hirsh D. The postembryonic cell lineages of the hermaphrodite and male gonads in Caenorhabditis elegans. Dev Biol. 1979;70:396–417. doi: 10.1016/0012-1606(79)90035-6. [DOI] [PubMed] [Google Scholar]
- Kimura Y, Kurabe N, Ikegami K, Tsutsumi K, Konishi Y, Kaplan OI, Kunitomo H, Iino Y, Blacque OE, Setou M. Identification of tubulin deglutamylase among Caenorhabditis elegans and mammalian cytosolic carboxypeptidases (CCPs) J Biol Chem. 2010;285:22936–22941. doi: 10.1074/jbc.C110.128280. [DOI] [PMC free article] [PubMed] [Google Scholar]
- Kipreos ET. C. elegans cell cycles: invariance and stem cell divisions. Nat Rev Mol Cell Biol. 2005;6:766–776. doi: 10.1038/nrm1738. [DOI] [PubMed] [Google Scholar]
- Kirkham M, Muller-Reichert T, Oegema K, Grill S, Hyman AA. SAS-4 is a C. elegans centriolar protein that controls centrosome size. Cell. 2003;112:575–587. doi: 10.1016/s0092-8674(03)00117-x. [DOI] [PubMed] [Google Scholar]
- Kline-Smith SL, Walczak CE. The microtubule-destabilizing kinesin XKCM1 regulates microtubule dynamic instability in cells. Mol Biol Cell. 2002;13:2718–2731. doi: 10.1091/mbc.E01-12-0143. [DOI] [PMC free article] [PubMed] [Google Scholar]
- Komarova YA, Vorobjev IA, Borisy GG. Life cycle of MTs: persistent growth in the cell interior, asymmetric transition frequencies and effects of the cell boundary. J Cell Sci. 2002;115:3527–3539. doi: 10.1242/jcs.115.17.3527. [DOI] [PubMed] [Google Scholar]
- Labbe JC, Maddox PS, Salmon ED, Goldstein B. PAR proteins regulate microtubule dynamics at the cell cortex in C. elegans. Curr Biol. 2003;13:707–714. doi: 10.1016/s0960-9822(03)00251-3. [DOI] [PubMed] [Google Scholar]
- Lackner MR, Nurrish SJ, Kaplan JM. Facilitation of synaptic transmission by EGL-30 Gqalpha and EGL-8 PLCbeta: DAG binding to UNC-13 is required to stimulate acetylcholine release. Neuron. 1999;24:335–346. doi: 10.1016/s0896-6273(00)80848-x. [DOI] [PubMed] [Google Scholar]
- Leidel S, Delattre M, Cerutti L, Baumer K, Gonczy P. SAS-6 defines a protein family required for centrosome duplication in C. elegans and in human cells. Nat Cell Biol. 2005;7:115–125. doi: 10.1038/ncb1220. [DOI] [PubMed] [Google Scholar]
- Li C, Ru CQ, Mioduchowski A. Length-dependence of flexural rigidity as a result of anisotropic elastic properties of microtubules. Biochem Biophys Res Commun. 2006;349:1145–1150. doi: 10.1016/j.bbrc.2006.08.153. [DOI] [PubMed] [Google Scholar]
- Lim SS, Sammak PJ, Borisy GG. Progressive and spatially differentiated stability of microtubules in developing neuronal cells. J Cell Biol. 1989;109:253–263. doi: 10.1083/jcb.109.1.253. [DOI] [PMC free article] [PubMed] [Google Scholar]
- Liu J, Fire A. Overlapping roles of two Hox genes and the exd ortholog ceh-20 in diversification of the C. elegans postembryonic mesoderm. Development. 2000;127:5179–5190. doi: 10.1242/dev.127.23.5179. [DOI] [PubMed] [Google Scholar]
- McKay SJ, Johnsen R, Khattra J, Asano J, Baillie DL, Chan S, Dube N, Fang L, Goszczynski B, Ha E, et al. Gene expression profiling of cells, tissues, and developmental stages of the nematode C. elegans. Cold Spring Harb Symp Quant Biol. 2003;68:159–169. doi: 10.1101/sqb.2003.68.159. [DOI] [PubMed] [Google Scholar]
- Mimori-Kiyosue Y, Grigoriev I, Lansbergen G, Sasaki H, Matsui C, Severin F, Galjart N, Grosveld F, Vorobjev I, Tsukita S, et al. CLASP1 and CLASP2 bind to EB1 and regulate microtubule plus-end dynamics at the cell cortex. J Cell Biol. 2005;168:141–153. doi: 10.1083/jcb.200405094. [DOI] [PMC free article] [PubMed] [Google Scholar]
- Mitchison T, Kirschner M. Dynamic instability of microtubule growth. Nature. 1984;312:237–242. doi: 10.1038/312237a0. [DOI] [PubMed] [Google Scholar]
- Newman AP, White JG, Sternberg PW. The Caenorhabditis elegans lin-12 gene mediates induction of ventral uterine specialization by the anchor cell. Development. 1995;121:263–271. doi: 10.1242/dev.121.2.263. [DOI] [PubMed] [Google Scholar]
- O’Connell KF, Leys CM, White JG. A genetic screen for temperature-sensitive cell-division mutants of Caenorhabditis elegans. Genetics. 1998;149:1303–1321. doi: 10.1093/genetics/149.3.1303. [DOI] [PMC free article] [PubMed] [Google Scholar]
- Oddoux S, Zaal KJ, Tate V, Kenea A, Nandkeolyar SA, Reid E, Liu W, Ralston E. Microtubules that form the stationary lattice of muscle fibers are dynamic and nucleated at Golgi elements. J Cell Biol. 2013;203:205–213. doi: 10.1083/jcb.201304063. [DOI] [PMC free article] [PubMed] [Google Scholar]
- Panda D, Miller HP, Banerjee A, Luduena RF, Wilson L. Microtubule dynamics in vitro are regulated by the tubulin isotype composition. Proc Natl Acad Sci U S A. 1994;91:11358–11362. doi: 10.1073/pnas.91.24.11358. [DOI] [PMC free article] [PubMed] [Google Scholar]
- Parsons SF, Salmon ED. Microtubule assembly in clarified Xenopus egg extracts. Cell Motil Cytoskeleton. 1997;36:1–11. doi: 10.1002/(SICI)1097-0169(1997)36:1<1::AID-CM1>3.0.CO;2-E. [DOI] [PubMed] [Google Scholar]
- Peris L, Wagenbach M, Lafanechere L, Brocard J, Moore AT, Kozielski F, Job D, Wordeman L, Andrieux A. Motor-dependent microtubule disassembly driven by tubulin tyrosination. J Cell Biol. 2009;185:1159–1166. doi: 10.1083/jcb.200902142. [DOI] [PMC free article] [PubMed] [Google Scholar]
- Reber SB, Baumgart J, Widlund PO, Pozniakovsky A, Howard J, Hyman AA, Julicher F. XMAP215 activity sets spindle length by controlling the total mass of spindle microtubules. Nat Cell Biol. 2013;15:1116–1122. doi: 10.1038/ncb2834. [DOI] [PubMed] [Google Scholar]
- Rogers SL, Rogers GC, Sharp DJ, Vale RD. Drosophila EB1 is important for proper assembly, dynamics, and positioning of the mitotic spindle. J Cell Biol. 2002;158:873–884. doi: 10.1083/jcb.200202032. [DOI] [PMC free article] [PubMed] [Google Scholar]
- Rogowski K, van Dijk J, Magiera MM, Bosc C, Deloulme JC, Bosson A, Peris L, Gold ND, Lacroix B, Grau MB, et al. A family of protein-deglutamylating enzymes associated with neurodegeneration. Cell. 2010;143:564–578. doi: 10.1016/j.cell.2010.10.014. [DOI] [PubMed] [Google Scholar]
- Sakakibara A, Ando R, Sapir T, Tanaka T. Microtubule dynamics in neuronal morphogenesis. Open Biol. 2013;3:130061. doi: 10.1098/rsob.130061. [DOI] [PMC free article] [PubMed] [Google Scholar]
- Schulze E, Kirschner M. Dynamic and stable populations of microtubules in cells. J Cell Biol. 1987;104:277–288. doi: 10.1083/jcb.104.2.277. [DOI] [PMC free article] [PubMed] [Google Scholar]
- Seydoux G, Schedl T. The germline in C. elegans: origins, proliferation, and silencing. Int Rev Cytol. 2001;203:139–185. doi: 10.1016/s0074-7696(01)03006-6. [DOI] [PubMed] [Google Scholar]
- Sharma-Kishore R, White JG, Southgate E, Podbilewicz B. Formation of the vulva in Caenorhabditis elegans: a paradigm for organogenesis. Development. 1999;126:691–699. doi: 10.1242/dev.126.4.691. [DOI] [PubMed] [Google Scholar]
- Siddiqui SS. Metazoan motor models: kinesin superfamily in C. elegans. Traffic. 2002;3:20–28. doi: 10.1034/j.1600-0854.2002.30104.x. [DOI] [PubMed] [Google Scholar]
- Srayko M, Kaya A, Stamford J, Hyman AA. Identification and characterization of factors required for microtubule growth and nucleation in the early C. elegans embryo. Dev Cell. 2005;9:223–236. doi: 10.1016/j.devcel.2005.07.003. [DOI] [PubMed] [Google Scholar]
- Stiernagle T. WormBook. 2006. Maintenance of C. elegans; pp. 1–11. [DOI] [PMC free article] [PubMed] [Google Scholar]
- Sulston JE, Horvitz HR. Post-embryonic cell lineages of the nematode, Caenorhabditis elegans. Dev Biol. 1977;56:110–156. doi: 10.1016/0012-1606(77)90158-0. [DOI] [PubMed] [Google Scholar]
- Thomas JH, Stern MJ, Horvitz HR. Cell interactions coordinate the development of the C. elegans egg-laying system. Cell. 1990;62:1041–1052. doi: 10.1016/0092-8674(90)90382-o. [DOI] [PubMed] [Google Scholar]
- Tounsi A, Heireche H, Benhassaini H, Missouri M. Vibration and length-dependent flexural rigidity of protein microtubules using higher order shear deformation theory. J Theor Biol. 2010;266:250–255. doi: 10.1016/j.jtbi.2010.06.037. [DOI] [PubMed] [Google Scholar]
- Trent C, Tsuing N, Horvitz HR. Egg-laying defective mutants of the nematode Caenorhabditis elegans. Genetics. 1983;104:619–647. doi: 10.1093/genetics/104.4.619. [DOI] [PMC free article] [PubMed] [Google Scholar]
- van der Vaart B, Akhmanova A, Straube A. Regulation of microtubule dynamic instability. Biochem Soc Trans. 2009;37:1007–1013. doi: 10.1042/BST0371007. [DOI] [PubMed] [Google Scholar]
- Wadsworth P, McGrail M. Interphase microtubule dynamics are cell type-specific. J Cell Sci. 1990;95(Pt 1):23–32. doi: 10.1242/jcs.95.1.23. [DOI] [PubMed] [Google Scholar]
- Walczak CE, Mitchison TJ, Desai A. XKCM1: a Xenopus kinesin-related protein that regulates microtubule dynamics during mitotic spindle assembly. Cell. 1996;84:37–47. doi: 10.1016/s0092-8674(00)80991-5. [DOI] [PubMed] [Google Scholar]
- Walker RA, O’Brien ET, Pryer NK, Soboeiro MF, Voter WA, Erickson HP, Salmon ED. Dynamic instability of individual microtubules analyzed by video light microscopy: rate constants and transition frequencies. J Cell Biol. 1988;107:1437–1448. doi: 10.1083/jcb.107.4.1437. [DOI] [PMC free article] [PubMed] [Google Scholar]
- Weinshenker D, Garriga G, Thomas JH. Genetic and pharmacological analysis of neurotransmitters controlling egg laying in C. elegans. J Neurosci. 1995;15:6975–6985. doi: 10.1523/JNEUROSCI.15-10-06975.1995. [DOI] [PMC free article] [PubMed] [Google Scholar]
- White JG, Southgate E, Thomson JN, Brenner S. The structure of the nervous system of the nematode Caenorhabditis elegans. Philos Trans R Soc Lond B Biol Sci. 1986;314:1–340. doi: 10.1098/rstb.1986.0056. [DOI] [PubMed] [Google Scholar]
- Wittmann T, Wilm M, Karsenti E, Vernos I. TPX2, A novel xenopus MAP involved in spindle pole organization. J Cell Biol. 2000;149:1405–1418. doi: 10.1083/jcb.149.7.1405. [DOI] [PMC free article] [PubMed] [Google Scholar]
- Yeh ET, Tong AT, Lenihan DJ, Yusuf SW, Swafford J, Champion C, Durand JB, Gibbs H, Zafarmand AA, Ewer MS. Cardiovascular complications of cancer therapy: diagnosis, pathogenesis, and management. Circulation. 2004;109:3122–3131. doi: 10.1161/01.CIR.0000133187.74800.B9. [DOI] [PubMed] [Google Scholar]
- Yoo SK, Lam PY, Eichelberg MR, Zasadil L, Bement WM, Huttenlocher A. The role of microtubules in neutrophil polarity and migration in live zebrafish. J Cell Sci. 2012;125:5702–5710. doi: 10.1242/jcs.108324. [DOI] [PMC free article] [PubMed] [Google Scholar]
- Zhang D, Jin N, Rhoades RA, Yancey KW, Swartz DR. Influence of microtubules on vascular smooth muscle contraction. J Muscle Res Cell Motil. 2000;21:293–300. doi: 10.1023/a:1005600118157. [DOI] [PubMed] [Google Scholar]
- Zhou J, Giannakakou P. Targeting microtubules for cancer chemotherapy. Curr Med Chem Anticancer Agents. 2005;5:65–71. doi: 10.2174/1568011053352569. [DOI] [PubMed] [Google Scholar]
Associated Data
This section collects any data citations, data availability statements, or supplementary materials included in this article.