

Abstract
Holdemania massiliensis strain AP2T sp. nov. is the type strain of H. massiliensis sp. nov., a new species within the genus Holdemania. This strain, whose genome is described here, was isolated from the fecal flora of a 21-year-old French Caucasian female suffering from severe restrictive anorexia nervosa. H. massiliensis is a Gram-positive, anaerobic bacillus. Here we describe the features of this organism, together with the complete genome sequence and annotation. The 3,795,625 bp-long genome (one chromosome but no plasmid) contains 3,461 protein-coding and 49 RNA genes, including 3 rRNA genes.
Keywords: Holdemania massiliensis, genome, culturomics, taxono-genomics
Introduction
Holdemania massiliensis strain AP2T (= CSUR P195 = DSM 26143) is the type strain of H. massiliensis sp. nov. This bacterium is a Gram-positive, non-spore-forming, indole negative, anaerobic and non-motile bacillus that was isolated from the stool of a 21-year-old woman suffering from anorexia as part of a “culturomics” study aiming to individually cultivate all species within human feces [1-3].
The current prokaryotic species classification, known as polyphasic taxonomy, is based on a combination of genomic and phenotypic properties [4]. The number of sequenced genomes is increasing exponentially and in parallel with the decreasing cost of sequencing. To date, more than 6,000 bacterial genomes have been published and approximately 25,000 genomes project are anticipated to be completed in a near future [5]. We recently proposed to integrate genomic information in the taxonomic framework and description of new bacterial species [6-27].
Here we present a summary classification and a set of features for H. massiliensis sp. nov. strain AP2T (= CSUR P195 = DSM 26143), together with the description of the complete genomic sequencing and annotation. These characteristics support the circumscription of the species H. massiliensis. The genus Holdemania (Willems et al. 1997) was created in 1997 on the basis of 16S rDNA gene sequence, biochemical tests, fatty acid and cell wall murein analysis [28]. To date, this genus includes a single species, H. filiformis, which was isolated from feces of healthy humans [29].
Classification and features
A stool sample was collected from a 21-year-old French Caucasian female suffering from severe restrictive anorexia nervosa, who had been hospitalized for recurrent weight loss and aggravation of her general state. She had an eight year history of mental anorexia. The patient gave an informed and signed consent. Both this study and the assent procedure were approved by the Ethics Committee of the Institut Fédératif de Recherche IFR48, Faculty of Medicine, Marseille, France and the agreement of the ethics committee of the IFR48 (Marseille, France) was obtained under reference 09-022. Several other new bacterial species were isolated from diverse stool samples using microbial culturomics [6-27]. The fecal specimen from the patient was preserved at -80°C immediately after collection. Strain AP2T (Table 1) was isolated in November 2011 after preincubation in an anaerobic blood culture bottle with the addition of 5ml of thioglycolate, and inoculation in Columbia agar (BioMerieux, Marcy l’Etoile, France).
Table 1. Classification and general features of Holdemania massiliensis strain AP2T according to the MIGS recommendations [30].
| MIGS ID | Property | Term | Evidence codea |
|---|---|---|---|
| Current classification | Domain Bacteria Phylum Firmicutes Class Erysipelotrichia Order Erysipelotrichales Family Erysipelotrichaceae Genus Holdemania Species Holdemania massiliensis Type strain AP2T |
TAS [31] TAS [32-34] TAS [35,36] TAS [36,37] TAS [38] TAS [28] IDA IDA |
|
| Gram stain | positive | IDA | |
| Cell shape | Bacillus | IDA | |
| Motility | Not motile | IDA | |
| Sporulation | Non-sporulating | IDA | |
| Temperature range | Mesophile | IDA | |
| Optimum temperature | 37°C | IDA | |
| MIGS-6.3 | Salinity | Unknown | IDA |
| MIGS-22 | Oxygen requirement | Anaerobic | IDA |
| Carbon source | Unknown | NAS | |
| Energy source | Unknown | NAS | |
| MIGS-6 | Habitat | Human gut | IDA |
| MIGS-15 | Biotic relationship | Free living | IDA |
| MIGS-14 | Pathogenicity Biosafety level Isolation |
Unknown 2 Human feces |
NAS |
| MIGS-4 | Geographic location | France | IDA |
| MIGS-5 | Sample collection time | November 2011 | IDA |
| MIGS-4.1 | Latitude Longitude |
43.296482 5.36978 |
IDA IDA |
| MIGS-4.3 | Depth | Surface | IDA |
| MIGS-4.4 | Altitude | 0 m above sea level | IDA |
Evidence codes - IDA: Inferred from Direct Assay; TAS: Traceable Author Statement (i.e., a direct report exists in the literature); NAS: Non-traceable Author Statement (i.e., not directly observed for the living, isolated sample, but based on a generally accepted property for the species, or anecdotal evidence). These evidence codes are from the Gene Ontology project [39]. If the evidence is IDA, then the property was directly observed for a live isolate by one of the authors or an expert mentioned in the acknowledgements.
This strain exhibited a 97% nucleotide sequence similarity with H. filiformis [28], and a range of 90-91% nucleotide sequence similarity to most closely related members of the genus Erysipelothrix [29] (Figure 1). This value was lower than the 98.7% 16S rRNA gene sequence threshold recommended by Stackebrandt and Ebers to delineate a new species without carrying out DNA-DNA hybridization [40].
Figure 1.
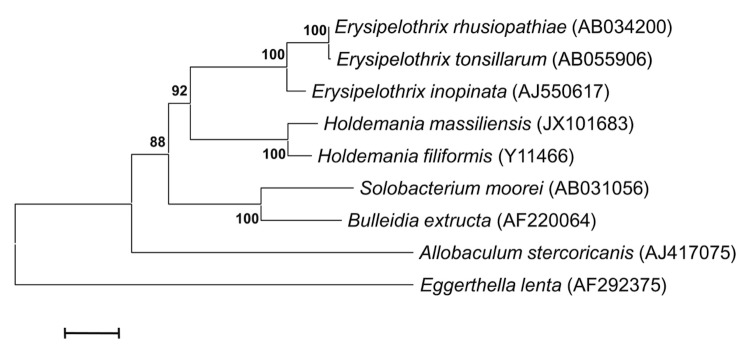
Phylogenetic tree highlighting the position of Holdemania massiliensis strain AP2T relative to other type strains within the Erysipelotrichaceae family. GenBank accession numbers are indicated in parentheses. Sequences were aligned using CLUSTALW, and phylogenetic inferences obtained using the maximum-likelihood method within MEGA program. Numbers at the nodes are percentages of bootstrap values obtained by repeating the analysis 500 times to generate a majority consensus tree. Eggerthella lenta was used as outgroup. The scale bar represents a 2% nucleotide sequence divergence.
Different growth temperatures (25, 30, 37, 45°C) were tested. Growth occurred at 25 and 30°C after 72 hours of inoculation and the optimal growth was observed at 37°C after 24 hours of inoculation. Colonies were 0.2 mm in diameter, light grey, with α-haemolysis on blood-enriched Columbia agar. Growth of the strain was tested under anaerobic and microaerophilic conditions using GENbag anaer and GENbag microaer systems, respectively (BioMérieux), and under aerobic conditions with or without 5% CO2. The strain growth was obtained only in anaerobic condition. The motility test was negative. Cells grown on agar are Gram-positive rods (Figure 2). The mean dimensions by electron microscopy were 0.57 µm in width and 1.75 µm in length (Figure 3).
Figure 2.

Gram staining of H. massiliensis strain AP2T
Figure 3.

Transmission electron microscopy of H. massiliensis strain AP2T, using a Morgani 268D (Philips) at an operating voltage of 60kV. The scale bar represents 500 nm.
Strain AP2T exhibited a positive oxidase but no catalase activity. Using an API rapid 32A strip (Biomerieux), positive reactions were obtained for β-galactosidase, α-glucosidase, α-fucosidase and pyroglutamic acid arylamidase. Substrate oxidation and assimilation was examined using an API 50CH strip (Biomerieux) at 37°C. Positive reactions were observed for glycerol, D-ribose, D-galactose, D-glucose, D-fructose, D-mannose, inositol, D-mannitol, D-sorbitol, N-acetyl-glucosamine, amygdalin, arbutin, esculin, salicin, D-cellobiose, D-maltose, D-lactose, D-saccharose, D-melezitose, gentiobiose, D-tagatose and postassium gluconate. H. massiliensis is susceptible to amoxicillin, metronidazole, vancomycin, clindamycin and imipenem. The phenotypic characteristics that differentiate H. massiliensis from other species are summarized in Table 2.
Table 2. Differential characteristics of Holdemania massiliensis strain AP2T, Holdemania filiformis strain ATCC 51649, Solobacterium moorei strain CCUG 39336 and Erysipelothrix rhusiopathiae strain ATCC 19414T.
| Properties | H. massiliensis | H. filiformis | S. moorei | E. rhusiopathiae |
|---|---|---|---|---|
| Cell diameter (µm) | 0.57 | 1.0-1.2 | 0.8-1.4 | 0.8-2.5 |
| Oxygen requirement | anaerobic | anaerobic | anaerobic | facultative anaerobes |
| Pigment production | + | – | – | – |
| Gram stain | + | + | + | + |
| Salt requirement | – | – | – | – |
| Motility | – | – | – | – |
| Peptidoglycan type | na | B1δ (L-Ala)-D-Glu-L-Asp-L-Lys- | na | B1δ (L-Ala)-D-Glu-Gly-L-Lys |
| Endospore formation | – | – | – | – |
| Production of | ||||
| Acid phosphatase | na | na | + | |
| Catalase | + | – | na | – |
| Oxidase | – | na | na | – |
| Nitrate reductase | – | – | – | – |
| Urease | – | na | na | na |
| β-galactosidase | + | na | na | – |
| N-acetyl-glucosamine | – | na | na | + |
| Acid from | ||||
| L-Arabinose | – | w | – | – |
| Ribose | + | w | + | – |
| Mannose | + | w | – | w |
| Mannitol | + | w | – | – |
| Sucrose | – | + | – | w/- |
| D-glucose | + | + | + | + |
| D-fructose | + | + | + | + |
| D-maltose | + | w | + | + |
| D-lactose | + | w | – | + |
| Hydrolysis of gelatin | na | – | – | + |
| G+C content (mol%) | 47.1 | 50.2 | 36.8 | 36.6 |
| Habitat | human gut | human gut | human gut | animal feces, environmental, human infection |
na = data not available; w = weak
Matrix-assisted laser-desorption/ionization time-of-flight (MALDI-TOF) MS protein analysis was carried out as previously described [41] using a Microflex spectrometer (Bruker Daltonics, Leipzig, Germany). Twelve individual colonies were deposited on a MTP 384 MALDI-TOF target plate (Bruker). The twelve AP2T spectra were imported into the MALDI BioTyper software (version 2.0, Bruker) and analyzed by standard pattern matching (with default parameter settings) against the main spectra of 4,706 bacteria. A score enabled the presumptive identification and discrimination of the tested species from those in a database: a score > 2 with a validated species enabled the identification at the species level; and a score < 1.7 did not enable any identification. For strain AP2T, no significant score was obtained, suggesting that our isolate was not a member of any known species (Figures 4 and 5). We added the spectrum from strain AP2T to our database (Figure 4).
Figure 4.

Reference mass spectrum from H. massiliensis strain AP2T. Spectra from 12 individual colonies were compared and a reference spectrum was generated.
Figure 5.
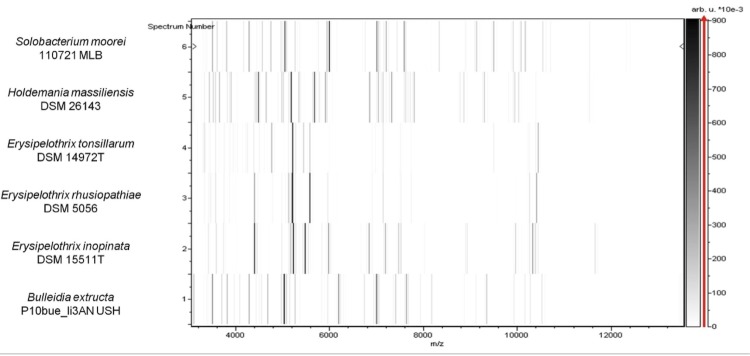
Gel view comparing Holdemania massiliensis strain AP2T, Solobacterium moorei, Erysipelothrix tonsillarum, E. rhusiopathiae, E. inopinata and Bulleida exctructa. The gel view displays the raw spectra of loaded spectrum files arranged in a pseudo-gel like look. The x-axis records the m/z value. The left y-axis displays the running spectrum number originating from subsequent spectra loading. The peak intensity is expressed as a gray scale. The color bar and the right y-axis indicate the relation between the color with which a peak is displayed and the peak intensity in arbitrary units. Displayed species are indicated on the left.
Genome sequencing information
Genome project history
The organism was selected for sequencing on the basis of its phylogenetic position and 16S rRNA similarity to other members of the Holdemania genus, and is part of a “culturomics” study of the human digestive flora aiming at isolating all bacterial species within human feces. It was the second draft genome of a Holdemania species and the first genome of Holdemania massiliensis sp. nov. A summary of the project information is shown in Table 3. The Genbank accession number is CALK00000000 and consists of 66 contigs. Table 3 shows the project information and its association with MIGS version 2.0 compliance [30].
Table 3. Project information.
| MIGS ID | Property | Term |
|---|---|---|
| MIGS-31 | Finishing quality | High-quality draft |
| MIGS-28 | Libraries used | One 454 paired end 3-kb library |
| MIGS-29 | Sequencing platforms | 454 GS FLX Titanium |
| MIGS-31.2 | Fold coverage | 54.25x |
| MIGS-30 | Assemblers | Newbler version 2.5.3 |
| MIGS-32 | Gene calling method | Prodigal |
| Gold ID | Gi20761 | |
| INSDC ID | PRJEB187 | |
| Genbank ID | CALK00000000 | |
| Genbank Date of Release | July 31, 2012 | |
| Project relevance | Study of the human gut microbiome |
Growth conditions and DNA isolation
H. massiliensis sp. nov. strain AP2T, (= CSUR P195= DSM 26143), was grown anaerobically on Columbia agar medium at 37°C. Five Petri dishes were spread and resuspended in 3x100µl of G2 buffer (EZ1 DNA Tissue kit, Qiagen). A first mechanical lysis was performed using glass powder in the Fastprep-24 device (Sample Preparation system, MP Biomedicals, USA) for 2×20 seconds. DNA was treated with 2.5 µg/µL of lysozyme (30 minutes at 37°C) and extracted using the BioRobot EZ 1 Advanced XL (Qiagen). The DNA was concentrated and purified on a Qiamp kit (Qiagen). The yield and the concentration of DNA was 69.3 ng/µl as measured by using Quant-it Picogreen kit (Invitrogen) on the Genios Tecan fluorometer
Genome sequencing and assembly
DNA (5 µg) was mechanically fragmented for the paired-end sequencing, using a Covaris device (Covaris Inc., Woburn, MA,USA) with an enrichment size of 3-4 kb. The DNA fragmentation was visualized through an Agilent 2100 BioAnalyzer on a DNA Labchip 7500 which yielded an optimal size of 3.4 kb. The library was constructed using the 454 GS FLX Titanium paired-end rapid library protocol (Roche, Meylan, France). Circularization and nebulization were performed which generated a pattern of optimal size of 589 bp. PCR amplification was performed for 17 cycles followed by double size selection. The single-stranded paired-end library was quantified using a Quant-it Ribogreen Kit (Invitrogen) using the Genios Tecan fluorometer. The library concentration equivalence was calculated as 1.42× 10¹⁰ molecules/µL. The library was stored at -20°C until further use.
For the shotgun sequencing, DNA (500 ng) was mechanically fragmented using a Covaris device (Covaris Inc.) as described by the manufacturer. The DNA fragmentation was visualized using an Agilent 2100 BioAnalyzer on a DNA Labchip 7500 which yielded an optimal size of 1.7 kb. The library was constructed using the GS Rapid library Prep kit (Roche) and quantified using a TBS 380 mini fluorometer (Turner Biosystems, Sunnyvale, CA, USA). The library concentration equivalence was calculated as 2.8× 10⁹ molecules/µL. The library was stored at -20°C until further use.
The shotgun library was clonally amplified with 1 and 2 cpb in two emPCR reactions each, and the paired-end library was amplified with 0.5 cpb in three emPCR reactions using the GS Titanium SV emPCR Kit (Lib-L) v2 (Roche). The yields of the emPCR were 6.8 and 9.8%, respectively, for the shotgun library, and 11.29% for the paired-end library. These yields fall into the expected 5 to 20% range according to Roche protocol.
For each library, approximately 790,000 beads for a quarter region were loaded on the GS Titanium PicoTiterPlate PTP kit and sequenced with the GS FLX Titanium Sequencing Kit XLR70 (Roche). The run was performed overnight and analyzed on a cluster using the gsRunBrowser and Newbler assembler (Roche). For the shotgun sequencing, 188,659 passed-filter wells were obtained. The sequencing generated 129.3 Mb with an average length of 685 bp. For the paired-end sequencing, 106,675 passed-filter wells were obtained. The sequencing generated 35 Mb with an average length of 262 bp. The passed-filter sequences were assembled using Newbler with 90% identity and 40 bp as overlap. The final assembly identified 8 scaffolds and 66 contigs (>1,500 bp) and generated a genome size of 3.79 Mb which corresponds to a coverage of 54.25 genome equivalents.
Genome annotation
Open Reading Frames (ORFs) were predicted using Prodigal [42] with default parameters, but the predicted ORFs were excluded if they were spanning a sequencing gap region. The predicted bacterial protein sequences were searched against the GenBank database [43] and the Clusters of Orthologous Groups (COG) databases using BLASTP. The tRNAScanSE tool [44] was used to find tRNA genes, whereas ribosomal RNAs were found by using RNAmmer [45] and BLASTn against the GenBank database. Lipoprotein signal peptides and numbers of transmembrane helices were predicted using SignalP [46] and TMHMM [47] respectively. ORFans were identified if their BLASTP E-value was lower than 1e-03 for alignment length greater than 80 amino acids. If alignment lengths were smaller than 80 amino acids, we used an E-value of 1e-05. Such parameter thresholds have already been used in previous works to define ORFans. Ortholog sets composed of one gene from each of the four genomes H. massiliensis strain AP2T, Holdemania filiformis strain ATCC 51649 (GenBank accession number ACCF00000000), Solobacterium moorei strain F0204 (AECQ00000000), and Erysipelothrix rhusiopathiae strain Fujisawa (AP012027) were identified using Proteinortho software (version 1.4) [48] by using cut-off values of 30% protein identity and an E-value of 1e-05. The average percentages of nucleotide sequence identity between corresponding orthologous sets were determined using the Needleman-Wunsch algorithm global alignment technique. Artemis [49] was used for data management and DNA Plotter [50] was used for visualization of genomic features. The Mauve alignment tool was used for multiple genomic sequence alignment and visualization [51].
Genome properties
The genome of H. massiliensis strain AP2T is 3,795,625 bp long (1 chromosome, no plasmids) with a 47.1% G + C content (Figure 6 and Table 4). Of the 3,510 predicted genes, 3,461 were protein-coding genes, and 49 were RNAs. Three rRNA genes (one 16S rRNA, one 23S rRNA and one 5S rRNA) and 46 predicted tRNA genes were identified in the genome. A total of 2,581 genes (74.57%) were assigned a putative function. Two hundred thirteen genes were identified as ORFans (6.06%). The remaining genes were annotated as hypothetical proteins. The properties and the statistics of the genome are summarized in Table 4 and Table 5. The distribution of genes into COGs functional categories is presented in Table 5.
Figure 6.

Graphical circular map of the chromosome. From the outside in, the outer two circles show open reading frames oriented in the forward (colored by COG categories) and reverse (colored by COG categories) directions, respectively. The third circle marks the rRNA gene operon (red) and tRNA genes (green). The fourth circle shows the G+C% content plot. The innermost circle shows GC skew, with purple indicating negative values and olive positive values.
Table 4. Nucleotide content and gene count levels of the genome.
| Attribute | Value | % of totala |
|---|---|---|
| Genome size (bp) | 3,795,625 | |
| DNA coding region (bp) | 3,333,369 | 87.82 |
| DNA G+C content (bp) | 1,787,739 | 47.10 |
| Number of replicons | 1 | |
| Extrachromosomal elements | 0 | |
| Total genes | 3,510 | 100 |
| RNA genes | 49 | 1.39 |
| rRNA operons | 1 | |
| Protein-coding genes | 3,461 | 98.60 |
| Genes with function prediction | 2,652 | 75.56 |
| Genes assigned to COGs | 2,581 | 74.57 |
| Genes with peptide signals | 258 | 7.35 |
| Genes with transmembrane helices | 908 | 36.17 |
| CRISPR repeats | 7 |
a The total is based on either the size of the genome in base pairs or the total number of protein coding genes in the annotated genome
Table 5. Number of genes associated with the 25 general COG functional categories.
| Code | Value | %agea | Description |
|---|---|---|---|
| J | 153 | 4.42 | Translation |
| A | 0 | 0 | RNA processing and modification |
| K | 365 | 10.55 | Transcription |
| L | 137 | 3.96 | Replication, recombination and repair |
| B | 0 | 0 | Chromatin structure and dynamics |
| D | 36 | 1.04 | Cell cycle control, mitosis and meiosis |
| Y | 0 | 0 | Nuclear structure |
| V | 110 | 3.18 | Defense mechanisms |
| T | 165 | 4.77 | Signal transduction mechanisms |
| M | 171 | 4.94 | Cell wall/membrane biogenesis |
| N | 11 | 0.32 | Cell motility |
| Z | 1 | 0.03 | Cytoskeleton |
| W | 0 | 0 | Extracellular structures |
| U | 27 | 0.78 | Intracellular trafficking and secretion |
| O | 56 | 1.62 | Posttranslational modification, protein turnover, chaperones |
| C | 149 | 4.31 | Energy production and conversion |
| G | 372 | 10.75 | Carbohydrate transport and metabolism |
| E | 178 | 5.14 | Amino acid transport and metabolism |
| F | 71 | 2.05 | Nucleotide transport and metabolism |
| H | 43 | 1.24 | Coenzyme transport and metabolism |
| I | 41 | 1.18 | Lipid transport and metabolism |
| P | 119 | 3.44 | Inorganic ion transport and metabolism |
| Q | 44 | 1.27 | Secondary metabolites biosynthesis, transport and catabolism |
| R | 403 | 11.64 | General function prediction only |
| S | 203 | 5.87 | Function unknown |
| - | 880 | 25.43 | Not in COGs |
a The total is based on the total number of protein coding genes in the annotated genome.
Genome comparison with Holdemania filiformis, Solobacterium moorei and Erysipelothrix rhusiopathiae
Here, we compared the genome of H. massiliensis strain AP2T, with those of H. filiformis strain ATCC 51649 (GenBank accession number ACCF00000000), S. moorei strain F0204 (AECQ00000000), and E. rhusiopathiae strain Fujisawa (AP012027).
The draft genome of H. massiliensis is comparable in size to that of H. filiformis (3.79 and 3.80 Mb, respectively) and larger in size than those of S. moorei and E. rhusiopathiae (2.01 and 1.79 Mb, respectively). The G+C content of H. massiliensis is smaller than that of H. filiformis (47.10 and 50.18%, respectively) but higher than those of S. moorei and E. rhusiopathiae (36.80 and 36.60%, respectively).
The gene content of H. massiliensis is lower than that of H. filiformis (3,510 and 4,272, respectively) but higher than those of S. moorei and E. rhusiopathiae (2,081 and 1,780, respectively). The ratio of genes per Mb of H. massiliensis is smaller to those of H. filiformis, S. moorei and E. rhusiopathiae (926, 1,124, 1,035 and 994, respectively). However, the distribution of genes into COG categories was almost similar in all compared genomes (Figure 7).
Figure 7.

Distribution of functional classes of predicted genes on Holdemania massiliensis (colored in blue), Holdemania filiformis (colored in red), Solobacterium moorei (colored in green) and Erysipelothrix rhusiopathiae (colored in yellow) chromosomes according to the clusters of orthologous groups of proteins.
The nucleotide sequence identity ranged from 62.02 to 84.32% among compared genomes. Table 6 summarizes the numbers of orthologous genes and the average percentage of nucleotide sequence identity between the different genomes studied.
Table 6. The numbers of orthologous proteins shared between genomes (upper right)*.
| H. massiliensis | H. filiformis | S. morei | E. rhusiopathiae | |
|---|---|---|---|---|
| H. massiliensis | 3,461 | 1,005 | 870 | 690 |
| H. filiformis | 84.32 | 4,223 | 866 | 686 |
| S. morei | 63.82 | 62.88 | 1,982 | 551 |
| E. rhusiopathiae | 63.14 | 62.02 | 65.48 | 1,697 |
*average percentage similarity of nucleotides corresponding to orthologous proteins shared between genomes (lower left) and the numbers of proteins per genome (bold).
Conclusion
On the basis of phenotypic, phylogenetic and genomic analyses, we formally propose the creation of Holdemania massiliensis sp. nov. that contains the strain AP2T. This bacterial strain has been found in Marseille, France.
Description of Holdemania massiliensis sp. nov.
Holdemania massiliensis (mas.si.li.en′sis. L. masc. adj. massiliensis of Massilia, the Roman name of Marseille, France, where the type strain was isolated).
Colonies were 0.2 mm in diameter on blood-enriched Columbia agar and Brain Heart Infusion agar. Cells are rod-shaped with a mean diameter of 0.57 µm and a mean length of 1.75 µm. Strictly anaerobic. Growth occurs between 25 and 45°C, with optimal growth observed at 37°C. Cells stain Gram-positive, and are non-motile. Cells are positive for β-galactosidase, α-glucosidase, α-fucosidase and pyroglutamic acid arylamidase. Positive reactions were observed for glycerol, D-ribose, D-galactose, D-glucose, D-fructose, D-mannose, inositol, D-mannitol, D-sorbitol, N-acetyl-glucosamine, amygdalin, arbutin, esculin, salicin, D-cellobiose, D-maltose, D-lactose, D-saccharose, D-melezitose, gentiobiose, D-tagatose and potassium gluconate. Cells are susceptible to amoxicillin, metronidazole, vancomycin, clindamycin and imipenem. The G+C content of the genome is 47.10%. The 16S rRNA and genome sequences are deposited in GenBank under accession numbers JX101683 and CALK00000000, respectively.
The type strain AP2T (= CSUR P195 = DSM 26143) was isolated from the fecal flora of French Caucasian female suffering from severe restrictive anorexia nervosa [3].
Acknowledgements
The authors thank the Xegen Company (www.xegen.fr) for automating the genomic annotation process. This study was funded by the Mediterranee-Infection Foundation.
References
- 1.Lagier JC, Armougom F, Million M, Hugon P, Pagnier I, Robert C, Bittar F, Fournous G, Gimenez G, Maraninchi M, et al. Microbial culturomics: paradigm shift in the human gut microbiome study. Clin Microbiol Infect 2012; 18:1185-1193; . 10.1111/1469-0691 [DOI] [PubMed] [Google Scholar]
- 2.Dubourg G, Lagier JC, Armougom F, Robert C, Hamad I, Brouqui P. The gut microbiota of a patient with resistant tuberculosis is more comprehensively studied by culturomics than by metagenomics. Eur J Clin Microbiol Infect Dis 2013; 32:637-645 10.1007/s10096-012-1787-3 [DOI] [PubMed] [Google Scholar]
- 3.Pfleiderer A, Lagier JC, Armougom F, Robert C, Vialettes B, Raoult D. Culturomics identified 11 new bacterial species from a single anorexia nervosa stool sample. [Epub ahead of print]. Eur J Clin Microbiol Infect Dis 2013. [DOI] [PubMed]
- 4.Tindall BJ, Rossello-Mora R, Busse HJ, Ludwig W, Kampfer P. Notes on the characterization of prokaryote strains for taxonomic purposes. Int J Syst Evol Microbiol 2010; 60:249-266 10.1099/ijs.0.016949-0 [DOI] [PubMed] [Google Scholar]
- 5.Genome Online Database http://www.genomesonline.org/cgi-bin/GOLD/index.cgi
- 6.Kokcha S, Mishra AK, Lagier JC, Million M, Leroy Q, Raoult D, Fournier PE. Non-contiguous finished genome sequence and description of Bacillus timonensis sp. nov. Stand Genomic Sci 2012; 6:346-355 10.4056/sigs.2776064 [DOI] [PMC free article] [PubMed] [Google Scholar]
- 7.Lagier JC, El Karkouri K, Nguyen TT, Armougom F, Raoult D, Fournier PE. Non-contiguous finished genome sequence and description of Anaerococcus senegalensis sp. nov. Stand Genomic Sci 2012; 6:116-125 10.4056/sigs.2415480 [DOI] [PMC free article] [PubMed] [Google Scholar]
- 8.Mishra AK, Gimenez G, Lagier JC, Robert C, Raoult D, Fournier PE. Non-contiguous finished genome sequence and description of Alistipes senegalensis sp. nov. Stand Genomic Sci 2012; 6:304-314 10.4056/sigs.2625821 [DOI] [PMC free article] [PubMed] [Google Scholar]
- 9.Lagier JC, Armougom F, Mishra AK, Ngyuen TT, Raoult D, Fournier PE. Non-contiguous finished genome sequence and description of Alistipes timonensis sp. nov. Stand Genomic Sci 2012; 6:315-324; . 10.4056/sigs.2685971 [DOI] [PMC free article] [PubMed] [Google Scholar]
- 10.Mishra AK, Lagier JC, Robert C, Raoult D, Fournier PE. Non-contiguous finished genome sequence and description of Clostridium senegalense sp. nov. Stand Genomic Sci 2012; 6:386-395; . 10.4056/sigs.2766062 [DOI] [PMC free article] [PubMed] [Google Scholar]
- 11.Mishra AK, Lagier JC, Robert C, Raoult D, Fournier PE. Non-contiguous finished genome sequence and description of Peptoniphilus timonensis sp. nov. Stand Genomic Sci 2012; 7:1-11 10.4056/sigs.2956294 [DOI] [PMC free article] [PubMed] [Google Scholar]
- 12.Mishra AK, Lagier JC, Rivet R, Raoult D, Fournier PE. Non-contiguous finished genome sequence and description of Paenibacillus senegalensis sp. nov. Stand Genomic Sci 2012; 7:70-81; . 10.4056/sigs.3056450 [DOI] [PMC free article] [PubMed] [Google Scholar]
- 13.Lagier JC, Gimenez G, Robert C, Raoult D, Fournier PE. Non-contiguous finished genome sequence and description of Herbaspirillum massiliense sp. nov. Stand Genomic Sci 2012; 7:200-209; . 10.4056/sigs.3086474 [DOI] [PMC free article] [PubMed] [Google Scholar]
- 14.Roux V, El Karkouri K, Lagier JC, Robert C, Raoult D. Non-contiguous finished genome sequence and description of Kurthia massiliensis sp. nov. Stand Genomic Sci 2012; 7:221-232 10.4056/sigs.3206554 [DOI] [PMC free article] [PubMed] [Google Scholar]
- 15.Kokcha S, Ramasamy D, Lagier JC, Robert C, Raoult D, Fournier PE. Non-contiguous finished genome sequence and description of Brevibacterium senegalense sp. nov. Stand Genomic Sci 2012; 7:233-245 10.4056/sigs.3256677 [DOI] [PMC free article] [PubMed] [Google Scholar]
- 16.Ramasamy D, Kokcha S, Lagier JC, N’Guyen TT, Raoult D, Fournier PE. Non-contiguous finished genome sequence and description of Aeromicrobium massilense sp. nov. Stand Genomic Sci 2012; 7:246-257 10.4056/sigs.3306717 [DOI] [PMC free article] [PubMed] [Google Scholar]
- 17.Lagier JC, Ramasamy D, Rivet R, Raoult D, Fournier PE. Non-contiguous finished genome sequence and description of Cellulomonas massiliensis sp. nov. Stand Genomic Sci 2012; 7:258-270 10.4056/sigs.3316719 [DOI] [PMC free article] [PubMed] [Google Scholar]
- 18.Lagier JC, El Karkouri K, Rivet R, Couderc C, Raoult D, Fournier PE. Non-contiguous finished genome sequence and description of Senegalemassilia anaerobia sp. nov. Stand Genomic Sci 2013; 7:343-356 10.4056/sigs.3246665 [DOI] [PMC free article] [PubMed] [Google Scholar]
- 19.Mishra AK, Hugon P, Lagier JC, Nguyen TT, Robert C, Couderc C, Raoult D, Fournier PE. Non-contiguous finished genome sequence and description of Peptoniphilus obesi sp. nov. Stand Genomic Sci 2013; 7:357-369 10.4056/sigs.32766871 [DOI] [PMC free article] [PubMed] [Google Scholar]
- 20.Mishra AK, Lagier JC, Nguyen TT, Raoult D, Fournier PE. Non-contiguous finished genome sequence and description of Peptoniphilus senegalensis sp. nov. Stand Genomic Sci 2013; 7:370-381 10.4056/sigs.3366764 [DOI] [PMC free article] [PubMed] [Google Scholar]
- 21.Lagier JC, El Karkouri K, Mishra AK, Robert C, Raoult D, Fournier PE. Non-contiguous finished genome sequence and description of Enterobacter massiliensis sp. nov. Stand Genomic Sci 2013; 7:399-412 10.4056/sigs.3396830 [DOI] [PMC free article] [PubMed] [Google Scholar]
- 22.Hugon P, Ramasamy D, Lagier JC, Rivet R, Couderc C, Raoult D, Fournier PE. Non-contiguous finished genome sequence and description of Alistipes obesi sp. nov. Stand Genomic Sci 2013; 7:427-439 10.4056/sigs.3336746 [DOI] [PMC free article] [PubMed] [Google Scholar]
- 23.Mishra AK, Hugon P, Robert C, Couderc C, Raoult D, Fournier PE. Non-contiguous finished genome sequence and description of Peptoniphilus grossensis sp. nov. Stand Genomic Sci 2012; 7:320-330; . 10.4056/sigs.3076460 [DOI] [PMC free article] [PubMed] [Google Scholar]
- 24.Mishra AK, Hugon P, Lagier JC, Nguyen TT, Couderc C, Raoult D, Fournier PE. Non contiguous-finished genome sequence and description of Enorma massiliensis gen. nov., sp. nov., a new member of the Family Coriobacteriaceae. Stand Genomic Sci 2013; 8:290-305 10.4056/sigs.3426906 [DOI] [PMC free article] [PubMed] [Google Scholar]
- 25.Ramasamy D, Lagier JC, Gorlas A, Raoult D, Fournier PE. Non contiguous-finished genome sequence and description of Bacillus massiliosenegalensis sp. nov. Stand Genomic Sci 2013; 8:264-278 10.4056/sigs.3496989 [DOI] [PMC free article] [PubMed] [Google Scholar]
- 26.Ramasamy D, Lagier JC, Nguyen TT, Raoult D, Fournier PE. Non contiguous-finished genome sequence and description of of Dielma fastidiosa gen. nov., sp. nov., a new member of the Family Erysipelotrichaceae. Stand Genomic Sci 2013; 8:336-351 10.4056/sigs.3567059 [DOI] [PMC free article] [PubMed] [Google Scholar]
- 27.Mishra AK, Lagier JC, Robert C, Raoult D, Fournier PE. Genome sequence and description of Timonella senegalensis gen. nov., sp. nov., a new member of the suborder Micrococcinae. Stand Genomic Sci 2013; 8:318-335 10.4056/sigs.3476977 [DOI] [PMC free article] [PubMed] [Google Scholar]
- 28.Willems A, Moore WE, Weiss N, Collins MD. Phenotypic and phylogenetic characterization of some Eubacterium-like isolates containing a novel type B wall murein from human feces: description of Holdemania filiformis gen. nov., sp. nov. Int J Syst Bacteriol 1997; 47:1201-1204 10.1099/00207713-47-4-1201 [DOI] [PubMed] [Google Scholar]
- 29.Rosenbach FJ. Experimentalle morphologische und klinische Studie uber die krankheitserregenden Mikroorganismen des Schweinerotlaufs, des Erysipeloids und der Mausesepsis. Z Hyg Infektionskr 1909; 63:343-371 10.1007/BF02227897 [DOI] [Google Scholar]
- 30.Field D, Garrity G, Gray T, Morrison N, Selengut J, Sterk P, Tatusova T, Thomson N, Allen MJ, Angiuoli SV, et al. The minimum information about a genome sequence (MIGS) specification. Nat Biotechnol 2008; 26:541-547 10.1038/nbt1360 [DOI] [PMC free article] [PubMed] [Google Scholar]
- 31.Woese CR, Kandler O, Wheelis ML. Towards a natural system of organisms: proposal for the domains Archae, Bacteria, and Eukarya. Proc Natl Acad Sci USA 1990; 87:4576-4579 10.1073/pnas.87.12.4576 [DOI] [PMC free article] [PubMed] [Google Scholar]
- 32.Gibbons NE, Murray RGE. Proposals Concerning the Higher Taxa of Bacteria. Int J Syst Bacteriol 1978; 28:1-6 10.1099/00207713-28-1-1 [DOI] [Google Scholar]
- 33.Garrity GM, Holt JG. The Road Map to the Manual. In: Garrity GM, Boone DR, Castenholz RW (eds), Bergey's Manual of Systematic Bacteriology, Second Edition, Volume 1, Springer, New York, 2001, p. 119-169. [Google Scholar]
- 34.Murray RGE. The Higher Taxa, or, a Place for Everything...? In: Holt JG (ed), Bergey's Manual of Systematic Bacteriology, First Edition, Volume 1, The Williams and Wilkins Co., Baltimore, 1984, p. 31-34. [Google Scholar]
- 35.Ludwig W, Schleifer K-H, Whitman W B. Class III. Erysipelotrichia class nov. In: De Vos P, Garrity G, Jones D, Krieg NR, Ludwig W, Rainey FA, Schleifer KH, Whitman WB (eds), Bergey's Manual of Systematic Bacteriology, Second Edition, Volume 3, Springer-Verlag, New York, 2009, p. 1298.. [Google Scholar]
- 36.List Editor List of new names and new combinations previously effectively, but not validly, published. List no. 132. Int J Syst Evol Microbiol 2010; 60:469-472 10.1099/ijs.0.022855-0 [DOI] [PubMed] [Google Scholar]
- 37.Ludwig W, Schleifer KH, Whitman WB. Order I. Erysipelotrichales ord. nov. In: De Vos P, Garrity G, Jones D, Krieg NR, Ludwig W, Rainey FA, Schleifer KH, Whitman WB (eds), Bergey's Manual of Systematic Bacteriology, Second Edition, Volume 3, Springer-Verlag, New York, 2009, p. 1298. [Google Scholar]
- 38.Verbarg S, Rheims H, Emus S, Frühling A, Kroppenstedt RM, Stackebrandt E, Schumann P. Erysipelothrix inopinata sp. nov., isolated in the course of sterile filtration of vegetable peptone broth, and description of Erysipelotrichaceae fam. nov. Int J Syst Evol Microbiol 2004; 54:221-225; . 10.1099/ijs.0.02898-0 [DOI] [PubMed] [Google Scholar]
- 39.Ashburner M, Ball CA, Blake JA, Botstein D, Butler H, Cherry JM, Davis AP, Dolinski K, Dwight SS, Eppig JT, et al. Gene ontology: tool for the unification of biology. The Gene Ontology Consortium. Nat Genet 2000; 25:25-29 10.1038/75556 [DOI] [PMC free article] [PubMed] [Google Scholar]
- 40.Stackebrandt E, Ebers J. Taxonomic parameters revisited: tarnished gold standards. Microbiol Today 2006; 33:152-155 [Google Scholar]
- 41.Seng P, Drancourt M, Gouriet F, La Scola B, Fournier PE, Rolain JM, Raoult D. Ongoing revolution in bacteriology: routine identification of bacteria by matrix-assisted laser desorption ionization time-of-flight mass spectrometry. Clin Infect Dis 2009; 49:543-551 10.1086/600885 [DOI] [PubMed] [Google Scholar]
- 42.Prodigal. http://prodigal.ornl.gov
- 43.GenBank database. http://www.ncbi.nlm.nih.gov/genbank
- 44.Lowe TM, Eddy SR. tRNAscan-SE: a program for improved detection of transfer RNA genes in genomic sequence. Nucleic Acids Res 1997; 25:955-964 [DOI] [PMC free article] [PubMed] [Google Scholar]
- 45.Lagesen K, Hallin P, Rodland EA, Staerfeldt HH, Rognes T, Ussery DW. RNAmmer: consistent and rapid annotation of ribosomal RNA genes. Nucleic Acids Res 2007; 35:3100-3108 10.1093/nar/gkm160 [DOI] [PMC free article] [PubMed] [Google Scholar]
- 46.Bendtsen JD, Nielsen H, von Heijne G, Brunak S. Improved prediction of signal peptides: SignalP 3.0. J Mol Biol 2004; 340:783-795 10.1016/j.jmb.2004.05.028 [DOI] [PubMed] [Google Scholar]
- 47.Krogh A, Larsson B, von Heijne G, Sonnhammer EL. Predicting transmembrane protein topology with a hidden Markov model: application to complete genomes. J Mol Biol 2001; 305:567-580 10.1006/jmbi.2000.4315 [DOI] [PubMed] [Google Scholar]
- 48.Lechner M, Findeib S, Steiner L, Marz M, Stadler PF, Prohaska SJ. Proteinortho: Detection of (Co-)orthologs in large-scale analysis. BMC Bioinformatics 2011; 12:124 10.1186/1471-2105-12-124 [DOI] [PMC free article] [PubMed] [Google Scholar]
- 49.Rutherford K, Parkhill J, Crook J, Horsnell T, Rice P, Rajandream MA, Barrell B. Artemis: sequence visualization and annotation. Bioinformatics 2000; 16:944-945 10.1093/bioinformatics/16.10.944 [DOI] [PubMed] [Google Scholar]
- 50.Carver T, Thomson N, Bleasby A, Berriman M, Parkhill J. DNAPlotter: circular and linear interactive genome visualization. Bioinformatics 2009; 25:119-120 10.1093/bioinformatics/btn578 [DOI] [PMC free article] [PubMed] [Google Scholar]
- 51.Darling AC, Mau B, Blattner FR, Perna NT. Mauve: multiple alignment of conserved genomic sequence with rearrangements. Genome Res 2004; 14:1394-1403 10.1101/gr.2289704 [DOI] [PMC free article] [PubMed] [Google Scholar]