

Abstract
Purpose
Residual disease (RD) following primary cytoreduction is associated with adverse overall survival in patients with epithelial ovarian cancer. Accurate identification of patients at high risk of RD has been elusive, lacking external validity and prompting many to undergo unnecessary surgical exploration. Our goal was to identify and validate molecular markers associated with high rates of residual disease.
Methods
We interrogated two publicly available datasets from chemonaïve primary high-grade serous ovarian tumors for genes overexpressed in patients with RD and significant at a 10% false discovery rate (FDR) in both datasets. We selected genes with wide dynamic range for validation in an independent cohort using qRT-PCR to assay gene expression, followed by blinded prediction of a patient subset at high risk for RD. Predictive success was evaluated using a one-sided Fisher’s exact test.
Results
Forty-seven probesets met the 10% FDR criterion in both datasets. These included FABP4 and ADH1B, which tracked tightly, showed dynamic ranges >16-fold, and had high expression levels associated with increased incidence of RD. In the validation cohort (n=189), FABP4 and ADH1B were again highly correlated. Using the top quartile of FABP4 PCR values as a pre-specified threshold, we found 30/35 cases of RD in the predicted high-risk group (positive predictive value 86%), and 54/104 among the remaining patients (P=0.0002; odds ratio 5.5).
Conclusion
High FABP4 and ADH1B expression are associated with significantly higher risk of residual disease in high-grade serous ovarian cancer. Patients with high tumoral levels of these genes may be candidates for neoadjuvant chemotherapy.
Keywords: Ovarian cancer, residual disease, neoadjuvant chemotherapy, biomarker, FABP4
INTRODUCTION
Surgery is widely accepted as a critical component of treatment for high-grade serous ovarian cancer (HGSOC), although the optimal timing of surgery has been debated. Residual disease (RD) following a primary cytoreductive effort is negatively associated with clinical metrics including response to adjuvant chemotherapy, progression-free survival and overall survival. Initial reports found improved survival among women left with <1.5 cm residual disease compared to larger-volume disease (1–3). Since then, the yardstick for defining “optimal” debulking has varied between <2 cm and 0 cm (complete resection or R0). Recent reports suggest that the best metric is the distinction between R0 and any residual disease (3, 4), which is also more reliably assessed and reproducible (external validity).
Accurate predictors of surgical outcome could substantially impact management of ovarian cancer by guiding patients with highest likelihood of having RD to neoadjuvant chemotherapy with the potential for interval cytoreductive surgery later. While baseline rates of leaving some extent of RD at upfront surgery are high (65 – 75%), identifiable factors are needed to indicate whether a specific patient is at significantly higher risk. Some studies have attempted to define predictors of optimal cytoreduction, most often defined as <1 cm residual disease (5). However, given the considerable variability in definition and assessment of debulked disease, such predictors have not been particularly reliable. Other efforts to spare unnecessary primary debulking surgery by pre- or intra-operative assessment have abounded (6–8). Unfortunately, none have reached the level of external validity necessary for incorporation into general practice.
A predictor of RD with high sensitivity is unlikely to exist since incomplete resection sometimes occurs owing to tumor location near critical organ structures. In many cases, though, RD is a consequence of biological tumor characteristics, with wide dissemination of disease throughout the pelvis. We hypothesized that, in the latter case, a high likelihood of RD might be predictable based on biomarkers assessed from tumor tissue. The goal of the present study, therefore, was to identify molecular markers associated with a high likelihood of RD. We used two publicly available microarray datasets that included residual disease information to discover candidate gene markers, and subsequently validated our biomarkers in an independent clinical cohort. In the validation cohort, blinded predictions of RD risk based on candidate biomarker gene expression assayed using qRT-PCR were compared to actual surgical outcomes.
MATERIALS AND METHODS
Here, we briefly outline our materials, experimental procedures, and methods of analysis. Full details (including computer code) are given in the Supplementary Appendix and at http://bioinformatics.mdanderson.org/Supplements/ResidualDisease.
Data for exploratory studies
For biomarker discovery, we used two large publicly available Affymetrix microarray datasets involving patients with HGSOC and providing associated clinical information, including residual disease status. The first of these was the ovarian cancer cohort from The Cancer Genome Atlas (TCGA) (9). We downloaded CEL files (Level 1 data) for the ovarian samples (Affymetrix HT HG-U133A arrays, N=598) on Sep. 2, 2012; these represent the TCGA update that was current as of June 24, 2011 (revision 1007). We downloaded the associated clinical data (N=576) on Sep. 14, 2012. We omitted 4 samples marked for exclusion by TCGA and performed additional sample filtration based on clinical annotation. We excluded samples if they were from recurrent tumor, omental tumor, or normal tissue. When there were multiple primary tumor samples per patient, we retained data from just one sample. We also excluded cases if there was no information about RD status, if the tumor was not high grade, or if the patient received neoadjuvant chemotherapy. The second dataset was from the study of Tothill et al. (10). We downloaded CEL files (Affymetrix U133+2 arrays, N=285) and clinical data from the Gene Expression Omnibus (GSE9891) on Sep. 13, 2012. We excluded cases from this dataset if tumor samples were low grade, of low malignant potential, non-serous histology, or non-ovarian or peritoneal origin. Cases were also excluded if the patient received neoadjuvant chemotherapy or if RD status was not provided. Accordingly, biomarker discovery was performed using only data from primary tumors of chemonaïve patients with HGSOC.
Following initial biomarker discovery, we considered two further datasets for qualitative checks on patterns of expression for genes of interest (Bonome et al. and The Cancer Cell Line Encyclopedia; see Supplementary Appendix for details) (11, 12). We note that although the study of Bonome et al. includes clinical data, we could not use it for validation because in that dataset RD is scored as optimal versus suboptimal, whereas our method was developed to predict risk of any RD versus R0.
For each of the 4 datasets described above, we quantified expression at the probeset level with R statistical software (version 2.15.1) using the robust multi-array average procedure (13) as implemented in the subroutine justRMA in the R “affy” package (version 1.34.0). We only considered probesets common to the array platforms used in the first two datasets. Except for the 4 samples marked for exclusion by TCGA, our sample filtrations described above were performed subsequent to the quantification step.
Validation studies
Following identification of candidate genes having a wide dynamic range and with high expression levels associated with high risk of RD in exploratory analyses (see below), we performed validation studies in an independent cohort. Following Institutional Review Board approval, we obtained primary ovarian tumor samples from archived surgical material at The University of Texas MD Anderson Cancer Center (n=84) and the Pacific Ovarian Cancer Research Consortium at the Fred Hutchinson Cancer Research Center (n=55). We also included 41 samples of omental tumor tissue from MD Anderson for comparison. All samples were selected from chemonaïve tumors. Information about residual disease status in the validation cohort was extracted from patient medical records by clinical members of the team (AS, AN) and was scored as R0 versus any RD. This information was kept blinded from all other team members until after predictions were made concerning identification of a subset of patients at high risk for RD. These predictions were made based on expression levels of a candidate gene of interest relative to 18S, assayed using qRT-PCR (14) (see Supplementary Appendix for additional details).
Statistical methods
Exploratory data analyses
We used two-sample t-tests to compare expression levels by residual disease status (R0 versus any RD) in the TCGA and Tothill datasets separately. We analyzed the resulting collections of nominal P-values using the method of Benjamini and Hochberg (15) to identify probesets significant at a 10% or 5% false discovery rate (FDR) in each data set separately. We selected probesets meeting the specified criterion in both subsets. We produced density plots for these probesets, as well as heatmaps using hierarchical clustering, to illustrate patterns of expression. We examined the resulting plots to identify probesets with (a) wide dynamic range and (b) high levels of expression associated with particularly high incidence of RD. We examined similar plots for the selected probesets in the Bonome and CCLE datasets to see if the qualitative expression patterns were also observed there.
Selecting a sample size and prediction threshold for the validation study
Following identification of genes for which high expression levels were associated with high risk of RD, we wished to select an a priori decision threshold for “calling” a patient in the validation cohort to be at high risk of RD based on elevated biomarker expression measured by qRT-PCR. Patients with expression of a candidate biomarker gene above the selected threshold would be in the predicted high-risk group for RD. To select a decision threshold, we first computed the positive predictive values (PPVs) in the TCGA and Tothill datasets at thresholds defined by varying quantiles of biomarker expression. We assumed that similar PPVs would apply to the validation cohort and performed numerical simulations to determine a decision threshold at which we would be maximally powered to detect a difference in incidence of RD in the validation set. We chose a threshold with an estimated power of at least 80% to detect a difference in incidence of RD significant at P<0.05 using a one-sided Fisher exact test. We used similar simulations for our initial sample size computations before collecting the validation set.
Statistical assessment of success
We constructed a 2×2 table showing our calls (high risk of RD versus lower risk of RD) compared to actual surgical outcomes (RD versus R0) in the validation cohort. We used a one-sided Fisher’s exact test to test the null hypothesis of equivalent rates of residual disease in the two groups against the alternative of increased incidence of RD in the predicted high-risk group.
RESULTS
Clinical outcomes in the exploratory cohorts
In the TCGA and Tothill datasets, 491 and 189 patients, respectively, met the criteria for inclusion in our analysis. Figure 1 shows overall survival in these cohorts by extent of residual disease after debulking surgery. Survival is significantly better for patients with complete resection (R0) compared to those with any RD, including those traditionally considered to be optimally debulked (1–10mm residual disease). This result, reported previously for the TCGA data(9), is consistent with the findings from other studies as well(3,4). The percentages of patients with any RD are 77% (n=378) and 74% (n=139) in the TCGA and Tothill cohorts, respectively.
Figure 1.
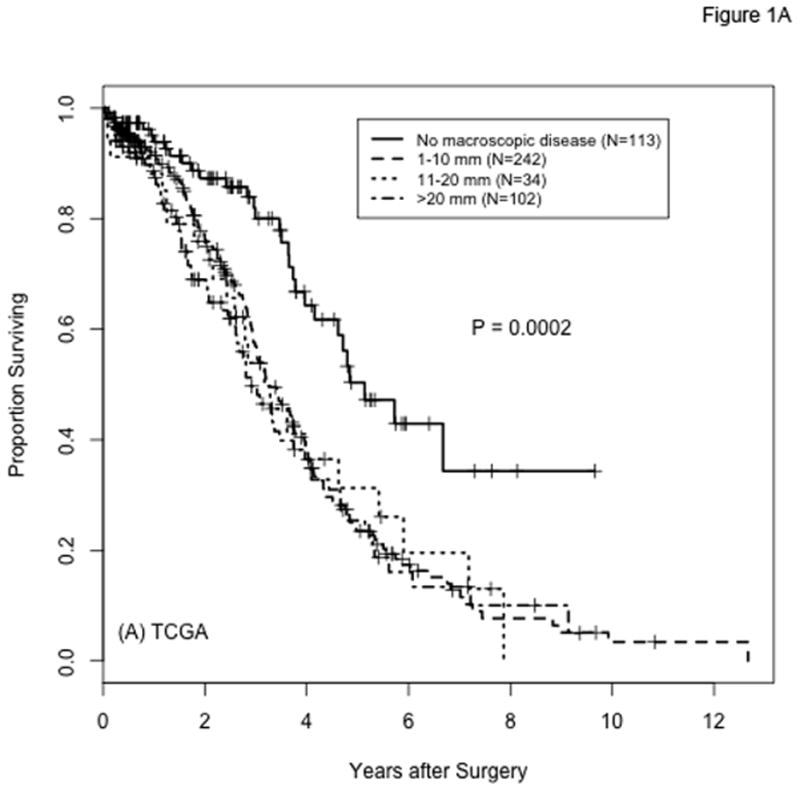
Overall survival by extent of residual disease after cytoreductive surgery for patients with high-grade serous ovarian cancer in the TCGA (panel A) and Tothill (panel B) cohorts. Categories for amount of residual disease are labeled as in the original datasets: “No macroscopic disease” in panel A and “nil” in panel B correspond to no residual disease (R0); “1–10 mm” in panel A corresponds to “<1” in panel B; “11–20 mm” and “>20 mm” in panel A correspond to “>1” in panel B; the size of the macroscopic tumor remaining is not known for 13 of the samples from Tothill et al. (”macro size NK”). P-values are from log-rank comparisons of all groups per panel; P-values from the comparison of R0 versus any residual disease (3 lower groups combined) are P <0.0001 and P=0.0022 for panels A and B, respectively.
Identification of genes associated with increased incidence of residual disease
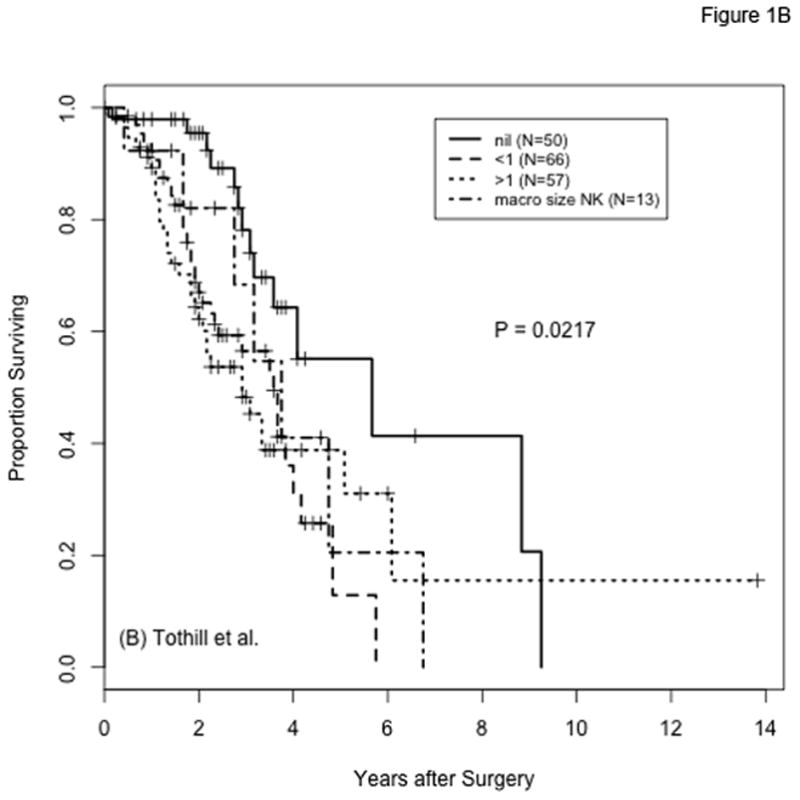
There are 47 probesets, representing 38 different genes (Supplementary Table 1), with P-values meeting a 10% FDR criterion in both datasets. Lowering the FDR to 5% results in 8 probesets common to both datasets. Of note, the additional filtration imposed by requiring success in both datasets is severe; the 8 common probesets represent the intersection of 149 probesets meeting the 5% FDR threshold for TCGA and 81 meeting the same criterion for the Tothill cohort. Heatmaps of standardized expression of the 8 probesets meeting the 5% FDR criterion in the TCGA and Tothill cohorts are shown in Figure 2; heatmaps for the 47 probesets meeting the 10% FDR criterion in both data sets are included in the Supplementary Appendix.
Figure 2.
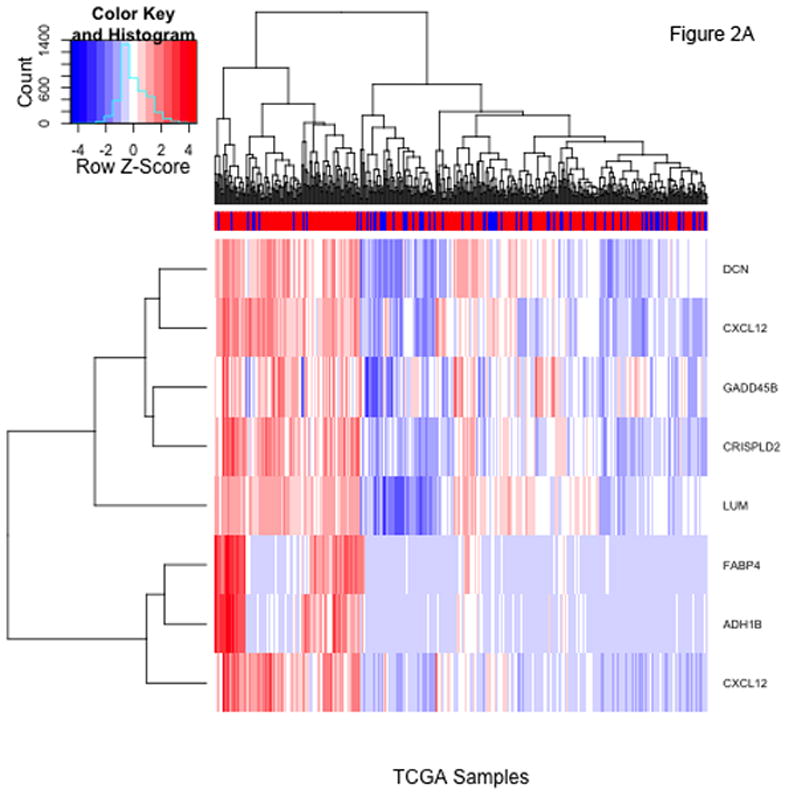
Heatmaps showing standardized expression of the 8 probesets with false discovery rates <5% identified using t-tests comparing patients with and without residual disease in the TCGA (panel A) and Tothill (panel B) cohorts. The colorbars at top indicate presence (red) or absence (blue) of residual disease for each patient.
Figure 3 shows density plots of expression levels for 2 of the top 8 candidate probesets of interest, LUM and FABP4 (plots for all 47 probesets identified at the 10% FDR level are included in the Supplementary Appendix). While both LUM and FABP4 show increased rates of RD at higher expression levels, the distributions of the two genes are qualitatively different. For FABP4, there is a level of expression above which nearly all patients have RD. For LUM, by contrast, there is no clearly defined cut-point above which the majority of patients have residual disease.
Figure 3.
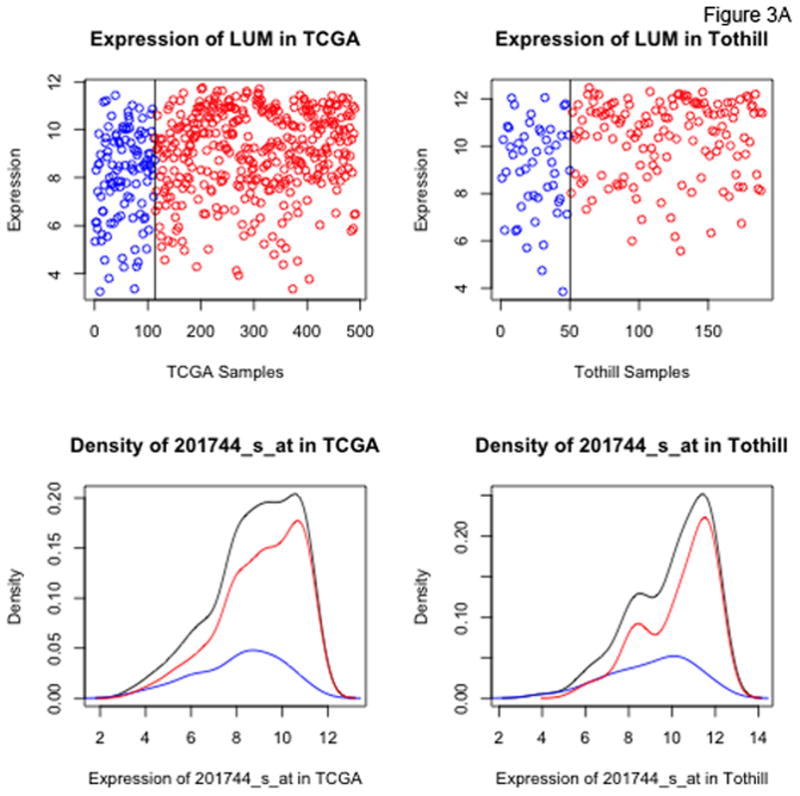
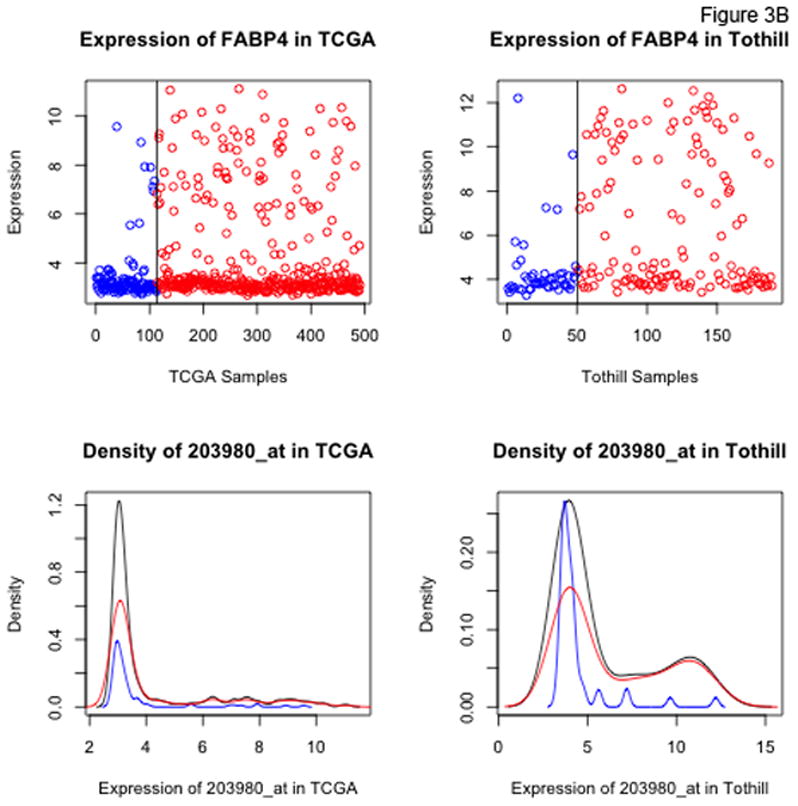
Dot and density plots for LUM, lumican (Panel A) and FABP4 (Panel B) in the TCGA and Tothill datasets. Cases with no residual disease (R0) are in blue, cases with residual disease in red. Black density curves represent the entire cohort.
An additional probeset exhibiting the same type of qualitative behavior as for FABP4 corresponds to ADH1B. For the FABP4 and ADH1B probesets, the distribution of expression values is bimodal, with a large cohort having low expression levels falling within a relatively narrow range (the lower limit of detection for the assay), and a smaller cohort with substantially (up to orders of magnitude) higher expression levels. Moreover, the heatmaps in Figure 2 show that the highest expression levels of FABP4 and ADH1B occur in a subset of patients with a very high incidence of RD. Figures 4A and 4B show the highly correlated levels of FABP4 and ADH1B in the TCGA and Tothill datasets, respectively. Using cutoffs of 3.5 on both TCGA axes, 97/107 (90.6%) of the patients with high expression of both genes have RD, versus 281/384 (73.2%) of the remaining patients. Using cutoffs of 5.25 and 4.5 for FABP4 and ADH1B, respectively, in the Tothill data, 59/63 (93.7%) of patients with high expression of both genes have RD, versus 80/126 (63.5%) of the others.
Figure 4.
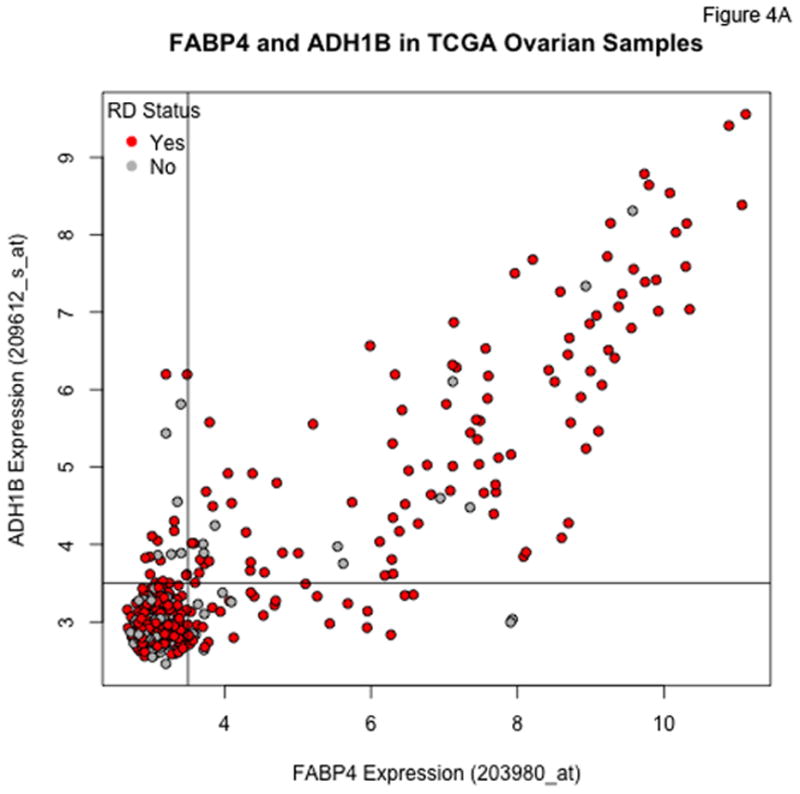
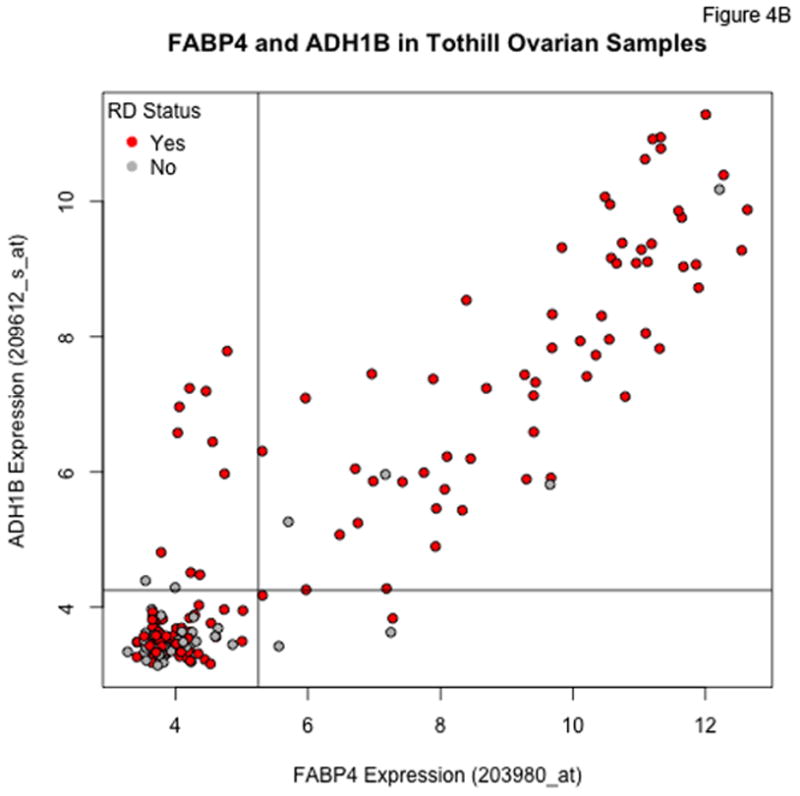
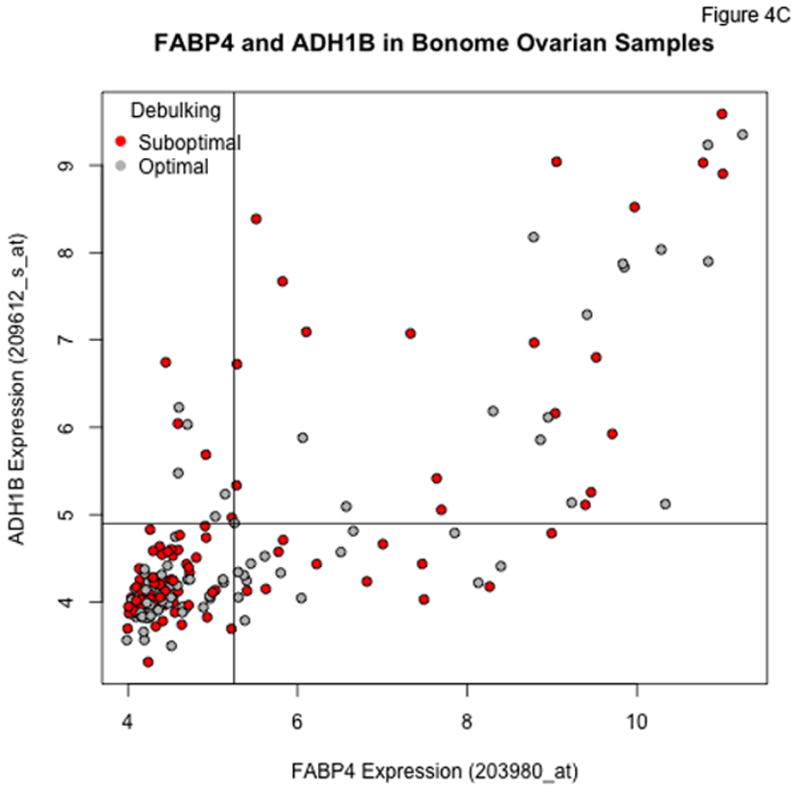
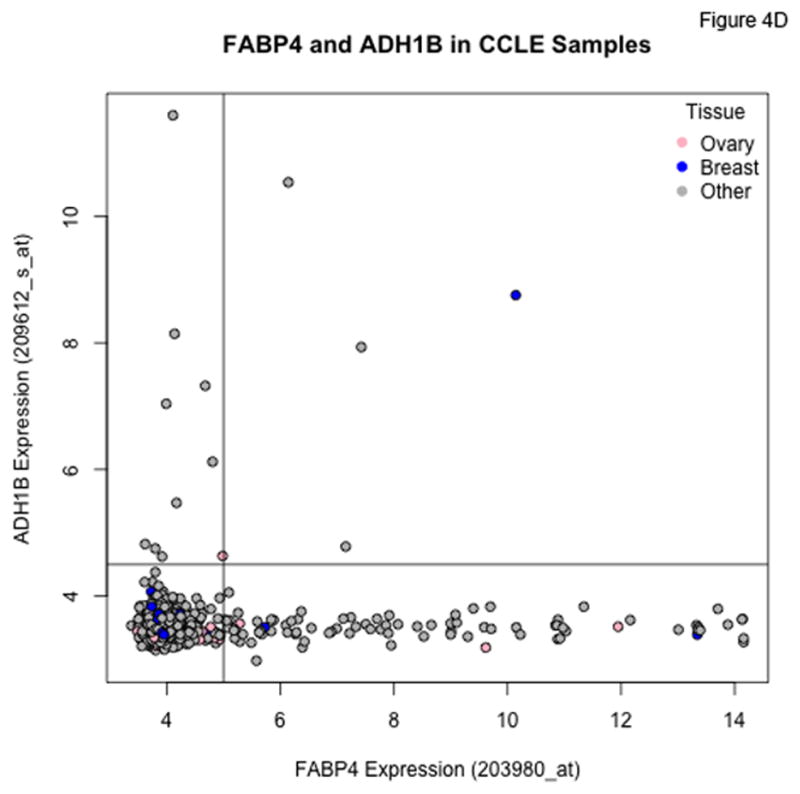
Plots of FABP4 against ADH1B for the TCGA (Panel A), Tothill (Panel B), Bonome (Panel C), and CCLE (Panel D) datasets. Cutoffs separating “low” and “high” expression were chosen by eye, and loosely correspond to dips in density estimates of the corresponding distributions. The genes track together in the TCGA and Tothill cohorts, and rates of residual disease are higher when both genes are elevated. Tracking is more diffuse in the (microdissected) Bonome samples, and essentially absent in the CCLE samples, suggesting the linkage may be driven by the microenvironment.
In the Bonome et al. cohort, we again see a subset of patients with very high levels of both FABP4 and ADH1B (Figure 4C), but the correlation between the two is not as tight as for the TCGA and Tothill datasets, possibly as a result of the microdissection used in the study of Bonome et al. In the cell line data from CCLE (Figure 4D), joint overexpression of FABP4 and ADH1B does not occur among the ovarian cancer lines, although there is clear overexpression of each gene in some cell lines. This suggests the linkage we see in clinical samples may be due to some type of stromal interaction.
Validation studies
In general, levels of FABP4 in the validation studies were markedly higher in tumor samples from omentum than from primary tumor (Supplementary Appendix). Therefore, we restricted our attention to the samples from primary tumor for consistency with the datasets of TCGA and Tothill et al. The paired FABP4 and ADH1B qRT-PCR values for the primary ovarian cancer samples are shown in Figure 5. Expression levels of the 2 genes are highly correlated, and there is no difference in distribution between the values from samples contributed by the two institutions.
Figure 5.
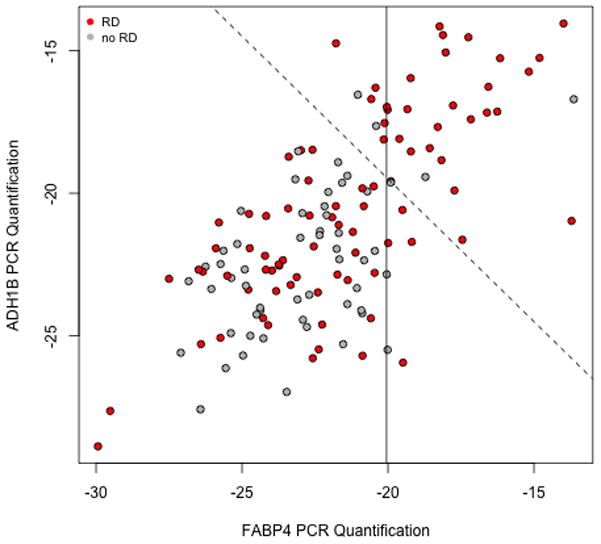
Plot of FABP4 vs ADH1B qRT-PCR values for the ovarian validation samples. Each unit change corresponds to a doubling of measured intensities. Cases with residual disease are in red. The solid line is the cutoff used in our blinded validation; the dashed line is the cutoff associated with weighting the two genes equally (with performance checked after unblinding).
Although the correlations between the microarray values for FABP4 and ADH1B in our discovery cohorts suggested that we would not need both for successful prediction of high RD risk, it was not certain, a priori, that either assay would work. In addition, we were interested in exploring the nature of the association between FABP4 and ADH1B further. Therefore, we assayed expression levels of both genes in our validation studies. However, after observing the results in Figure 5, and in view of the lack of elevation of ADH1B in the CCLE data, we proceeded to predict high risk of RD in our validation cohort based on FABP4 expression levels alone.
The bimodal distribution seen in the microarray values for FABP4 was not seen with the qRT-PCR values in the validation cohort, pointing to a dynamic range limitation for the former. Therefore, we chose to select a cutoff for predicting high risk of residual disease based on a specific quantile of FABP4 expression (Supplementary Appendix). Specifically, we selected a prediction threshold corresponding to the 25% of patients with the highest levels of FABP4 expression; we predicted that these patients had a significantly higher incidence of RD than the remaining patients.
After unblinding the clinical findings concerning RD in the validation cohort, we observed that among the 35 patients predicted to be at high risk for RD, 30 (PPV 86%) did have residual disease. In contrast, only 54 of the 104 patients with FABP4 values below the decision threshold (52%) had incomplete resections. This difference is highly significant using a 1-sided Fisher’s exact test (P=0.0002), and corresponds to an odds ratio of 5.5. Our predictive method based on FABP4, therefore, correctly identified a cohort of patients with significantly increased rates of RD in an independent test set. Further examination of the ADH1B results (performed after unblinding) showed that predictions using either ADH1B alone or in combination with FABP4 would have produced similar results (Figure 5 and Supplementary Appendix).
To obtain insight into the potential biological role of FABP4 and ADH1B, we utilized the reverse-phase protein array (RPPA) data available from TCGA to investigate which proteins, if any, had levels correlated with FABP4 and ADH1B expression in the TCGA samples. While all correlations were low, there were nonetheless more significant associations than could be explained by chance (Supplementary Appendix). Many of the positively associated proteins are related to metastasis or proliferation, and among the proteins negatively associated with both genes is E-cadherin, which might imply greater levels of epithelial-mesenchymal transition and would also be pro-metastatic.
DISCUSSION
We have shown that high expression levels of FABP4 and ADH1B in primary tumor specimens are associated with high incidence of residual disease after primary debulking surgery of high-grade serous ovarian cancer. If confirmed in the biopsy setting, this discovery lays the foundation for customized surgical treatment approaches based on unbiased and objective measures from the tumor itself. Triage to neoadjuvant chemotherapy vs. primary debulking could be prospectively assessed to provide an optimized treatment algorithm based on intrinsic tumor biology. For such use, biopsy from the primary vs. metastatic sites would also have to be carefully considered. Consistent with a report of Nieman et al. (16), we observed higher levels of FABP4 in samples from the omentum compared to primary tumor, and in 4 patients with samples available from both sites, FABP4 levels were higher in metastatic tissue (Supplementary Appendix). These results suggest that if omental levels of FABP4 expression are also associated with risk of RD, the FABP4 threshold for calling patients to be at high risk of RD might depend on whether primary or metastatic tissue is sampled.
Our identification of FABP4 and ADH1B, which encode for fatty acid binding protein 4 and alcohol dehydrogenase 1B, respectively, leveraged large, publicly available datasets, providing further evidence that such datasets (with clinical annotation) may be relevant for discovering approaches to tailor therapy. This assertion, however, comes with several caveats. First, results from almost all such studies can be tainted by batch effects (17). To minimize the potential for such effects, we sought associations occurring in two different datasets, and looked for confirmation of expression patterns in at least one additional publicly available dataset, before proceeding to validation. Second, by selecting genes whose expression levels exhibited a wide dynamic range, we focused on differences large enough to survive migration to a different assay. This is in keeping with the use of “bimodal” genes for classification (18, 19) and is similar in spirit to the “barcode” approach (20). Third, to keep the test practical, we restricted attention to a very small number of genes (here two). Fourth, we used a clinical endpoint that should be consistent across centers (i.e., R0 resection contrasted with any residual disease).
Although the extent of cytoreduction is still most commonly scored as optimal (<1 cm) versus suboptimal (≥1 cm) resection, we elected to seek biomarkers of any RD, instead of suboptimal debulking, for two reasons. First, there is growing evidence that there is a larger difference in overall survival between patients with R0 resection versus any RD than between optimal versus suboptimal resection, as shown in our Figure 1 and elsewhere (3,4,9). Second, the distinction between R0 resections and any RD is expected to be more reliably assessed and reproducible between institutions. Having elected to investigate the distinction between RD and no RD, we sought biomarkers associated with RD instead of R0 because there is a subset of patients in whom complete resection is not achievable because of widely disseminated disease. This suggests the existence of a subset of patients at high risk of RD because of biological tumor characteristics, while failure to achieve R0 may occur simply because of tumor location near critical organs, and other medical reasons unrelated to biological characteristics of the tumor. We, therefore, expect that a biological predictor for likelihood of R0 disease may not achieve high predictive accuracy. Consistent with this hypothesis, although we find a continuous trend in the risk of RD as a function of FABP4 expression levels (Supplementary Appendix), the incidence of R0 resection is not very high (<60%) among patients with the lowest levels of FABP4 in their primary tumors.
The present study did not address the biological mechanisms that might underlie the ability of FABP4 and/or ADH1B to serve as biomarkers for high risk of RD. The study of Nieman et al. suggested that FABP4 plays a role in widely metastatic disease (16), which could explain the associated high risk of RD, and several studies have reported a role of FABP4 in angiogenesis (21,22). We found that protein levels measured by RPPA in the TCGA data and correlated with high FABP4 or ADH1B expression also suggest increased metastasis and proliferation. We further note that several collagen genes are included among the 47 genes meeting the 10% FDR in our discovery analyses (Supplementary Appendix); this might indicate an ability of the tumor to remodel the local environment and promote metastases. Additional studies investigating both genes are currently underway in our laboratory.
While current front-line treatment for patients with HGSOC consists of tumor debulking surgery followed by platinum- and taxane-based chemotherapy (23), some studies point to comparable outcome with neoadjuvant chemotherapy followed by interval debulking surgery (24). An accurate predictor could allow “personalized” surgical therapy, whereby patients unlikely to have complete debulking would forego upfront surgery and would receive neoadjuvant chemotherapy instead. With such an approach, patients with a high likelihood of residual disease at the upfront surgery could be spared from the morbidity associated with such procedures. Previous attempts to predict resectability have included use of computerized tomography, which was not found to be highly predictive (25) and preoperative serum levels of CA-125, which was found to be a significant predictor of suboptimal disease but with an odds ratio lower than the value found here for prediction of RD using FABP4 (26). Consistent with our observation that low FABP4 expression does not accurately identify patients without RD, the latter study found that CA-125 lacks the ability to predict optimal cytoreduction. An ongoing study at our institution is investigating the utility of a laparoscopy-based assessment of the potential to achieve R0 resection, which could potentially complement the biomarkers proposed here for detecting high risk of RD. Development of a CLIA-compliant assay for FABP4 is currently underway to enable prospective validation of our proposed molecular biomarkers. In addition, ongoing biological studies of FABP4 and ADH1B may elucidate the mechanisms behind some of the most refractory cases of HGSOC and point to new avenues for therapeutic intervention.
Supplementary Material
TRANSLATIONAL RELEVANCE.
Primary debulking surgery followed by adjuvant chemotherapy has been the standard for treatment of women with high grade serous ovarian cancer. Residual disease (RD) following primary cytoreduction is known to be associated with poor overall and progression free survival, and patients at high risk of having RD may be candidates for neoadjuvant chemotherapy. Our study used publically available microarray data to identify two biomarkers, FABP4 and ADH1B, which were subsequently validated in an independent clinical cohort to identify patients at high risk of RD after primary surgery. Use of these biomarkers could help clinicians personalize treatment options for women suspected of having ovarian cancer. Our study has led to ongoing development of a CLIA based assay for use of these biomarkers in a prospective validation trial.
Acknowledgments
This work was supported in part by the National Cancer Institute at the National Institutes of Health (CA016672, CA101642, CA109298, CA128797, P50CA083639, P50CA098258, U54CA151668, U54CA96300, U54CA96297); the Cancer Prevention Research Institute of Texas (RP110595); the Department of Defense (BC085265, OC073399, W81XWH-10-1-0158); the Ovarian Cancer Research Fund (Program Project Development Grant); the Betty Ann Asche Murray Distinguished Professorship; the Meyer and Ida Gordon Foundation, the Judi A. Rees Ovarian Cancer Research Fund, the Marcus Foundation; the RGK Foundation; the Gilder Foundation; and the Blanton-Davis Ovarian Cancer Research Program.
The authors thank Drs. Charles Drescher and Muneesh Tewari at the Fred Hutchinson Cancer Research Center for helpful discussions and for providing tumor samples.
Footnotes
Conflicts of interest: None
References
- 1.Aletti GD, Dowdy SC, Gostout BS, Jones MB, Stanhope CR, Wilson TO, et al. Aggressive surgical effort and improved survival in advanced-stage ovarian cancer. Obstetrics and Gynecology. 2006;107:77–85. doi: 10.1097/01.AOG.0000192407.04428.bb. [DOI] [PubMed] [Google Scholar]
- 2.Bookman MA, Brady MF, McGuire WP, Harper PG, Alberts DS, Friedlander M, et al. Evaluation of new platinum-based treatment regimens in advanced-stage ovarian cancer: a Phase III Trial of the Gynecologic Cancer Intergroup. Journal of Clinical Oncology. 2009;27:1419–25. doi: 10.1200/JCO.2008.19.1684. [DOI] [PMC free article] [PubMed] [Google Scholar]
- 3.Chang SJ, Bristow RE, Ryu HS. Impact of complete cytoreduction leaving no gross residual disease associated with radical cytoreductive surgical procedures on survival in advanced ovarian cancer. Annals of Surgical Oncology. 2012;19:4059–67. doi: 10.1245/s10434-012-2446-8. [DOI] [PubMed] [Google Scholar]
- 4.du Bois A, Reuss A, Pujade-Lauraine E, Harter P, Ray-Coquard I, Pfisterer J. Role of surgical outcome as prognostic factor in advanced epithelial ovarian cancer: a combined exploratory analysis of 3 prospectively randomized phase 3 multicenter trials: by the Arbeitsgemeinschaft Gynaekologische Onkologie Studiengruppe Ovarialkarzinom (AGO-OVAR) and the Groupe d’Investigateurs Nationaux Pour les Etudes des Cancers de l’Ovaire (GINECO) Cancer. 2009;115:1234–44. doi: 10.1002/cncr.24149. [DOI] [PubMed] [Google Scholar]
- 5.Bristow RE, Tomacruz RS, Armstrong DK, Trimble EL, Montz FJ. Survival effect of maximal cytoreductive surgery for advanced ovarian carcinoma during the platinum era: a meta-analysis. Journal of Clinical Oncology. 2002;20:1248–59. doi: 10.1200/JCO.2002.20.5.1248. [DOI] [PubMed] [Google Scholar]
- 6.Ferrandina G, Sallustio G, Fagotti A, Vizzielli G, Paglia A, Cucci E, et al. Role of CT scan-based and clinical evaluation in the preoperative prediction of optimal cytoreduction in advanced ovarian cancer: a prospective trial. British Journal of Cancer. 2009;101:1066–73. doi: 10.1038/sj.bjc.6605292. [DOI] [PMC free article] [PubMed] [Google Scholar]
- 7.Rodriguez N, Rauh-Hain JA, Shoni M, Berkowitz RS, Muto MG, Feltmate C, et al. Changes in serum CA-125 can predict optimal cytoreduction to no gross residual disease in patients with advanced stage ovarian cancer treated with neoadjuvant chemotherapy. Gynecologic Oncology. 2012;125:362–6. doi: 10.1016/j.ygyno.2012.02.006. [DOI] [PubMed] [Google Scholar]
- 8.Angioli R, Plotti F, Capriglione S, Aloisi A, Montera R, Luvero D, et al. Can the preoperative HE4 level predict optimal cytoreduction in patients with advanced ovarian carcinoma? Gynecologic Oncology. 2013;128:579–83. doi: 10.1016/j.ygyno.2012.11.040. [DOI] [PubMed] [Google Scholar]
- 9.Integrated genomic analyses of ovarian carcinoma. Nature. 2011;474:609–15. doi: 10.1038/nature10166. [DOI] [PMC free article] [PubMed] [Google Scholar]
- 10.Tothill RW, Tinker AV, George J, Brown R, Fox SB, Lade S, et al. Novel molecular subtypes of serous and endometrioid ovarian cancer linked to clinical outcome. Clinical Cancer Research. 2008;14:5198–208. doi: 10.1158/1078-0432.CCR-08-0196. [DOI] [PubMed] [Google Scholar]
- 11.Barretina J, Caponigro G, Stransky N, Venkatesan K, Margolin AA, Kim S, et al. The Cancer Cell Line Encyclopedia enables predictive modelling of anticancer drug sensitivity. Nature. 2012;483:603–7. doi: 10.1038/nature11003. [DOI] [PMC free article] [PubMed] [Google Scholar]
- 12.Bonome T, Levine DA, Shih J, Randonovich M, Pise-Masison CA, Bogomolniy F, et al. A gene signature predicting for survival in suboptimally debulked patients with ovarian cancer. Cancer Research. 2008;68:5478–86. doi: 10.1158/0008-5472.CAN-07-6595. [DOI] [PMC free article] [PubMed] [Google Scholar]
- 13.Bolstad BM, Irizarry RA, Astrand M, Speed TP. A comparison of normalization methods for high density oligonucleotide array data based on variance and bias. Bioinformatics. 2003;19:185–93. doi: 10.1093/bioinformatics/19.2.185. [DOI] [PubMed] [Google Scholar]
- 14.Ruijter JM, Ramakers C, Hoogaars WMH, Karlen Y, Bakker O, van den Hoff MJB, et al. Amplification efficiency: linking baseline and bias in the analysis of quantitative PCR data. Nucleic Acids Research. 2009;37:e45. doi: 10.1093/nar/gkp045. [DOI] [PMC free article] [PubMed] [Google Scholar]
- 15.Benjamini Y, Hochberg Y. Controlling the false discovery rate: A practical and power-ful approach to multiple testing. Journal of the Royal Statistical Society: Series B. 1995;57:289–300. [Google Scholar]
- 16.Nieman KM, Kenny HA, Penicka CV, Ladanyi A, Buell-Gutbrod R, Zillhardt MR, et al. Adipocytes promote ovarian cancer metastasis and provide energy for rapid tumor growth. Nature Medicine. 2011;17:1498–503. doi: 10.1038/nm.2492. [DOI] [PMC free article] [PubMed] [Google Scholar]
- 17.Leek JT, Scharpf RB, Bravo HC, Simcha D, Langmead B, Johnson WE, et al. Tackling the widespread and critical impact of batch effects in high-throughput data. Nature Reviews Genetics. 2010;11:733–9. doi: 10.1038/nrg2825. [DOI] [PMC free article] [PubMed] [Google Scholar]
- 18.Kernagis DN, Hall AH, Datto MB. Genes with bimodal expression are robust diagnostic targets that define distinct subtypes of epithelial ovarian cancer with different overall survival. The Journal of Molecular Diagnostics. 2012;14:214–22. doi: 10.1016/j.jmoldx.2012.01.007. [DOI] [PubMed] [Google Scholar]
- 19.Wang J, Wen S, Symmans WF, Pusztai L, Coombes KR. The bimodality index: a criterion for discovering and ranking bimodal signatures from cancer gene expression profiling data. Cancer Informatics. 2009;7:199–216. doi: 10.4137/cin.s2846. [DOI] [PMC free article] [PubMed] [Google Scholar]
- 20.Zilliox MJ, Irizarry RA. A gene expression bar code for microarray data. Nature Methods. 2007;4:911–3. doi: 10.1038/nmeth1102. [DOI] [PMC free article] [PubMed] [Google Scholar]
- 21.Elmasri H, Karaaslan C, Teper Y, Ghelfi E, Weng M, Ince TA, et al. Fatty acid binding protein 4 is a target of VEGF and a regulator of cell proliferation in endothelial cells. The FASEB Journal. 2009;23:3865–73. doi: 10.1096/fj.09-134882. [DOI] [PMC free article] [PubMed] [Google Scholar]
- 22.Kajimoto K, Takayanagi S, Sasaki S, Akita H, Harashima H. RNA Interference-Based Silencing Reveals the Regulatory Role of Fatty Acid-Binding Protein 4 in the Production of IL-6 and Vascular Endothelial Growth Factor in 3T3-L1 Adipocytes. Endocrinology. 2012;153:5629–36. doi: 10.1210/en.2012-1456. [DOI] [PubMed] [Google Scholar]
- 23.Vaughan S, Coward JI, Bast RC, Jr, Berchuck A, Berek JS, Brenton JD, et al. Rethinking ovarian cancer: recommendations for improving outcomes. Nature Reviews Cancer. 2011;11:719–25. doi: 10.1038/nrc3144. [DOI] [PMC free article] [PubMed] [Google Scholar]
- 24.Vergote I, Trope CG, Amant F, Kristensen GB, Ehlen T, Johnson N, et al. Neoadjuvant chemotherapy or primary surgery in stage IIIC or IV ovarian cancer. The New England Journal of Medicine. 2010;363:943–53. doi: 10.1056/NEJMoa0908806. [DOI] [PubMed] [Google Scholar]
- 25.Axtell AE, Lee MH, Bristow RE, Dowdy SC, Cliby WA, Raman S, et al. Multi-Institutional Reciprocal Validation Study of Computed Tomography Predictors of Suboptimal Primary Cytoreduction in Patients With Advanced Ovarian Cancer. Journal of Clinical Oncology. 2007;25:384–9. doi: 10.1200/JCO.2006.07.7800. [DOI] [PubMed] [Google Scholar]
- 26.Kang S, Kim TJ, Nam BH, Seo SS, Kim BG, Bae DS, et al. Preoperative Serum CA-125 Levels and Risk of Suboptimal Cytoreduction in Ovarian Cancer: A Meta-Analysis. Journal of Surgical Oncology. 2010;101:13–7. doi: 10.1002/jso.21398. [DOI] [PubMed] [Google Scholar]
Associated Data
This section collects any data citations, data availability statements, or supplementary materials included in this article.