

Abstract
To support the development of a fixed-dose combination (FDC) of ezetimibe and atorvastatin for the treatment of dyslipidemia, bioequivalence (BE) studies were conducted across a combined dose range (10/10, 10/20, 10/40, and 10/80 mg of ezetimibe/atorvastatin). In the BE trials, all parameters met traditional BE bounds except for atorvastatin peak plasma concentration (Cmax) at two intermediate doses. Literature-based metadata analysis predicted that the observed difference in Cmax between an ezetimibe+atorvastatin FDC and coadministration of these agents translates directly into a non–clinically significant change of <1.2% absolute difference in the percentage lowering of low-density-lipoprotein cholesterol . Both FDC doses were confirmed to be clinically equivalent to coadministration in the subsequent clinical equivalence trials. These data suggest that modeling of dose–response relationships may be useful in predicting clinical equivalence, lowering cost/timelines through effective powering of studies, and predicting the effectiveness of new dosage formulations without the need for additional clinical efficacy trials in regulatory settings.
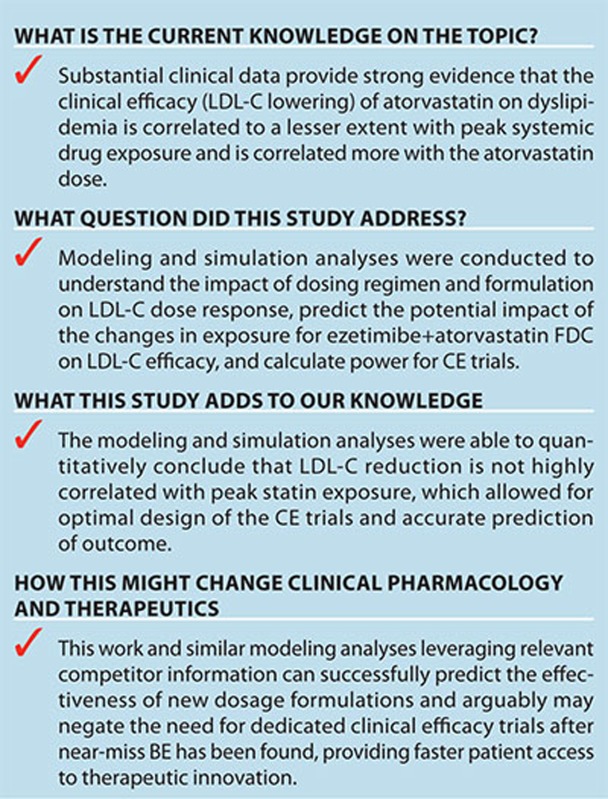
To support the development of a fixed-dose combination (FDC) of ezetimibe and atorvastatin, bioequivalence (BE) studies were conducted for all combinations of the marketed doses: 10 mg of ezetimibe in combination with 10, 20, 40, and 80 mg of atorvastatin. The results of these studies demonstrated BE for all key parameters, except for atorvastatin peak plasma concentration (Cmax), at the intermediate doses (Table 1). Modeling and simulation analyses were conducted to understand the impact of statin-dosing regimen and formulation on low-density-lipoprotein (LDL) cholesterol (LDL-C) dose response and to predict the impact of the changes in exposure for ezetimibe+atorvastatin FDC on LDL-C lowering efficacy.
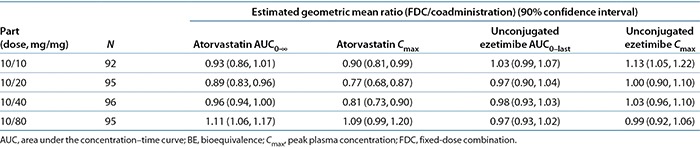
Table 1. BE results for atorvastatin and ezetimibe in healthy volunteers across the dose range for the fixed-dose combination as compared with coadministration of individual components.
Clinical data provide strong evidence that the clinical efficacy (LDL-C lowering) of atorvastatin on dyslipidemia is correlated more with the atorvastatin dose and less with peak systemic drug exposure.1,2,3,4 Reductions in atorvastatin Cmax are not associated with changes in LDL-C lowering efficacy.1,5,6 The biological processes governing the changes in LDL-C occur over a range of weeks to months, whereas plasma concentrations of atorvastatin peak within an hour after dosing.7 The differences in timescale between Cmax and pharmacodynamics, along with the other information described above, provide a rationale for total daily exposure (area under the concentration–time curve (AUC)) being more predictive of changes in LDL-C in comparison with Cmax.
Leveraging the strong dose–response relationship for statin efficacy on LDL-C reduction, Mandema et al.8 developed a dose–response model for statin LDL-C lowering as monotherapy and in combination with ezetimibe. This “comparator” model or metadata analysis described dose responses of six different statins and combinations at the study-arm level. This work updated the dose–response model using published clinical data from 245 statin trials in 106,808 patients (Table 2).
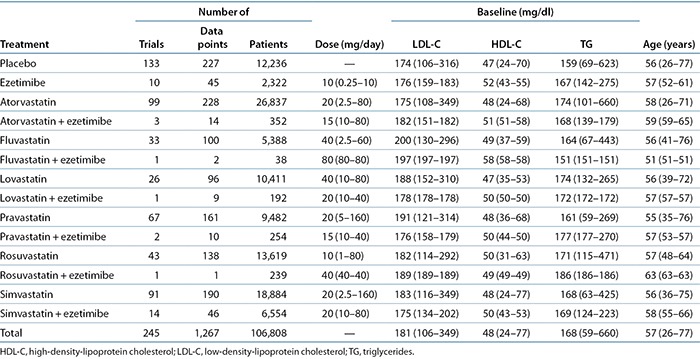
Table 2. Overview of trial data for literature-based meta-analysis of statins and statins coadministered with ezetimibe by treatment.
To predict the potential impact of the changes in exposure for ezetimibe+atorvastatin FDC on LDL-C lowering efficacy, the differences in pharmacokinetic exposure had to be translated into LDL-C lowering. Dose–exposure models for atorvastatin AUC and Cmax were developed from the coadministration reference arms of the BE studies. Assuming that the observed exposures (AUC and Cmax) for the FDC translated into shifts in dose, effective dose distributions were generated as input for the statin dose–LDL-C model, allowing translation from exposure to LDL-C lowering efficacy.
The modeling results and publicly available supporting data were submitted to the US Food and Drug Administration (FDA) for the approval of the ezetimibe+atorvastatin FDC.9,10 Because the regulatory decision was primarily based on the BE data, a standard in providing a clinical bridge for product quality, efficacy, and safety that has been applied to other similar FDCs, additional clinical data were requested by the FDA. The model-predicted differences in LDL-C lowering for the FDC were used to design two clinical equivalence (CE) trials that evaluated the doses that did not meet atorvastatin Cmax BE, the results of which were submitted to the FDA.
Results
BE results
Two BE studies were conducted to cover the dose range of the FDC. The primary hypotheses for the BE studies were that the observed geometric mean ratios and the 90% confidence intervals (CIs) for atorvastatin AUC0–∞, atorvastatin Cmax, unconjugated ezetimibe AUC0–last, and unconjugated ezetimibe Cmax would fall within the range of 0.8–1.25. The results of the BE studies, performed in the fasting state, demonstrated BE between a single dose of the ezetimibe+atorvastatin FDC tablets and coadministration of corresponding doses of ezetimibe and atorvastatin as individual tablets for all of the primary end-point variables, except atorvastatin Cmax at the 10/20- and 10/40-mg doses (Table 1). Summary statistics for the trials are presented in Supplementary Material S1 online.
Literature-based meta-analysis
An updated dose–LDL-C reduction model based on publicly available trial data was developed for statin monotherapy and coadministration with ezetimibe. A total of 245 of 365 trials in the database met the inclusion criteria for this analysis (Table 2). The trials represented data from 106,808 patients and evaluated all treatments across a large range of doses. A total of 1,267 data points are in the analysis set. Each data point is the mean response in a group of patients at a particular time point in an arm of a trial plus its associated normally distributed variance (i.e., study-arm level data). In pooling the data, data points were weighted based on sample size.
Immediate-release, once-daily administration is the standard statin regimen for the treatment of dyslipidemia. To assess the impact of peak statin exposure on LDL-C reductions, trials testing twice-daily dosing and controlled-release formulations with total daily exposures (AUC) similar to those of once-daily immediate-release formulations but with reduced peak exposures (Cmax) were also included in the analysis. Fluvastatin was given b.i.d. in six trials (295 patients), lovastatin was given b.i.d. in five trials (3,562 patients), and pravastatin was given b.i.d. in six trials (493 patients). Fluvastatin was given as an extended-release formulation in 10 trials (1,558 patients) and lovastatin was given as an extended-release formulation in 2 trials (314 patients).
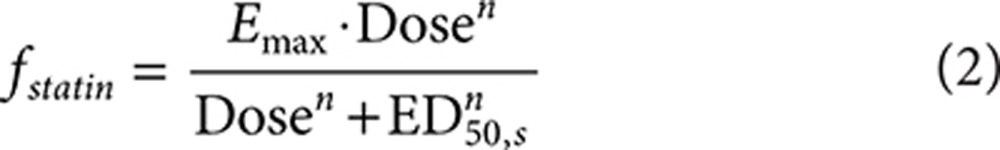
The final statin dose–response model includes a different potency (half-maximal effective dose (ED50)) for each statin, with a similar Emax (maximum reduction in LDL-C) and sigmoidicity (n) for the statins (Eq. 2). ED50 characterizes the dose at which 50% of the maximal response is achieved. The sigmoidicity factor captures the slope of the change from baseline to maximum response around ED50.
 |
 |
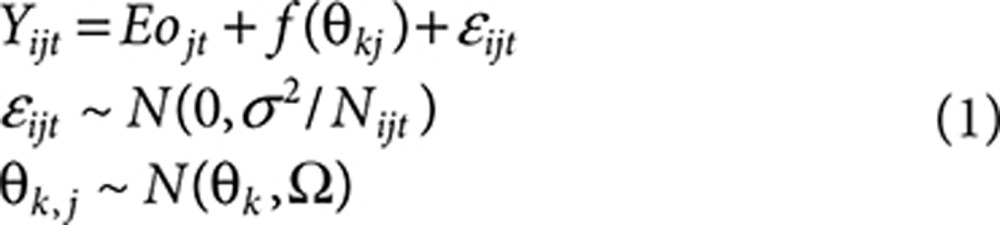
In these equations, Yijt is the mean LDL-C response at time t for the ith arm in the jth trial. Eojt represents the placebo response at time t for the jth trial. f(Θkj) is the dose–response model for statin and ezetimibe mono- or combination therapy with model parameter Θ1…k. The parameter εijt reflects the random residual error due to between- and within-subject variability, assumed to be normally distributed with variance σ2/Nij. σ is the SD of the percentage change from baseline, and Nijt is the sample size at time t for the ith arm in the jth trial. The relative influence of individual data points was weighted by treatment sample size during model development by influencing the variance around that data point. In the combination (fcombination), fstatin is the statin dose–response relationship for monotherapy; fezetimibe is the fractional change in lipids due to ezetimibe monotherapy; and γ is the interaction coefficient (Eq. 3).
The time course of LDL-C was not described because time did not have a significant impact on the Emax of statins, confirming that a steady-state effect had been achieved after at least 4 weeks of treatment. No significant difference in Emax or sigmoidicity was found between the statins. The maximal LDL-C reduction for statins was found to be significantly dependent on baseline LDL-C (LDL.base) (P < 0.0001) and triglycerides (P = 0.0005), the percentage of patients with coronary heart disease (P = 0.0001), and whether the patients had acute coronary syndrome (P = 0.0004) or heterozygous familial hypercholesterolemia (P = 0.0003), according to the following model:
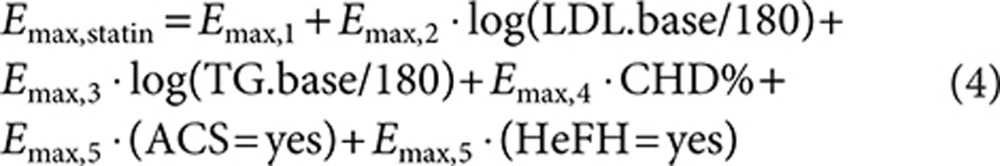 |
Ezetimibe dose response followed the same response equation as that for statins (Eq. 2), with the sigmoidicity factor (n) fixed to 1. None of the covariates were found to significantly affect the Emax of ezetimibe. The covariate effects were not tested on the ED50 of ezetimibe because the 10-mg dose (for which most data are available) is at Emax.
There was no significant difference in the interaction coefficient between statins and ezetimibe among the statins. In addition, there was also no significant impact of baseline lipids on the interaction coefficient.
In the assessment of imputation methods, there was no significant difference in the magnitude of response between trials that reported the mean or median change in LDL-C. There was also no significant difference between trials that reported the mean percentage change or trials for which the percentage change was imputed from the mean baseline and mean on trial lipid values.
Between-trial variances were estimated for both Emax and ED50 to quantify the impact of between-trial heterogeneity on the response of statins and ezetimibe. No significant between-trial heterogeneity on the Emax and ED50 of the statin and ezetimibe dose–response relationships was found, and the between-trial variances for these parameters were fixed to zero.
The trials testing twice-daily dosing and controlled-release formulations were fit to assess changes in potency (ED50), which would predict the impact of the blunted peak exposures (Cmax) on efficacy. The ED50 (based on total daily dose) of fluvastatin and lovastatin was significantly lower for the b.i.d. (P < 0.0001 for both fluvastatin and lovastatin) as compared with the q.d. administrations (Figure 1). The ED50 values of fluvastatin and lovastatin were also significantly lower for the controlled-release formulations (P < 0.0001 for fluvastatin and P = 0.0048 for lovastatin) as compared with the normal immediate-release formulations. In fact, the ED50 values for the b.i.d. and controlled-release formulations were similar for both fluvastatin and lovastatin. For pravastatin, there was no statistically significant difference in potency between b.i.d. and q.d. administration regimens (Figure 1). Therefore, the blunted peak exposures for b.i.d. dosing and extended-release formulations resulted in similar or better efficacy as compared with the standard clinical treatment with the once-daily, immediate-release regimen for the same total daily dose.
Figure 1.

Impact of dosing regimen and formulation on low-density-lipoprotein cholesterol (LDL-C) dose response. A once-daily (q.d.) regimen is compared with twice-daily (b.i.d.) administration, and extended-release (ER) formulations are compared with immediate-release (IR) formulations.
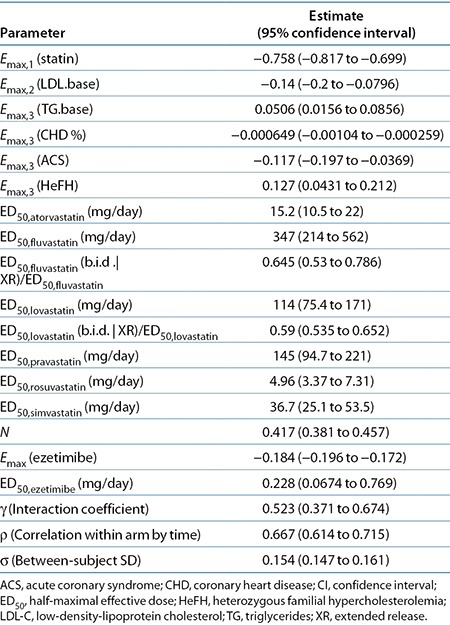
Table 3 presents the parameter estimates of the final LDL dose–response model. The effect of statins in terms of maximal change from baseline is estimated to be −76% (95% CI: −82 to −70) in a patient population with a mean baseline LDL-C of 180 mg/dl, a mean baseline triglyceride level of 180 mg/dl, and no evidence of coronary heart disease, acute coronary syndrome, or heterozygous familial hypercholesterolemia. The effect of ezetimibe in terms of maximal change from baseline is estimated to be −18.4% (95% CI: −19.6 to −17.2). The interaction coefficient for the coadministration of statins and ezetimibe was estimated to be 0.523 (Table 3). Thus, the combined effect of ezetimibe and statins is not simply the sum of the two effects. At maximal effect for statin and ezetimibe combination treatment, the LDL-C reduction would be predicted to be reduced by ~7% of the sum of the two maximal monotherapy effects (Eq. 3).
Table 3. Final statin LDL-C dose–response model parameter estimates.
The model was found to characterize the data from each trial well. The characterization of the aggregate monotherapy dose–response relationship across the trials in a typical patient population for each statin and ezetimibe is shown in Figure 2.
Figure 2.

Low-density-lipoprotein cholesterol (LDL-C) dose response of statin monotherapy and combination therapy with 10 mg ezetimibe in a typical patient population. The solid lines are the model-predicted dose–response relationships for the difference from placebo for each statin for a typical patient population with a mean baseline LDL of 181, mean triglycerides of 168, and mean baseline high-density lipoprotein level of 48, and 24% of patients with coronary heart disease and no acute coronary syndrome or heterozygous familial hypercholesterolemia . The symbols are the mean observed values with an ~95% confidence interval (CI) for a specific daily dose across all trials after adjustment for differences across the trials in covariates. The CI for some mean observations is smaller than the symbol size due to the large amount of data.
Prediction of LDL-C differences
To translate the observed exposure differences between marketed atorvastatin tablets coadministered with marketed ezetimibe tablets and atorvastatin in the FDC, an effective dose value was calculated. The calculated effective dose reflected a reduced dose associated with the observed reduced exposure in the BE trial. This reduced dose was then used to predict the reduced LDL-C lowering via the dose–response model.
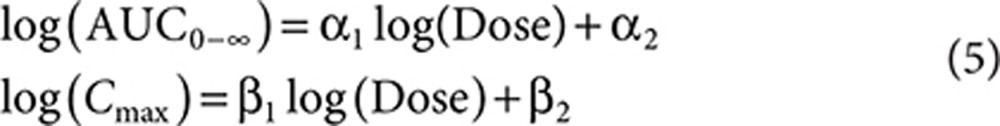
Two linear regression models, one describing atorvastatin log(AUC) as a function of log(dose) and another describing atorvastatin log(Cmax) as a function of log(dose), were developed using the atorvastatin data from the coadministration arm (simultaneous dosing of each compound using the individual marketed tablets) of the BE studies testing the FDC, which included 10/10-, 10/20-, 10/40-, and 10/80-mg doses. The AUC and Cmax were found to be nonlinear in the dose–exposure model, with slopes (95% CIs) of 1.07 (1.01, 1.13) and 1.31 (1.24, 1.37), respectively. The slopes were then used to calculate the effective atorvastatin dose that corresponded to the ezetimibe+atorvastatin FDC atorvastatin exposure data for each atorvastatin dose. LDL-C response was then predicted from the effective dose distributions.
Simulations of the LDL-C dose–response model using the effective dose distributions were conducted for all FDC doses with the three dose–exposure models: AUC, Cmax, and combined AUC and Cmax models (Table 4). The combined AUC and Cmax model is a weighted average of the resulting effective dose from the AUC and Cmax models, in which the weights are the precisions of the respective estimates. The AUC model predicted the smallest difference in LDL-C, and the combined AUC and Cmax model falls closer to the AUC model than to the Cmax model. The LDL-C response curve as a function of Cmax across the dose range is flat (Figure 3), driven by the observed nonlinearity of Cmax and doses that are near the flat part of the dose–response curve. These model results predict that when atorvastatin Cmax is different between two formulations (e.g., the largest difference of a 23% reduction for the 10/20 FDC; Table 1), the effect of Cmax on the percentage of LDL-C lowering translates directly into a change of <1.2% absolute difference in the reduction in LDL-C (Table 4).
Table 4. Summary of predicted difference in LDL-C lowering efficacy for ezetimibe+atorvastatin FDC and coadministration of individual tablets (coadministration – FDC, median (95% confidence interval)).
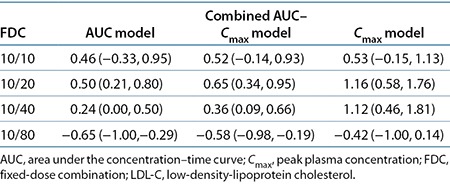
Figure 3.

Predicted difference in low-density-lipoprotein cholesterol (LDL-C) from coadministration for ezetimibe/atorvastatin FDC tablets as a function of atorvastatin geometric mean ratio (GMR). Median prediction: solid line; 95% confidence interval: shaded region; GMR of the observed bioequivalence (BE) data and 90% confidence interval: boxes with lines.
Powering of CE trials
The sample size of 406 patients for the CE trials for the 10/20- and 10/40-mg doses was originally calculated assuming dose-proportional exposure decreases in the effective dose from the 10/20-mg BE data. The resulting effective dose from the dose proportionality assumption was used in conjunction with the published statin meta-analysis8 to obtain the prediction of distribution of treatment difference between FDC and coadministration of the individual components. At the sample size of 406 patients, given the predicted distribution of treatment difference, the probability of success of the CE study was ~80%. The sample size was used in the 10/40-mg protocol. Leveraging updated statin meta-analysis with the prediction from the simulations using the BE studies and dose–exposure analysis allowed for a more accurate estimate of the treatment difference. The sample sizes for the 10/20- and 10/40-mg doses were reduced to 376 and 300, respectively, while maintaining a higher probability of success of 90%.
Discussion
The large amount of literature data available for the meta-analysis resulted in a robust dose–response model for LDL-C reductions. The model captures the data across 245 studies for both statin monotherapy and statins in combination with ezetimibe. The published data on atorvastatin show that a reduction in LDL-C associated with the administration of atorvastatin is more highly correlated with the total daily atorvastatin dose rather than with the measurement of peak atorvastatin exposure (Cmax).1,2,3,4
Peak exposure is blunted when the same total daily dose is given as a split dose twice daily or as a single extended-release formulation. However, the modeling analysis concluded that the blunted peak exposures for b.i.d. dosing and extended-release formulations resulted in similar or better efficacy as compared with that of the standard clinical treatment with once-daily immediate-release regimen for the same total daily dose. Thus, consistent with the literature data, the LDL-C dose–response model quantitatively predicts that a reduction in LDL-C associated with the administration of atorvastatin is more likely to be correlated with total daily exposure (AUC) rather than with the measurement of peak atorvastatin exposure (Cmax).
Notwithstanding the above, the most stringent (“worst case”) evaluation of the impact of efficacy differences between the FDC and coadministration of individual components implements the assumption that Cmax is correlated with the effective dose of atorvastatin. This evaluation is an extremely “conservative approach” because it actually runs contrary to the clinical evidence. These model results predict that when atorvastatin Cmax is different between two formulations (e.g., the largest difference of a 23% reduction for the 10/20-mg FDC; Table 1), the effect of Cmax on the percentage of LDL-C lowering translates directly into a change of <1.2% absolute difference in the reduction in LDL-C (Table 4). This absolute difference based on the most stringent assumption was not predicted to be clinically relevant relative to the predicted coadministration LDL-C percentage change from baseline of 50.3–65.1% for the 10/10- to 10/80-mg dose range. Although there is no standard definition of a clinically relevant change in LDL-C, 1.2% represents a small proportion of the ~6% LDL-C change associated with titration to the next higher dose of a statin and thus would be considered not relevant in clinical practice. When more clinically relevant metrics of a change in the AUC0–∞ or a combined change in both AUC0–∞ and Cmax exist, the models predicted a smaller absolute difference in the LDL-C reduction of <0.65%. Thus, the impact of the differences in bioavailability (specifically, Cmax) between the FDCs and coadministration of individual atorvastatin and ezetimibe tablets was predicted not to result in a clinically relevant change in efficacy.
These model predictions are also consistent with the labeling of atorvastatin, which can be given with or without food.11 In the food effect study for atorvastatin, Cmax was lowered by 25% and AUC was lowered by 9% when dosed with evening meals. However, the magnitude of the reduction in atorvastatin Cmax and AUC did not affect the LDL-C efficacy of atorvastatin after 15 days of dosing.5
As previously noted, the LDL-C differences simulated with the dose–response model and BE data were leveraged to design the CE trials. Both cost and timelines were reduced by decreasing the total number of patients in the two CE trials by ~17%. Both doses were found to be clinically equivalent in these CE trials (10/20:−0.2 (−1.7, 1.3), 10/40:−0.2 (−1.9, 1.4)), % LDL-C lowering least squares mean difference (97.5% expanded CI)). Thus, the model-based predictions fully overlap with the observed lack of change in clinical end point. Although the model-based translation of the BE results was not accepted in support of the FDC filing, after review of the CE study results, the FDC was later approved by the FDA.9,10
This work highlights the predictive power of leveraging large amounts of publicly available data. The modeling and simulation analyses were able to quantitatively conclude that LDL-C reduction is more closely correlated with total daily exposure, rather than with peak exposure, with high precision and confirmation in the CE study results. In addition, the analyses allowed for optimal design of the CE trials and accurately predicted their outcomes. It would be expected that similar models leveraging relevant publicly available information can also successfully predict the effectiveness of new dosage formulations and arguably may negate the need for dedicated clinical efficacy trials after near-miss BE study results.
Methods
BE studies. Two BE studies were conducted to cover all dose combinations for ezetimibe and atorvastatin. Each dose combination was evaluated in an open-label, randomized, two-period crossover study to demonstrate the definitive BE after administration of a single dose of the ezetimibe/atorvastatin FDC tablet and coadministration of corresponding doses of ezetimibe (Zetia) and atorvastatin (Lipitor) as individual tablets in healthy adult subjects. Primary end points were atorvastatin AUC0–∞, atorvastatin Cmax, unconjugated ezetimibe AUC0–last, and unconjugated ezetimibe Cmax, with the true geometric mean ratio of the treatments falling within 0.80 and 1.25. Additional study details and statistical methods are presented in Supplementary Material S1 online.
Literature-based meta-analysis. A database of changes in lipids, safety parameters, imaging outcomes, and cardiovascular outcomes after treatment with statins, fibrates, cholesterol absorption inhibitors, niacin, or combinations thereof reported in controlled clinical trials published in the medical literature or available from the FDA and the European Medicines Agency websites was developed. Search terms and the inclusion and exclusion criteria are presented in Supplementary Material S2 online, along with the list of references used in the database. A total of 245 trials were identified that met the inclusion criteria for the current analysis. Model building and simulation were conducted in S-PLUS (version 6.2.1, Insightful, Seattle, WA) using the GNLS and NLME packages.
Dose–response model. The dose response for the fractional change (%/100) in lipid values for statin and ezetimibe monotherapy was characterized using Eq. 1. A different placebo response was estimated for each time point in each trial to account for variability in the time course of the placebo response across the trials (nonparametric placebo model). Base statin and ezetimibe model structures are presented in Eq. 2, and the interaction for coadministration of statins and ezetimibe is presented in Eq. 3.
Covariates. Time, regimen, formulation, and baseline levels of LDL-C, high-density-lipoprotein cholesterol, and triglycerides were evaluated for their impact on the maximal effect of the statin dose–response relationship. Due to the skewed distribution of the baseline LDL-C, high-density-lipoprotein cholesterol, and triglyceride values, the log of these values was used in the regression analysis. The impact of age, percentage of men, race (Asian vs. non-Asian), percentage of patients with diabetes, and percentage of patients with coronary heart disease, acute coronary syndrome, metabolic syndrome, heart failure, peripheral artery disease, hypertension, proteinuria, or heterozygous familial hypercholesterolemia on the dose–response relationship of statins and ezetimibe was also evaluated. Missing covariates were imputed on the basis of their relationship with other covariates. The impact of the imputation method (mean percentage change vs. percentage change of means) and summary statistics (mean vs. median) on the dose–response relationship was evaluated.
Model selection. A stepwise addition and deletion model selection strategy was used, and both linear and nonlinear relationships between the explanatory variables and model parameters were evaluated. Model selection was done on the basis of a log-likelihood ratio test and SE of the parameter estimate at an acceptance P value of 0.01. The SE of the parameter estimate for covariate relationships was also considered. If the 95% CI of the parameter estimate included 0, the parameter was not included in the model. The clinical relevance of any relationship was also considered.
LDL-C difference. The dose–response model was used to predict the mean response and uncertainty in the mean response as a function of dose and patient characteristics. A total of 10,000 sets of model parameters were sampled from the variance matrix. For each set of model parameters, pharmacodynamic end points were predicted to generate the predictive distribution as a function of treatment and patient characteristics. The 95% CI was taken from the 2.5th to the 97.5th percentiles.
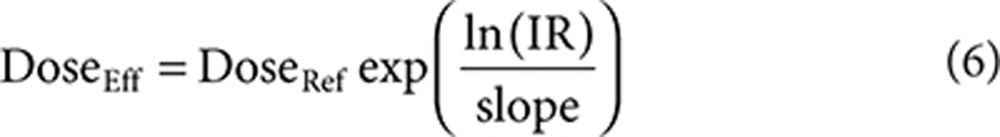
The FDC that would provide a atorvastatin AUC or Cmax similar to the coadministration (effective dose) was calculated from the results of the two BE studies. These effective dose distributions allowed simulation with the LDL-C dose–response model to predict the difference in LDL-C between the FDC and coadministration of the individual components. To calculate the effective dose distributions, two dose–exposure models were developed for atorvastatin: AUC0–∞ as a function of dose, and Cmax as a function of dose.
 |
Effective dose distributions were calculated for each model, where DoseEff and DoseRef are the effective and reference atorvastatin dose, respectively. IR is the individual ratio (e.g., AUCtest/AUCref).
 |
In addition, a combination of both pharmacokinetic parameters was considered to assess whether it provided a potentially better prediction of response. The combined (AUC–Cmax) estimate of effective dose was derived as a weighted mean of the effective doses based on AUC0–Cmax. The relative contribution, or weight, of each model (AUC0–Cmax) to the effective dose calculation is determined by the precision of the model's respective effective dose estimates. In other words,
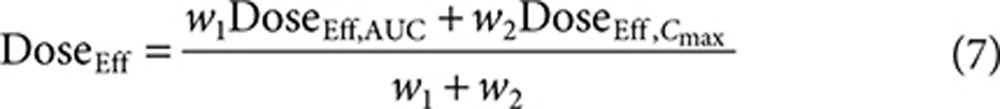 |
with 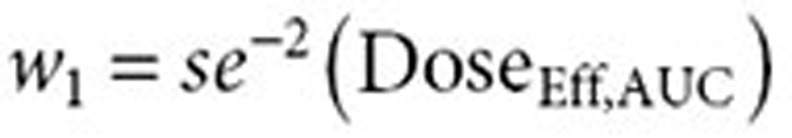 and
and 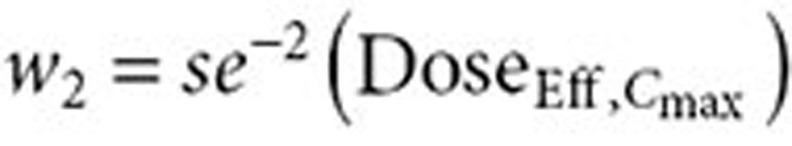 . Effective dose distributions were simulated for all three models for all four atorvastatin doses in the FDC, resulting in 12 distributions. A total of 10,000 simulations were run for each distribution. The simulations bootstrapped with replacement the observed individual ratios from the BE studies. The variability in the parameter estimates from the dose–exposure analysis was taken into account by using the variance–covariance matrix in the simulations. Each simulation resulted in the average atorvastatin dose for the effective dose distribution.
For ezetimibe, the dose to provide the same exposure (effective dose) was calculated assuming dose-proportional pharmacokinetics. To estimate the potential impact of this reduced effective dose, the dose–response relationship for the FDC was simulated (10,000 simulations per dose) based on the estimated dose–response relationship of the combination therapy with atorvastatin and ezetimibe derived from the meta-analysis. The simulation also included the uncertainty of the reduction in effective dose from the BE studies.
Calculation of the sample size for CE trials. The original sample size of 406 patients was chosen to provide 95% power in order to establish that ezetimibe+atorvastatin combination and ezetimibe+atorvastatin coadministration are equivalent. The sample size calculation was based on equivalence margins of ±4%, assumed true difference of 1.5%, SD of within-patient difference of 12.8%, and 85% evaluability rate using two one-sided tests,12 each at a 2.5% significance level. The assumption of the true difference of 1.5% was based on the effective dose of atorvastatin calculated using a dose proportionality assumption at the 10/20-mg dose for both AUC and Cmax. The dose was input into the model proposed by Mandema et al.,8 which gave a prediction of ~1.5% difference. Based on the initial predicted distribution of difference based on the dose proportionality assumption, the sample size of 406 patients translates to an ~80% probability of success.
The updated sample size incorporated the predictions from the updated dose–response model that accounted for the greater-than-dose-proportional increase in exposure. The gain in precision from the more elaborate modeling exercise resulted in a distinct and more accurate predicted distribution of differences between FDC and coadministration of its components for both the 10/20- and the 10/40-mg doses. This higher precision led to a reduced sample size, an overall savings of 17% across the two CE studies, and a higher probability of success (90% for each study).
Author Contributions
R.V. wrote the manuscript; R.V., A.A., M.O.B., J.M., and T.K. designed the research; R.V. performed the research; and R.V., A.A., M.O.B., J.M., and T.K. analyzed the data.
Study Highlights
Acknowledgments
We acknowledge G. Winchell and S. Allerheiligen of Merck & Co., for their initial assessment of the modeling and drive to incorporate into the development plan. Moreover, we acknowledge the valuable and critical input of A. Polis and A. Tershakovec toward model and manuscript development, in addition to acknowledging J. Tomassini, M. Vollmer, and S. Erespe, also of Merck & Co., for editorial support and shepherding of the process.
This research was supported by Merck & Co., Whitehouse Station, NJ. R.V., M.O.B., and T.K. are full-time employees, and A.A. is a former employee of Merck Sharp & Dohme Corp., a subsidiary of Merck & Co., and may hold stock/stock options in the company. J.M. was a paid contractor for Merck & Co.
Footnotes
SUPPLEMENTARY MATERIAL is linked to the online version of the paper at http://www.nature.com/cpt
Supplementary Material
References
- Cilla D.D., Jr, Whitfield L.R., Gibson D.M., Sedman A.J., Posvar E.L. Multiple-dose pharmacokinetics, pharmacodynamics, and safety of atorvastatin, an inhibitor of HMG-CoA reductase, in healthy subjects. Clin. Pharmacol. Ther. 1996;60:687–695. doi: 10.1016/S0009-9236(96)90218-0. [DOI] [PubMed] [Google Scholar]
- Lennernäs H., Fager G. Pharmacodynamics and pharmacokinetics of the HMG-CoA reductase inhibitors. Similarities and differences. Clin. Pharmacokinet. 1997;32:403–425. doi: 10.2165/00003088-199732050-00005. [DOI] [PubMed] [Google Scholar]
- Lennernäs H. Clinical pharmacokinetics of atorvastatin. Clin. Pharmacokinet. 2003;42:1141–1160. doi: 10.2165/00003088-200342130-00005. [DOI] [PubMed] [Google Scholar]
- Whitfield L.R., Stern R.H., Sedman A.J., Abel R., Gibson D.M. Effect of food on the pharmacodynamics and pharmacokinetics of atorvastatin, an inhibitor of HMG-CoA reductase. Eur. J. Drug Metab. Pharmacokinet. 2000;25:97–101. doi: 10.1007/BF03190074. [DOI] [PubMed] [Google Scholar]
- Radulovic L.L., Cilla D.D., Posvar E.L., Sedman A.J., Whitfield L.R. Effect of food on the bioavailability of atorvastatin, an HMG-CoA reductase inhibitor. J. Clin. Pharmacol. 1995;35:990–994. doi: 10.1002/j.1552-4604.1995.tb04015.x. [DOI] [PubMed] [Google Scholar]
- Stern R.H., Yang B.B., Hounslow N.J., MacMahon M., Abel R.B., Olson S.C. Pharmacodynamics and pharmacokinetic-pharmacodynamic relationships of atorvastatin, an HMG-CoA reductase inhibitor. J. Clin. Pharmacol. 2000;40:616–623. [PubMed] [Google Scholar]
- Faltaos D.W., et al. Use of an indirect effect model to describe the LDL cholesterol-lowering effect by statins in hypercholesterolaemic patients. Fundam. Clin. Pharmacol. 2006;20:321–330. doi: 10.1111/j.1472-8206.2006.00404.x. [DOI] [PubMed] [Google Scholar]
- Mandema J.W., et al. Model-based development of gemcabene, a new lipid-altering agent. AAPS J. 2005;7:E513–E522. doi: 10.1208/aapsj070352. [DOI] [PMC free article] [PubMed] [Google Scholar]
- Merck & Co FDA approves Merck's LIPTRUZET™ (ezetimibe and atorvastatin), a new product that can help powerfully lower LDL cholesterol. < < http://www mercknewsroom com/press-release/research-and-development-news/fda-approves-mercks-liptruzet-ezetimibe-and-atorvastatin > ( 2013
- Merck & Co. Liptruzet (Ezetimibe/Atrovastatin) [Package Insert] Merck; Whitehouse Station, NJ; 2013. [Google Scholar]
- Pfizer. Lipitor (Atorvastatin Calcium) Tablets [Package Insert] Pfizer; New York,; 2012. [Google Scholar]
- Schuirmann D.J. A comparison of the two one-sided tests procedure and the power approach for assessing the equivalence of average bioavailability. J. Pharmacokinet. Biopharm. 1987;15:657–680. doi: 10.1007/BF01068419. [DOI] [PubMed] [Google Scholar]
Associated Data
This section collects any data citations, data availability statements, or supplementary materials included in this article.