Abstract
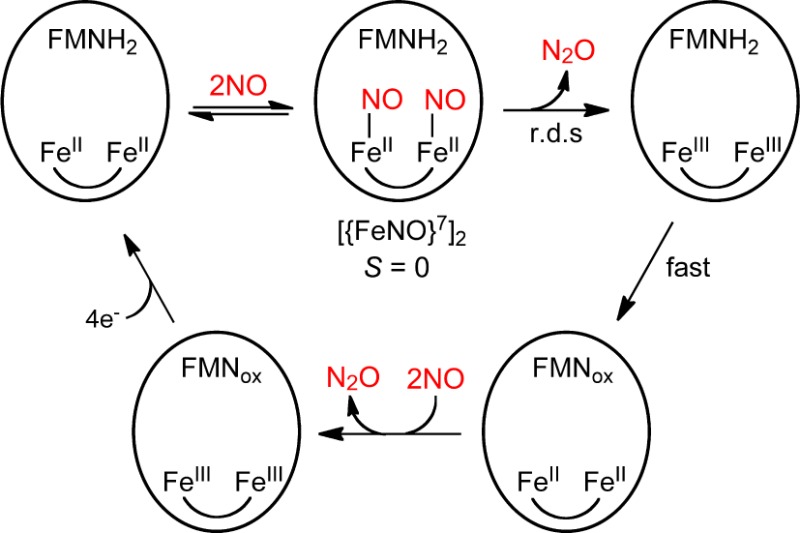
The unique active site of flavo-diiron proteins (FDPs) consists of a nonheme diiron-carboxylate site proximal to a flavin mononucleotide (FMN) cofactor. FDPs serve as the terminal components for reductive scavenging of dioxygen or nitric oxide to combat oxidative or nitrosative stress in bacteria, archaea, and some protozoan parasites. Nitric oxide is reduced to nitrous oxide by the four-electron reduced (FMNH2–FeIIFeII) active site. In order to clarify the nitric oxide reductase mechanism, we undertook a multispectroscopic presteady-state investigation, including the first Mössbauer spectroscopic characterization of diiron redox intermediates in FDPs. A new transient intermediate was detected and determined to be an antiferromagnetically coupled diferrous-dinitrosyl (S = 0, [{FeNO}7]2) species. This species has an exchange energy, J ≥ 40 cm–1 (JS1 ° S2), which is consistent with a hydroxo or oxo bridge between the two irons. The results show that the nitric oxide reductase reaction proceeds through successive formation of diferrous-mononitrosyl (S = 1/2, FeII{FeNO}7) and the S = 0 diferrous-dinitrosyl species. In the rate-determining process, the diferrous-dinitrosyl converts to diferric (FeIIIFeIII) and by inference N2O. The proximal FMNH2 then rapidly rereduces the diferric site to diferrous (FeIIFeII), which can undergo a second 2NO → N2O turnover. This pathway is consistent with previous results on the same deflavinated and flavinated FDP, which detected N2O as a product (Hayashiet al. Biochemistry 2010, 49, 7040.). Our results do not support other proposed mechanisms, which proceed either via “super-reduction” of [{FeNO}7]2 by FMNH2 or through FeII{FeNO}7 directly to a diferric-hyponitrite intermediate. The results indicate that an S = 0 [{FeNO}7}]2 complex is a proximal precursor to N–N bond formation and N–O bond cleavage to give N2O and that this conversion can occur without redox participation of the FMN cofactor.
Introduction
Flavo-diiron proteins (FDPs) are widespread in microaerophilic and anaerobic microorganisms, including bacteria, archaea, and a few protozoan parasites.1−10 The accumulated genetic and biochemical evidence indicates that FDPs are the terminal components of a reductive dioxygen (O2) and/or anaerobic nitric oxide (NO) scavenging pathways. The FDP-catalyzed four-electron reduction of O2 to water (O2R activity) or the two-electron reduction of two NO molecules to nitrous oxide (NOR activity) protects against accumulation of toxic reactive oxygen or nitrogen species.
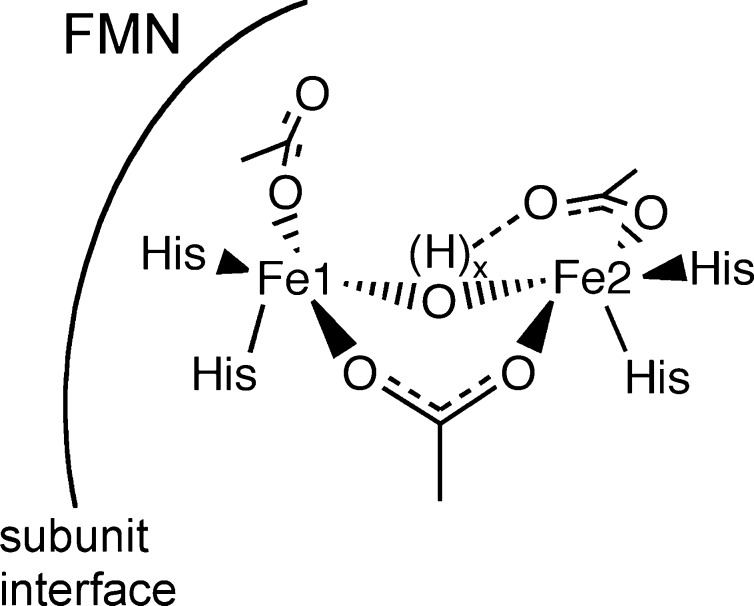
FDPs are soluble cytoplasmic enzymes with a “head-to-tail” homodimer as the minimum functional unit.3,11,12 The homodimer contains two symmetrically disposed active sites ∼40 Å apart. Each active site consists of a nonheme diiron cluster (Fe1–Fe2 distance 3.2–3.6 Å), and a flavin mononucleotide (FMN) cofactor located ∼4 Å from the diiron site across the subunit interface, as diagrammed in Scheme 1.11−13 In almost all structurally characterized FDPs, each iron of the diiron site contains two histidine ligands and a terminal monodentate carboxylate ligand from either aspartate or glutamate. A bridging bidentate carboxylate from an aspartate residue and a protonated solvent ligand complete the diiron coordination sphere, resulting in two five-coordinate irons. One FDP structure contains a terminal solvent in place of a His ligand, which is rotated away from Fe2.14 Site-directed mutations show that this substitution has surprisingly minor effects on structure and activities.13 Open or solvent-occupied sixth coordination sites trans to His ligands on each iron are oriented toward a buried pocket, which in some structures contains solvent or other exogenous small molecules. The relatively nonpolar O2 or NO diffuse into this pocket and presumably bind to these labile coordination sites during O2R or NOR turnover. Under aerobic conditions, the active site of FDPs is in the FMNox–FeIIIFeIII oxidation state (FDPox), but the diferrous oxidation state is necessary for substrate reduction.15,16 At least one function of the FMN is to funnel reducing equivalents from exogenous electron donors to the diiron site. The fully reduced active site, FMNH2–FeIIFeII (FDPred) thus has the capacity to deliver up to four electrons to either one O2 or four NOs during O2R or NOR turnover.
Scheme 1.
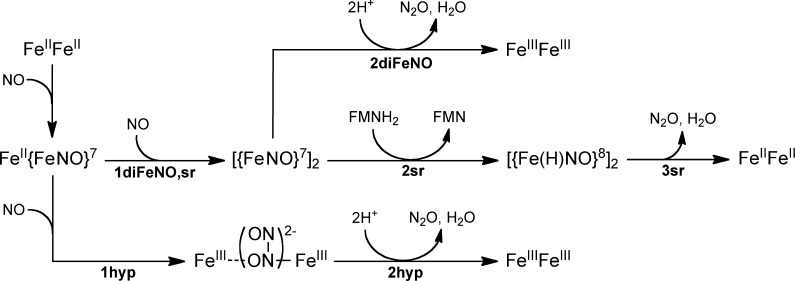
Here, we address the NOR mechanism of FDPs, proposals for which are shown in Scheme 2.3,17,18 All three proposed mechanisms, labeled diFeNO, sr, and hyp, initiate from a diferrous-mononitrosyl, FeII{FeNO}7, which forms as a stable species upon addition of less than 1 equiv of NO per diferrous site.16,19 ({FeNO}7 is the Enemark–Feltham notation for ferrous-nitrosyl.20) diFeNO and sr both propose that binding of a second NO (step 1diFeNO,sr) leads to a diferrous-dinitrosyl ([{FeNO}7]2) intermediate. Steps 2diFeNO and 2sr represent alternative rate-limiting reactions of the diferrous-dinitrosyl. In step 2diFeNO, the two coordinated NOs react to form an N–N bond, are protonated, and lose the elements of water, thereby generating N2O and a diferric site. In the alternative rate-limiting step, 2sr, FMNH2 “super-reduces” the [{FeNO}7]2 to a highly reactive diferrous-dinitroxyl ([{Fe(H)NO}8]2), which decays to diferrous (FeII·FeII) with release of N2O. The hyp mechanism18 proposes that the second NO reacts directly with the {FeNO}7 center of FeII{FeNO}7 (step 1hyp), leading to a formally diferric-O,N-semibridging hyponitrite intermediate (FeIII–(N2O22–)–FeIII), which decays in the rate-limiting step to diferric with release of N2O. Of the three proposed mechanisms, only sr requires redox participation of the FMN cofactor prior to or at the rate-limiting step leading to N2O.
Scheme 2.
In order to separate the functions of the FMN and the diiron site, the reaction of NO with the diferrous deflavinated (deflavo) FDP from Thermotoga maritima (Tm) was examined.16 The results were consistent with reaction of the FeII{FeNO}7 with a second NO leading to parallel productive (i.e., N2O generating) and unproductive pathways. These results suggested that at least a portion of the diiron sites are capable of catalyzing N2O formation in the absence of FMN, which is consistent with either mechanisms diFeNO or hyp but not with mechanism sr in Scheme 2. However, more recent studies on a synthetic diferrous-dinitrosyl complex seem to support the feasibility of “super-reduction” in mechanism sr.21 The observation of an unusually low N–O stretching frequency in the FeII{FeNO}7 complex of Tm FDP led to the proposal that the coordinated NO is activated for reaction with a second NO, which would seem to support mechanism hyp.19
In order to clarify these mechanistic ambiguities, we have undertaken rapid kinetics studies to trap and characterize intermediates in the FDP NOR reaction. In addition, we have investigated the ultimate oxidation state of the Tm FDPred active site upon reaction with excess NO. Some characteristic spectroscopic signals have proven useful for these studies. Mononuclear nonheme ferrous nitrosyls ({FeNO}7) with weak field O,N ligands typically show an S = 3/2 ground spin state exhibiting axial g ∼ 4.0, 2.0 electron paramagnetic resonance (EPR) spectra and characteristic ligand-to-metal charge transfer UV–visible (UV–vis) absorptions at ∼650, 450, and 330 nm with ε450 nm ∼1000 M–1 cm–1.16,19,22−25 The diferrous mononitrosyl, FeII{FeNO}7, in FDP shows this characteristic UV–vis absorption but exhibits an S = 1/2 EPR spectrum (g ∼ 2.3, 1.9) due to antiferromagnetic coupling between the high spin FeII (S = 2) and the S = 3/2 {FeNO}7.16,19 Numerous studies of nonheme iron synthetic complexes and proteins have established a unique and characteristic combination of 57Fe Mössbauer isomer shift and quadrupole splitting values that unambiguously identify S = 3/2 {FeNO}7 species with N/O-ligand coordination spheres.23,26−3057Fe Mössbauer spectroscopy can furthermore distinguish between magnetically coupled versus isolated {FeNO}7 centers28,31,32 but has not previously been applied to the nitric oxide reactions of FDPs. The three flavin redox states, FMNox, FMNH (semiquinone), and FMNH2, have distinctive and characteristic visible absorption spectra.15,33 We have used all of these spectroscopic methods to identify intermediates in reactions of NO with Tm FDPred, including the first Mössbauer spectral characterizations of diiron redox intermediates during catalysis in this class of proteins. Our results clarify the roles of the FMN and the diiron site in NOR catalysis and can be used to discriminate among the mechanistic possibilities in Scheme 2.
Experimental Procedures
Reagents and General Procedures
Reagents and buffers were of the highest grade commercially available. All reagents, protein, and media solutions were prepared using water purified with a Millipore ultrapurification system to a resistivity of 18 MΩ to minimize trace metal ion contamination. Unless otherwise noted, the buffer used for all experiments was 50 mM 3-(N-morpholino)-propanesulfonic acid (MOPS) pH 7.3, which is hereafter referred to as buffer. Protein concentrations were determined by the bicinchonic acid assay (Pierce). Protein iron and FMN contents were determined using a standard ferrozine assay34 and a ε461nm value of 12 000 M–1 cm–1, respectively, the latter of which was also used to determine protein active-site concentrations.13
Proteins
The expression, purification, and flavin enrichment of recombinant Tm FDP was performed as previously described.13 Tm NADH/rubredoxin oxidoreductase (NROR),10Desulfovibrio vulgaris rubredoxin (Rd)35 and D. vulgaris FDP36 were obtained as previously described. For 57Fe enrichment of Tm FDP, a 35 mL culture of the Tm FDP expression strain was grown in Luria–Bertani broth containing 100 μg/mL ampicillin overnight at 37 °C. A 5 mL portion of this overnight culture was used to inoculate 1 L of M9 medium supplemented with 2 g of N-Z amine (Quality biological, Inc.), 0.05% glucose, and 0.5% glycerol. The culture was incubated with shaking at 37 °C for 3–4 h to an OD600nm of 0.6–1.0. Protein expression was then induced by addition of 200 mg/L arabinose, followed by 1 mg of 57Fe (Cambridge Isotope Laboratories, Inc.), which had been dissolved in 100 μL of aqua regia. The induced, 57Fe-treated culture was allowed to grow overnight with shaking at room temperature. Isolation, purification, and flavin enrichment of the 57Fe-enriched protein followed the procedures described for the natural isotope abundance Tm FDP.
Preparation of Tm FDPred
A modified version of a previously described procedure was used.19 All manipulations were carried out at room temperature. All Tm FDP concentrations are listed on a diiron site basis. Tm FDPox solutions (60–2000 μM) in buffer were placed in septum-capped vials and deoxygenated by vacuum/N2 gas purge cycles on a Schlenk line before transfer to an anaerobic N2 gas-filled glovebox (Omnilab system, Vacuum Atmosphere Inc.). All further manipulations were performed in this glovebox at room temperature. Tm FDPox was reduced by addition of 2.2 mol equiv of NADH per FDP active site in the presence of 500 nM NROR and 5 μM Rd. Under these conditions, the FMN in Tm FDP was immediately reduced to the semiquinone state, as verified by UV–vis absorption (see the Results and Discussion section). Overnight reduction under these condition resulted in the four-electron reduced yellow-colored Tm FDPred. For the RFQ Mössbauer samples, the ∼1 mM Tm FDPred solutions were centrifuged at 14 000g for 10 min to remove a precipitate. The cleared supernatant solutions were then loaded into the RFQ apparatus, as described below.
Nitric Oxide Stock Solutions
Purified nitric oxide gas was prepared by bubbling NO gas (Praxair, Inc.) through ∼50 mL of 10 M KOH in a septum-sealed 250 mL Erlenmeyer flask for 10–15 min. The Erlenmeyer flask was then transferred into the anaerobic glovebox. Twenty milliliter headspace vials (Kimble Chase, LLC) were equilibrated in the glovebox overnight, after which the vials were septum-sealed. Immediately prior to use, a septum-sealed headspace vial was evacuated using a 50 mL syringe, and approximately 20 mL of NO gas from the headspace of the Erlenmeyer flask was transferred via syringe into the evacuated vial. For ∼1.8 mM NO stock solutions, 15 mL of anaerobic buffer at room temperature was injected into the NO gas-filled headspace vial. The analogous procedure was used to prepare ∼3 mM NO stock solutions, except that the NO-filled headspace vial was cooled to 4 °C, and 15 mL of buffer chilled to 4 °C was injected into the chilled vial. The concentrations of NO in the stock solutions were quantified by adding a 25 μL aliquot to a buffered solution containing 100 μM NADH, 5 μM Rd, 500 nM NROR, and 2 μM D. vulgaris FDP. (The D. vulgaris FDP was used because it consumes NO much more rapidly than does Tm FDP.13,36) The concentration of NADH consumed upon the addition of NO was determined from ΔA340nm (ε340nm = 6200 M–1 cm–1) using an Ocean Optics USB 2000 spectrophotometer. The NO concentrations of the stock solutions were calculated from the NADH consumed and the 2NO/NADH stoichiometry.13
PROLI-NONOate Stock Solutions and Quantification of NO Delivery Equivalents
Stock solutions of disodium 1-[(2-carboxylato)pyrrolidin-1-yl]diazen-1-ium-1,2-diolate (PROLI-NONOate) (Cayman Chemical Company) were prepared by dissolving 10 mg of PROLI-NONOate in 0.5–1 mL of deoxygenated 10 mM sodium hydroxide. These stock solutions were stored in the anaerobic glovebox for no longer than 24 h prior to use. Over this time period, the PROLI-NONOate is stable in the hydroxide stock solutions and can be quantified using a ε252nm value of 8400 M–1 cm–1.37 At pH 7.4, PROLI-NONOate releases 2 mol of NO per 1 mol of NONOate with a half-time of 6 s at 22 °C.37 In our hands, the stoichiometry of NO released appeared to vary somewhat among stock solutions. The NO-delivery equivalents in the NONOate stock solutions were therefore quantified by reaction of the released NO with FeIIEDTA. A 50 mM stock of FeIIEDTA was prepared by mixing a 1:1 ratio (v/v) of 1 M EDTA, pH 7, with 100 mM FeII(NH4)2(SO4)2·6 H2O. Aliquots of 5–20 μL of the PROLI-NONOate stock solution were diluted into 1 mL of buffer, and after 30–60 s, a 2–10-fold molar excess of FeIIEDTA was added. (It was found empirically that addition of the stock NONOate directly to FeIIEDTA solutions apparently inhibited the NONOate decay.) The concentration of the resulting FeIIEDTA–NO complex was determined using a ε440nm value of 900 M–1 cm–1.16
Manual Titration of FDPred with NO for Mössbauer Spectroscopy
All manipulations were carried out in the anaerobic glovebox. A 3200 μL volume of 500 μM Tm FDPred was prepared as described above. A 400 μL portion of this Tm FDPred solution was pipetted into a Mössbauer cup and frozen in a cold well at 77 K. The remaining Tm FDPred solution was used for the NO titration experiments. For the titration experiments, two stock PROLI-NONOate solutions were prepared and quantified as described above to contain either 8 or 40 mM NO delivery equivalents. To prepare Mössbauer samples containing 0.3, 0.6, and 0.9 equiv of NO, the appropriate volumes (7.5–22.5 μL) of the PROLI-NONOate stock solution containing 8 mM NO delivery equivalents were added to 400 μL samples of 500 μM 57Fe-enriched Tm FDPred. The samples were incubated at room temperature for 5 min, transferred to Mössbauer cups, and frozen in a liquid N2-cooled cold well. The Mössbauer cups containing the frozen samples were removed from the glovebox and stored at 77 K. The same procedure was followed for titrations with higher NO concentrations except that the PROLI-NONOate stock solution containing 40 mM NO delivery equivalents was used.
Stopped-Flow Spectrophotometry
Stopped-flow UV–vis absorption spectrophotometry was performed using an SX20 stopped-flow spectrometer (Applied Photophysics, Ltd.). Spectral time courses were collected using a photodiode array (PDA) detector. The optical path length through the sample cell was either 1 cm or, for more concentrated protein solutions, 0.2 cm. All anaerobic solutions were prepared in the glovebox and pulled into a 5 mL Luer-slip syringe and needle (Fisher Scientific) that had been equilibrated in the glovebox overnight. These loaded syringes were then transferred from the glovebox, and the solutions were injected through the loading port into the drive syringe using the protocol described in the SX20 instruction manual. The stopped-flow circuit was made anaerobic by filling the drive syringes and the circuit with an anaerobic solution of 700 μM NADH, 500 nM NROR, 5 μM Rd, and 2 μM D. vulgaris FDP. This system is an efficient O2 scavenger.36 The circuit was incubated with this O2-scaveging mixture for at least 1 h and then flushed with deoxygenated water prior to loading the anaerobic reactant solutions. 2.5 mL drive syringes (Hamilton Company, USA) were used for 1:1 (v/v) mixing and a 2.5 mL/250 μL drive syringe combination was used for 10:1 (v/v) mixing. The Tm FPDred solutions were always loaded into a 2.5 mL drive syringe, and 1.8 mM NO solutions were loaded into the other drive syringe. The solutions in both drive syringes and the optical cell were cooled to 2–3 °C prior to stopped-flow mixing. Reactions with substoichiometric NO used 1:1 (v/v) mixing of a ∼2 mM anaerobic solution of Tm FDPred with a ∼1.8 mM NO solution. Reactions with excess NO used 1:1 (v/v) mixing of 130–160 μM Tm FDPred with a ∼1.8 mM NO solution. Spectra of the starting Tm FDPred under these conditions were obtained by stopped-flow mixing with anaerobic buffer in place of the NO solutions. The NO concentrations immediately after stopped-flow mixing were quantified using the same drive syringe-loaded NO solution but stopped-flow mixed with 1–5 mM FeIIEDTA in place of the protein. The FeIIEDTA was found to react with NO to form FeEDTA–NO quantitatively within the mixing dead time and to remain stable for at least several minutes.23 The FeEDTA–NO was quantified using a ε440nm value of 900 M–1 cm–1 with 440 nm monochromatic (2 nm bandwidth) and photomultiplier tube detector in order to avoid NO photodissociation. The concentrations of FDP and NO immediately after mixing are listed in the figure captions.
Rapid Freeze-Quench
A KinTek RFQ-3 rapid freeze-quench (RFQ) instrument (KinTek Corp.) was used. The mixing circuit was made anaerobic, and solutions were loaded into the drive syringes as described above for the stopped-flow experiments. Two 5 mL drive syringes were used for 1:1 (v/v) rapid mixing, and a 5 mL/500 μL drive syringe combination was used for 10:1 (v/v) mixing. FDPred solutions were loaded into the 5 mL syringe for both mixing ratios. EPR samples of Tm FDPred reactions with substoichiometric NO were prepared by rapid mixing 10:1 (v/v) of an anaerobic 200–300 μM solution of Tm FDPred with a 1.8 mM NO solution (prepared at room temperature as described above). EPR samples of Tm FDPred reactions with excess NO were prepared similarly, except mixing 1:1 (v/v) with ∼3 mM NO solution in buffer at 4 °C. EPR samples of unreacted Tm FDPred were prepared analogously to those for the NO reactions but substituting deoxygenated buffer in place of the NO solutions. After the desired aging times, 350 μL of the reaction mixture was sprayed into liquid isopentane at −150 to −160 °C. The resulting snow was collected in a glass funnel immersed in the cold isopentane and packed into the bottom of a 4 mm o.d. quartz EPR tube attached to the bottom of the funnel with silicon tubing. The NO concentrations delivered to the protein samples were quantified by rapid-mixing the same drive syringe-loaded solution of NO with 1–5 mM FeIIEDTA in place of the protein and collecting a 350 μL, 1 s sprayed and frozen sample as described for the protein samples. The S = 3/2 EPR signal of the resulting FeEDTA–NO was quantified by comparison to that of an FeEDTA–NO sample prepared under 1 atm of NO and quantified as described above. The packing factor was determined as the ratio of the peak-to-peak intensity of the S = 5/2 EPR signal38 of a separately sprayed and packed D. vulgaris ferric Rd solution of known concentration (determined using ε490nm = 8800 M–1 cm–1)35 to that of the signal from the same Rd sample in which the snow had been thawed and refrozen in liquid N2. The packing factor was determined to be 0.7, and the RFQ EPR spin concentration was corrected by this packing factor.
RFQ Mössbauer samples were prepared using the drive-syringe loading and 1:1 (v/v) mixing conditions described above except ∼1 mM Tm FDPred solutions at room temperature were rapid-mixed with either ∼3 mM NO solutions in buffer at 4 °C or, for unreacted samples, deoxygenated buffer at 4 °C. (The use of PROLI-NONOate to achieve higher NO concentrations proved to be impractical for our RFQ apparatus.) Immediately before loading the cold NO solution, its drive syringe and load line were cooled by flushing three times with 4 °C deoxygenated buffer. After the desired aging times, 350 μL of the reaction mixture was sprayed into a 50 mL Falcon tube (Fisher Scientific) containing ∼40 mL of liquid ethane at −160 to −170 °C. Ethane was removed from the frozen sample by decanting the liquid followed by evacuation of the headspace with the tube immersed in a dry ice/methanol bath.39 NOTE: ethane is highly flammable. Do not expose liquid ethane to an open flame and perform all manipulations in a well-ventilated area. The resulting snow was transferred and packed with a liquid-N2 cooled spatula to a liquid-N2 cooled RFQ Mössbauer cup. All of the reported quench times are a sum of the aging time (minimum ∼5 ms) plus an estimated 15 ms freezing time.40 All RFQ EPR and Mössbauer samples were kept at liquid-N2 temperature in a storage Dewar until spectral data collection.
EPR and Mössbauer Spectroscopies
EPR spectra were collected on a Bruker ESP 300E X-band spectrometer equipped with a helium continuous flow cryostat model ESR 900 or 910 (Oxford Instruments, Inc.). Standard parameters used for spectral collection were as follows: modulation frequency, 100 kHz; modulation amplitude, 10.5 G; conversion time, 81.9 ms; time constant, 5.1 ms. Microwave power and temperature were adjusted to collect spectra at nonsaturating conditions. Values for these latter parameters are listed in the figure captions. EPR signals were quantified by relative to a 1 mM CuIIEDTA standard in 10% glycerol. The CuII concentration was quantified by inductively coupled plasma mass spectrometry. Species concentrations were determined with the software SpinCount developed by M. P. Hendrich. 57Fe Mössbauer spectra were recorded with two spectrometers using Janis Research dewars. Isomer shifts are reported relative to Fe metal at 298 K. The simulations of EPR and Mössbauer spectra were calculated with least-squares fitting using the program SpinCount and the standard spin Hamiltonian:
For the simulations of two interacting
metal systems, the spin Hamiltonian is expanded to include terms for
each site,  ,
,  , the exchange
interaction,
  , and the standard dipole–dipole
interaction.41
Results and Discussion
Throughout this narrative, unless otherwise noted, FDP refers specifically to Tm FDP.
Reduction of FDPox
For reactions with NO, FDPox (FMNox–FeIIIFeIII) was reduced anaerobically with a small molar excess of NADH and catalytic concentrations of the native redox partner proteins, NROR and Rd.13,19 Complete reduction under these (anaerobic) conditions took several hours. FMNox, the anionic FMN semiquinone (FMNsq), and the fully reduced FMN (FMNH2) are all redox accessible in FDPs.15,33,42 These three FMN species dominate the UV–vis absorption spectra, as shown in Figure 1A. The FeIIIFeIII/FeIIFeIII and FeIIFeIII/FeIIFeII couples in FDPs have higher reduction potentials than those of both the FMNox/FMNsq and FMNsq/FMNH2 redox couples.33 Thus, anaerobic reduction of FDPox with 2.2 mol equiv of NADH per diiron site in the presence of catalytic NROR/Rd resulted in formation of the FDPsq (FMNsq–FeIIFeII) within the time of manual mixing followed by a slower reduction to FDPred (FMNred–FeIIFeII). However, as shown in Figure 1B, when Rd is equimolar with FDP, rather than a catalytic concentration, reduction of FDPox to FDPred occurred within the time of manual mixing with no detectable accumulation of FDPsq. This latter behavior verifies the catalytic competence of the redox pathway.13 This differing reducing behavior of catalytic versus stoichiometric Rd is analogous to that observed for M. thermoacetica FDP and its physiological redox partner protein.43 The catalytic concentrations used here avoided spectroscopic interference by the redox partner proteins.
Figure 1.
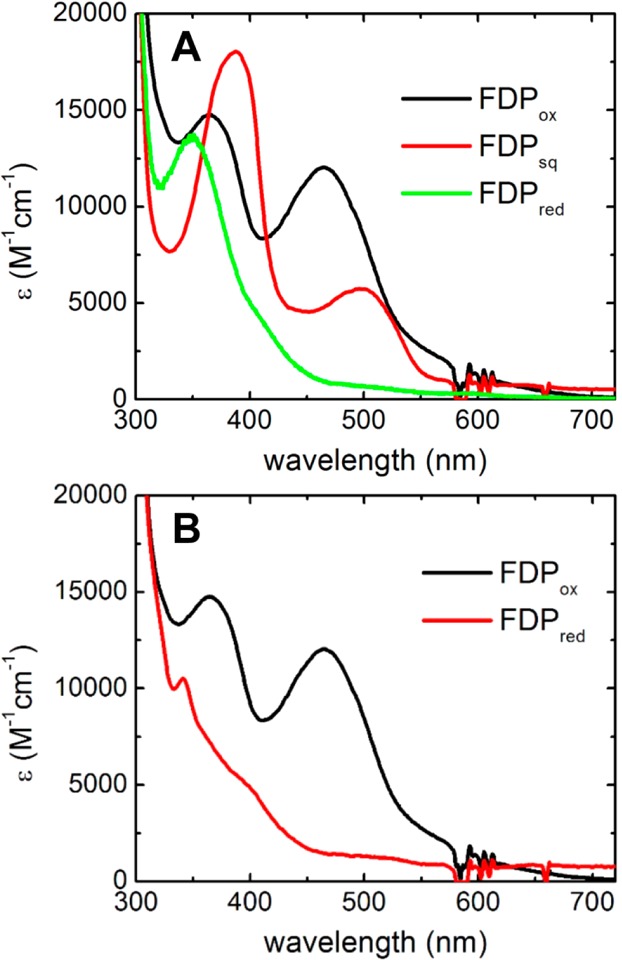
UV–vis absorption spectra of (A) before (FDPox), <1 min after (FDPsq), and several hours after (FDPred) addition of 140 μM NADH to a solution containing 5 μM Rd, 500 nM NROR, and 60 μM FDPox and (B) before (FDPox) and immediately after (FDPred) addition of 140 μM NADH to a solution of 50 μM Rd, 500 nM NROR, and 50 μM FDPox. The listed concentrations are those of the complete reaction mixtures in anaerobic buffer.
The Mössbauer spectra in Figure 2 confirm the diiron redox states in FDPox and FDPred. The 4.2 K spectrum of FDPox (Figure 2B) showed a single sharp quadrupole doublet with parameters listed in Table 1. The parameters are indicative of high-spin ferric iron. The sharp doublet, as opposed to a broad paramagnetic spectrum, is attributed to antiferromagnetic exchange coupling of the two S = 5/2 FeIII ions at the active site to give a S = 0 state lowest in energy. Figure 2A shows the Mössbauer spectrum of FDPred. All of the iron in the FDPox converted into a single new quadrupole doublet with parameters given in Table 1. The parameters of the doublet are indicative of high-spin ferrous iron. The Mössbauer parameters of both FDPox and FDPred are similar to those of the diiron sites of hemerythrin and ribonucleotide reductase for the corresponding oxidation states.44,45 The FDPox Mössbauer spectrum is similar to that previously reported for the as-isolated FDP from M. thermoacetica.43 The single sharp doublets in the spectra of both FDPox and FDPred (Γ = 0.31 mm/s) are indicative of equivalent electronic environments for the individual iron centers in the diiron site, which is consistent with the structure showing that each iron has the same type and number of N- and O-donor ligands (Scheme 1).
Figure 2.
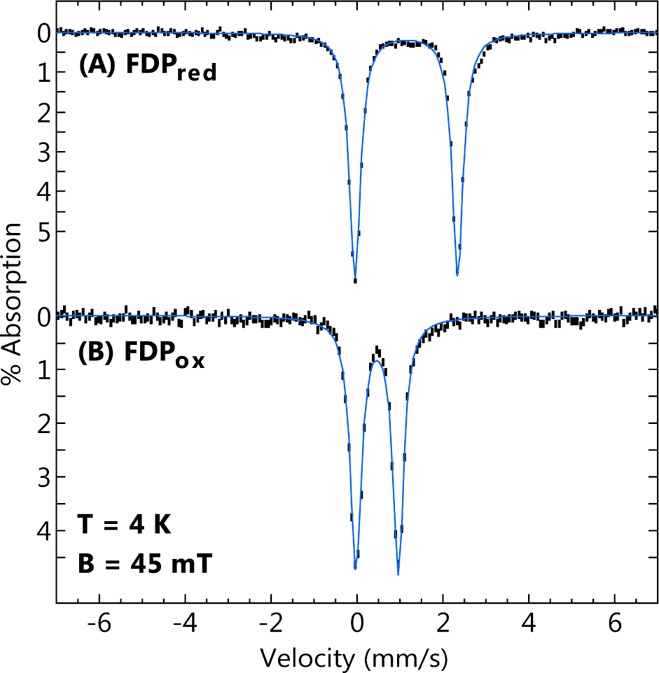
Mössbauer spectra (black bars) of (A) FDPred and (B) FDPox recorded at 4.2 K in a magnetic field of 45 mT applied parallel to the γ-ray direction. The blue lines are Lorentzian fits with parameters listed in Table 1. The samples were prepared as described in Experimental Procedures.
Table 1. Mössbauer Parameters of FDP Iron Species Observed in This Work.
| species | δ (mm/s) | ΔEq (mm/s) |
|---|---|---|
| FDPox (FeIIIFeIII) | 0.47 | 0.99 |
| FDPred (FeIIFeII) | 1.15 | 2.39 |
| FeII{FeNO}7 | 1.12, 0.67 | 1.98, 1.53 |
| H, [{FeNO}7]2 | 0.71 | 1.85 |
| L, [{FeNO}7]2 | 0.70 | 1.55 |
| isolated {FeNO}7 | ∼0.65 | ∼-1.9 |
Rapid Kinetics of FDPred Reaction with Substoichiometric NO
The stopped-flow UV–vis absorption spectral time course for the reaction of FDPred with substoichiometric NO is shown in Figure 3. The spectral absorption changes are essentially complete within ∼100 ms after mixing (Figure 3A). UV–vis absorption difference spectra were obtained by subtracting the FDPred spectrum from the spectra following mixing with NO. The 100 ms difference spectrum (Figure 3A, inset) has absorption features at 418 (ε418nm = 1500 M–1 cm–1 per NO), 456 (ε456nm = 1450 M–1 cm–1) and 633 nm (ε633nm = 400 M–1 cm–1). The extinction coefficients on the basis of the substoichiometric NO concentration are consistent with complete formation of one {FeNO}7 per diiron site within the mixing dead time. This absorption difference spectrum is very similar to the absolute spectrum obtained when less than or equal to 1 equiv of NO was manually mixed with the deflavinated diferrous FDP.16 Only very minor absorption increases centered at ∼390 and 500 nm occurred between 47 ms and 100 s (Figure 3B). Difference spectra (Figure S1, Supporting Information) indicate that these slower absorption increases are due to accumulation of a very minor amount of anionic FMNsq. No spectral features of FMNox developed on the 100 s time scale with substoichiometric NO.
Figure 3.
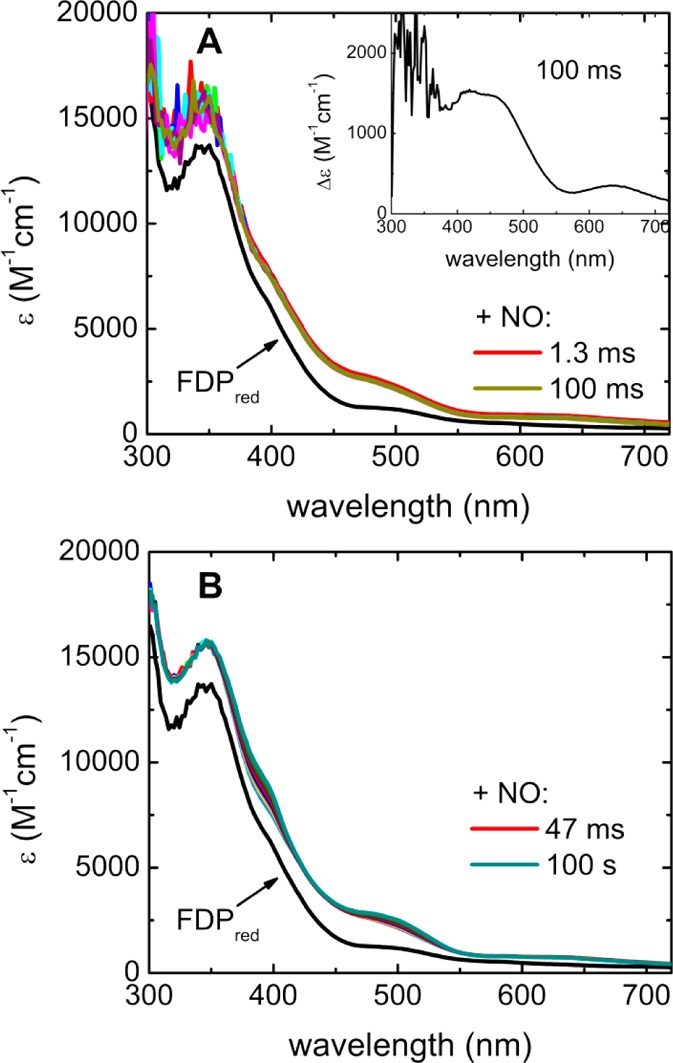
(A) 100 ms and (B) 100 s stopped-flow UV–vis absorption spectral time courses for reactions of FDPred with ∼0.8 equiv of NO per diiron site at 3 °C. The spectra indicated as FDPred were obtained upon stopped-flow mixing FDPred solution with deoxygenated buffer in place of the NO solution. Inset in panel A shows the difference absorption spectrum obtained by subtracting the FDPred spectrum from the 100 ms spectrum. Concentrations after mixing: 880 μM FDPred and 680 μM NO. The difference extinction axis in the inset is per molar of added NO.
An RFQ EPR sample of FDPred obtained 200 ms after mixing with substoichiometric NO is shown in Figure 4. A minor S = 3/2 signal (not shown) accounted for less than 2% of the diiron sites. The EPR spectrum was dominated by an S = 1/2 signal (g = 2.39, 1.97, 1.70) that was essentially identical to that previously assigned to FeII{FeNO}7 resulting from manual mixing of FDPred with less than or equal to 1 equiv of NO.19 The sharp signal at g = 2 was attributed to a small amount of FMNsq, and the signal at g = 1.97 was attributed to a small amount of free NO. The g = 2.10 signal showed variable intensities relative to the FeII{FeNO}7 signal among several samples and has also been reported previously in manually mixed samples of the same reaction.19 This signal was attributed to a magnetic dipolar interaction between a small portion of S = 1/2 FeII{FeNO}7 (using the g values listed above) and S = 1/2 FMNsq (g = 2.0) at a distance of 4.5 Å (a dipolar term was added to the standard spin Hamiltonian41). The simulated concentration of this interacting system was never more than 10% of that of the noninteracting FeII{FeNO}7 component. The S = 1/2 concentration in the RFQ sample of Figure 4 is in reasonable agreement with the added NO concentration (110 μM S = 1/2 vs 130 μM added NO). The combination of the stopped-flow UV–vis absorption spectral time course in Figure 3 and the RFQ EPR spectrum in Figure 4 shows that reaction of FDPred with substoichiometric NO results in rapid and nearly quantitative formation of FeII{FeNO}7, which is stable for at least several minutes. Since stopped-flow time courses with substoichiometric NO showed no significant FMNH2 oxidation, the substoichiometric NO-reacted FDP species can be confidently formulated as FMNH2–FeII{FeNO}7.
Figure 4.
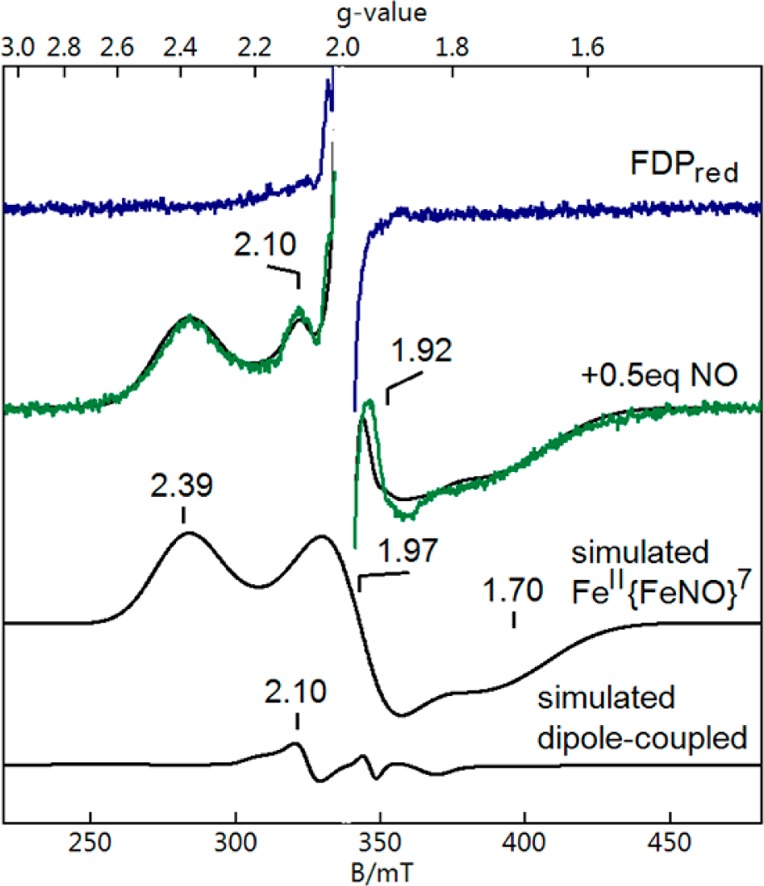
RFQ EPR spectra of FDPred (blue spectrum) and 200 ms after mixing FDPred with ∼0.5 equiv of NO at 4 °C (green spectrum). Simulated spectra are shown as black traces. The black trace overlaying the green spectrum is the sum of “simulated FeII{FeNO}7” and “simulated dipole-coupled” between a minor portion (<3%) of FeII{FeNO}7 and FMNsq at a distance of 4.5 Å. The g = 1.92 indicates a small amount of free NO. A radical species (<1%) at g = 2.0 attributed to FMNsq has been clipped in both experimental spectra. Conditions immediately after mixing: 250 μM FDPred and 130 μM NO in 50 mM MOPS, pH 7.3. Instrumental parameters: microwaves, 9.645 GHz, 0.26 mW; temperature, 4 K.
Mössbauer Spectra of FDPred Titrated with NO
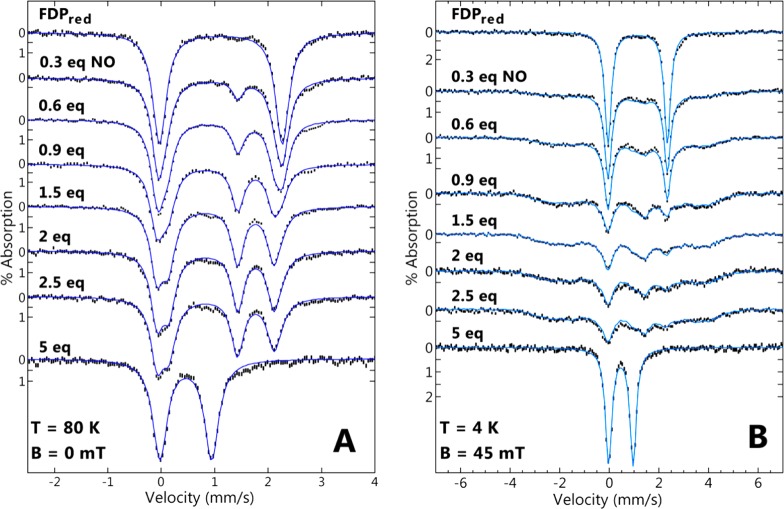
Mössbauer spectra were obtained for FDPred manually titrated with NONOate stock solutions. To ensure complete reaction, the NONOate-titrated samples were incubated anaerobically for ∼5 min at room temperature before freezing. The Mössbauer spectra for these samples were recorded at temperatures of 80 K (Figure 5A, no magnetic field) and 4 K (Figure 5B, magnetic field of 45 mT). Table 1 lists the parameters for each species, and Table 2 lists the corresponding percent compositions of iron species. Prior to addition of NO, the spectra at both temperatures showed a single doublet from the diferrous state of FDPred. At 80 K, titration with NO up to 1.5 equiv showed that the area of the doublet from FDPred diminished concomitant with the development of two new doublets with equal areas (δ = 1.12 mm/s, ΔEQ = 1.98 mm/s; δ = 0.67 mm/s, ΔEQ = 1.53 mm/s). The new doublets are assigned to the FeII and {FeNO}7 centers, respectively, of the FeII{FeNO}7 complex. The values of δ = 0.67 mm/s and ΔEQ = 1.53 mm/s unambiguously identify an [FeNO]7 complex.26−29 The relative contributions of each doublet are shown in Figure S2 (Supporting Information) for a selection of three spectra from Figure 5A. The sums of all spectral species at the amounts listed in Table 2 are the theoretical lines overlaid on the spectra. At 4.2 K (Figure 5B), the FeII{FeNO}7 complex appeared as a broad paramagnetic pattern as expected for a S = 1/2 species. This broad spectrum is dependent on the magnetic properties of both iron ions and is not straightforward to simulate.31 On the basis of the high-temperature spectra, this complex was 90% of the iron in the 1.5 equiv sample. A minor amount (5%) of the FDPred doublet was subtracted from the 1.5 equiv spectrum to obtain a “clean” spectrum of the FeII{FeNO}7 complex at low temperature. The sum of this “clean” spectrum and the doublets of the other species at the same percentages as that of the high-temperature data produced the fits shown in Figure 5B. The isomer shifts, quadrupole splittings, and paramagnetic broadening of the S = 1/2 species are reminiscent of that for the S = 1/2 FeII{FeNO}7 complex of hemerythrin.27,31 From 1.5 to 2.5 equiv of NO, the proportions of diferrous (∼8%) and FeII{FeNO}7 (∼87%) remained relatively stable. The addition of 5 equiv of NO resulted in complete conversion to an antiferromagnetically coupled diferric spectrum that is indistinguishable from that of FDPox.
Figure 5.
57Fe Mössbauer spectra (vertical bars) of 500 μM FDPred titrated with NO. Spectra were recorded at (A) 80 K in zero field or (B) 4 K in a magnetic field of 45 mT applied parallel to the γ-ray direction. The NO molar equivalents added per FDP active site are as listed. The blue traces overlaying the experimental spectra are the resultant simulation sums of the components using the species of Table 1 in the amounts of Table 2.
Table 2. Percent Composition of Iron Complexes from NO Titration of FDPred.
| percent
composition |
||||
|---|---|---|---|---|
| NO added per active site | FeIIFeII | FeII{FeNO}7 | FeIIIFeIII | L |
| 0 | 100 | 0 | 0 | 0 |
| 0.3 | 73 | 27 | 0 | 0 |
| 0.6 | 51 | 49 | 0 | 0 |
| 0.9 | 22 | 74 | 0 | 4 |
| 1.5 | 5 | 90 | 0 | 5 |
| 2.0 | 10 | 85 | 0 | 5 |
| 2.5 | 7 | 87 | 0 | 6 |
| 5 | 0 | 0 | 100 | 0 |
EPR samples of FDPred plus 0.3, 0.6, and 0.9 equiv of NO were prepared at the same time and from the same protein material as the Mössbauer samples of Figure 5. The EPR spectra of these three samples (Figure S3, Supporting Information) showed that the amount of the S = 1/2 FeII{FeNO}7 complex quantitatively agreed with the proportion of the paramagnetically broadened component in the Mössbauer spectra of Figure 5, indicating that this broadened feature in the Mössbauer spectra originated from the S = 1/2 FeII{FeNO}7 complex. These spectral titrations confirm that the FeIIFeII site in FDPred reacts with substoichiometric NO to form FeII{FeNO}7. The Mössbauer data also show that the FeIIFeII site can be oxidized quantitatively to the diferric (FeIIIFeIII) state by NO only slightly in excess (5 equiv) of the hypothetical minimum needed to remove four electrons from the FDPred active site. This end product has identical isomer shift and quadrupole splitting parameters as FDPox. Iron species other than those listed in Table 2 were not detected in significant amounts during this titration. The minor species L, listed in Table 2, is discussed below in the context of the RFQ experiments. These RFQ results also show that, with ∼3 equiv of NO per diferrous site (i.e., between the 2.5 and 5 equiv listed in Table 2), at 2 min reaction time, a minor portion of the diferric species characteristic of FDPox appears.
Presteady-State Reactions of FDPred with Excess NO
Stopped-flow mixing of FDPred with excess NO resulted in the UV–vis absorption spectral time courses shown in Figure 6. A rapid phase that was complete within 130 ms (Figure 6A) preceded a much slower phase that occurred over the course of 120 s (panel B). The inset to Figure 6A shows the difference spectra obtained by subtracting the FDPred absorption spectrum from the 130 ms time course spectra. These difference spectra clearly show the development of the {FeNO}7 species. On the basis of comparison with the substoichiometric NO difference spectrum in Figure 3A, the shoulder at ∼418 nm in the 1.3 ms difference spectrum in Figure 6A indicates formation of FeII{FeNO}7 within the mixing dead time. Over the course of 130 ms, the 418 nm shoulder became less prominent, and a spectrum with absorptions centered at 340, 453, and 630 nm developed. The absorption features and extinction coefficient of the 130 ms difference spectrum in Figure 6A (ε453nm/2Fe ∼ 2000 M–1 cm–1) indicates substantial formation of additional {FeNO}7 beyond FeII{FeNO}7 and as will become clear from the Mössbauer results described below can be assigned to formation of a diferrous-dinitrosyl ([{FeNO}7]2) complex. The 130 ms time course with excess NO can thus be confidently ascribed to successive formation of FeII{FeNO}7 and [{FeNO}7]2 from the FeIIFeII site in FDPred. Single value decomposition and global analysis of the 130 ms spectral time course (Supporting Information, Figure S4) reinforce this interpretation.
Figure 6.
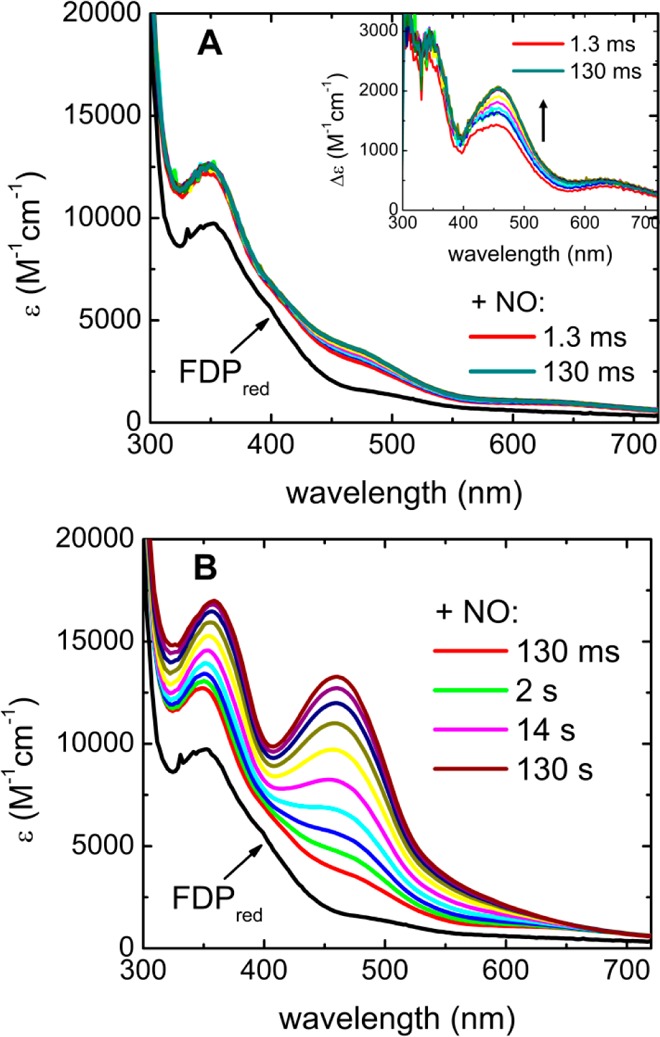
(A) 130 ms and (B) 130 s stopped-flow UV–vis absorption spectral time courses for reactions of FDPred (70 μM) with excess NO (900 μM) at 3 °C. The spectrum indicated as FDPred was obtained upon stopped-flow mixing the FDPred solution with deoxygenated buffer in place of the NO solution. Panel A spectra were collected in 13 ms intervals after the 1.3 ms spectrum. Inset of panel A shows difference absorption spectra obtained by subtracting the FDPred spectrum from the time course spectra (color-coded as in the main panel). Panel B spectra after mixing with NO were collected in log scale intervals.
The slower portion of the stopped-flow spectral time course shown in Figure 6B was dominated by the intense absorption features of FMNox, which accumulated quantitatively over ∼120 s. Spectral features attributable to FMNsq were not apparent. Comparison of the time course in Figure 6A with that in Figure 6B shows that the majority of the diiron sites formed [{FeNO}7]2 prior to any significant oxidation of FMNH2. The quantitative oxidation of FMNH2 to FMNox in the presence of excess NO is in stark contrast to the lack of any detectable FMNox formation in the stopped-flow spectral time course with substoichiometric NO (Figure 3). The stopped-flow spectral time courses in Figures 3 and 6 thus indicate that the successive formation of FeII{FeNO}7 and [{FeNO}7]2 precedes FMNH2 oxidation.
An RFQ EPR time course for FDPred reacted with a similarly large excess of NO as for the stopped-flow experiments (Figure S5, Supporting Information) showed a low intensity S = 1/2 FeII{FeNO}7 signal at 130 ms (∼0.2 spins/2Fe), which decreased at longer quench times. A signal near g ∼ 4 assigned to S = 3/2 {FeNO}7 and accounting for ∼10% of the total iron did not appreciably vary with quench time and is attributed to a small portion of mononuclear iron sites. The majority of the diiron sites were thus EPR silent under RFQ conditions analogous to those used for the stopped-flow spectra in Figure 6.
Figure S6 (Supporting Information) shows an analogous stopped-flow absorption spectral time course for the Tm diferrous deflavo-FDP reaction with excess NO. The time scales and spectral features of diferrous dinitrosyl formation and decay in Figure S6 (Supporting Information) are very similar to those of the formation of diferrous dinitrosyl and FMNH2 oxidation, respectively, in the FDPred shown in Figure 6. Notably the deflavo-FDP spectral time courses did not require subtraction of any FMN spectral changes. As note previously,16 only a portion of the diferrous sites turn over in the deflavo-FDP, which is why the diferrous dinitrosyl absorption features in Figure S6 (Supporting Information) do not decay completely. However, as noted previously, the portion of the diferrous deflavo-FDP sites that did turn over generated N2O.16
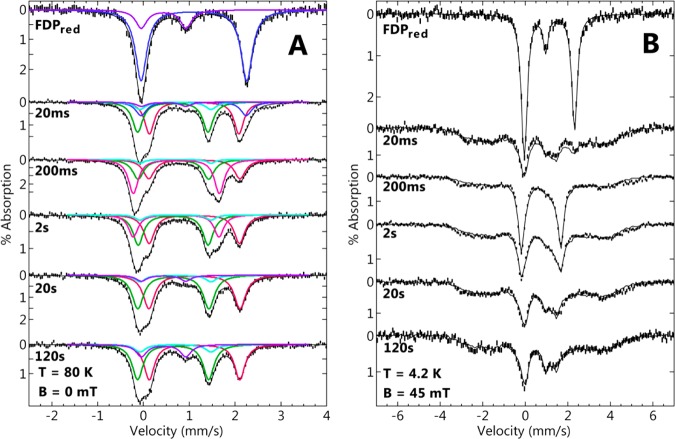
The RFQ 57Fe Mössbauer spectral time course for reaction of FDPred with a ∼3 equiv of NO per diiron site is shown in Figure 7, for spectra recorded at 80 K (A) and 4 K (B). These spectra provided definitive evidence for the formation of a transient S = 0 [{FeNO}7]2 complex. The spectra labeled FDPred in Figure 7 were obtained from a sample prepared by RFQ mixing FDPred with NO-free buffer. These spectra showed that 20% of the diiron sites were in the diferric state (FDPox) with the remainder present as FDPred. The diferric species was not present in any of the subsequent samples mixed with NO until the 120 s time point and does not appear in the FDPred spectrum of Figure 2. Therefore, the diferric species in the FDPred spectrum of Figure 7 was presumed to arise from O2 contamination.
Figure 7.
57Fe Mössbauer spectra (vertical bars) for RFQ of FDPred mixed with ∼3 equiv of NO per active site at ∼15 °C and quenched at the times listed near each spectrum. The spectra were recorded at (A) 80 K in zero magnetic field or (B) 4 K in a magnetic field of 45 mT applied parallel to the γ-ray direction. The colored traces are simulations of species assigned to FeIIFeII (blue), FeII (green) {FeNO}7 (red) of FeII{FeNO}7, L (light blue), H (pink), and diferric (purple), respectively, using the parameters listed in Table 1 and percent compositions listed in Table 3; black traces are the sums of the simulated species spectra. Concentrations immediately after mixing: 500 μM FDPred and 1500 μM NO.
The quench times subsequent to mixing with NO are indicated in Figure 7. The spectra showed clear evidence four distinct species from the enzymatic active site: FDPred, FDPox, S = 1/2 FeII{FeNO}7, and a transient species H. In addition, two minority species are present in variable amount in the samples of the time course: isolated S = 3/2 {FeNO}7, and species L. The two minority species in total account for less than 10% of the iron in any of the time points. The parameters for each complex are listed in Table 1, and their corresponding percentages of the total iron at the various quench times are listed in Table 3. All of the 80 K spectra showed a species having two doublets of equal intensity (red and green Lorentzian simulations of Figure 7A). These two doublets have parameters identical to those assigned to the FeII{FeNO}7 complex obtained in the NO titration (Figure 4 and Table 1). Similarly, all the 4 K spectra (Figure 7B) showed the same broad paramagnetic pattern attributable to the S = 1/2 FeII{FeNO}7 complex, at an area equal to that of the corresponding red and green simulated doublets in the 80 K spectra. The FeII{FeNO}7 complex was present at the earliest time point (20 ms) and constituted the majority of the iron throughout the time course. The fits (black lines) in Figure 7B are the sum of the FeII{FeNO}7 spectrum and the other doublets discussed below. The spectral area of each species comprising the summation in each of the 4.2 K spectra were constrained to be equal to the areas of the corresponding species of the 80 K spectra.
Table 3. RFQ of FDPred with ∼3 equiv NO per Diiron Site.
The parameters for two other doublets, labeled H (for high reactivity) and L (for low reactivity), are listed in Table 1. Species H was observed only for reaction times ranging from 0.2 to 2 s, whereas L was observed as a minority species (∼5% of total iron) over the entire time course. By 200 ms, no diferrous remained, and H was present at 41% of the total iron. By 2 s, H had decreased to 28% total iron and was accompanied by a proportional increase in FeII{FeNO}7. At and after 20 s, the majority of the iron was FeII{FeNO}7. At 2 min, the amount of FeII{FeNO}7 decreased slightly, owing to the oxidation of iron, as demonstrated by the presence of a diferric species attributable to FDPox. The presence of a relatively small proportion of FDPox compared to that of the NO titration (Figure 4) can be attributed to the modest excess of NO in these RFQ samples.
As indicated
by the simulations of Figure 7, species H showed a single quadrupole doublet. The
isomer shift and quadrupole splitting of species H (Table 1) clearly identify all the iron of this species
as high-spin S = 3/2 {FeNO}7. The absence of a paramagnetic pattern could be attributed
to either an exchange interaction between the iron ions or fast electronic
relaxation. Mössbauer spectra were recorded in high magnetic
field (7.5 T) to resolve this ambiguity and further characterize the
molecular species. The red-colored spectrum in Figure 8 is of the same 200 ms sample used to obtain the low-field
spectrum in Figure 7. The blue-colored spectrum
in Figure 8 is of the FDPred and
2 equiv of NO sample from the titration series of Figure 5 and is displayed at 55% of the area of the 200
ms spectrum. The 2 equiv of NO titration sample was chosen for its
relatively high proportion of the FeII{FeNO}7 species. The other species identified by simulation in Figure 8A (black line) is from an isolated S = 3/2 {FeNO}7 species, which accounts
for 6% of the total iron in the sample. The parameters (see figure
caption) for this minority species are typical of a mononuclear S = 3/2 {FeNO}7 center26 but cannot be accurately determined due to the
low amount and is virtually imperceptible in the low-field spectra.
This minor mononuclear species could be due to NO reactions with either
iron-deficient active sites or adventitious iron. The green-colored
spectrum of Figure 8B is the difference of
the three spectra of Figure 8A (red minus blue
minus black). The simulation on the difference spectrum in Figure 8B (black line) is for a diamagnetic species (S = 0) using the low-field parameters of H,
which accounted for 39% of the total iron in the sample, and in agreement
with the amount of species H determined at low field.
The Mössbauer parameters and magnetic behavior unambiguously
identify species H as an antiferromagnetic exchange-coupled
pair of equivalent S = 3/2 {FeNO}7 units, [{FeNO}7]2.28,32 The variation of the exchange interaction energy, J, in simulations of two identical exchange-coupled S = 3/2 {FeNO}7 centers (assuming D = 14 cm–126,28,31 indicated J ≥ 40 cm–1 ( ). Simulations using values of J less than 40 cm–1 resulted in a shift
of the outer
lines perceptibly inward of the data. Species L was a
minor component in both the RFQ and titration samples and persisted
to significantly longer reaction times (∼30 min). The similarity
of the Mössbauer parameters of L and H suggests that L is also a S = 0 [{FeNO}7]2 species but with low or no corresponding catalytic
activity. As was the case for the FDPox and FDPred Mössbauer spectra, the sharp line width of species H (Γ = 0.30 mm/s) is consistent with the individual
{FeNO}7 centers having the same type and number of N- and
O-donor ligands, including a single NO.
Figure 8.
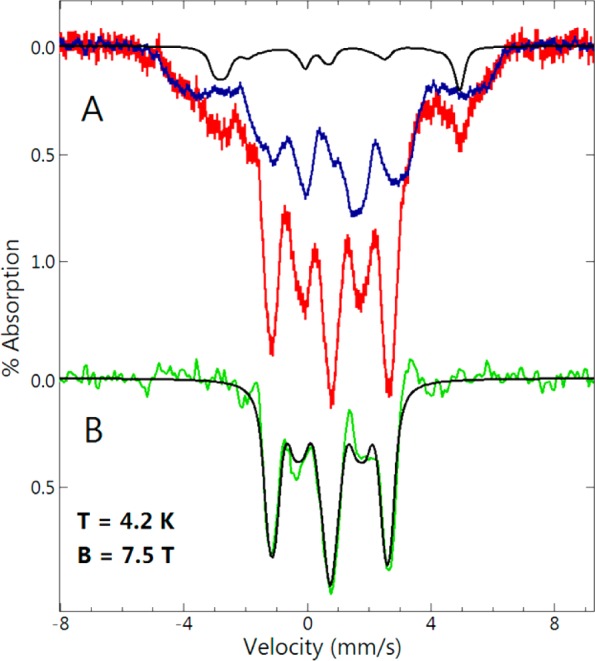
(A) 57Fe Mössbauer spectra (temperature, 4 K; magnetic field, 7.5 T) of (red bars) of RFQ mixed FDPred with ∼3 equiv of NO per active site at ∼15 °C and quenched at 200 ms (the same 200 ms sample used for Figure 7), and (blue bars) FDPred + 2 equiv of NO from the titration series of Figure 5, displayed at 59% of the area of the red spectrum. The black line in (A) is a simulation for S = 3/2, D = 15 cm–1, E/D = 0.02, Aiso = −25 T, δ = 0.65 mm/s, ΔEq = −1.9 mm/s, η = 0.4, 6% of area of red spectrum. (B) The green line is the difference of the three spectra in A (red minus blue minus black). The black line is a simulation for S = 0, δ = 0.77 mm/s, ΔEq = 1.85 mm/s, η = 1, 37% of area of red spectrum.
Comparison with Steady-State Parameters
Previous attempts to obtain Michaelis–Menten parameters for the Tm FDP NOR activity16 were hampered by its unusually high Km and the difficulty of achieving milllimolar NO concentrations in the assay solutions. This barrier was overcome by using PROLI-NONOate stock solutions for NO delivery and the activity assay conditions described in the Supporting Information. The Michaelis–Menten fit to the steady-state activity data (Figure S7, Supporting Information) gave Km = 1000 μM and kcat = 0.6 s–1. The Mössbauer titration data in Table 2, the RFQ EPR spin quantification from Figure 4, and previously reported EPR spin quantifications19 all showed nearly quantitative FeII{FeNO}7 formation upon reaction of FDPred with less than or equal to 1 equiv of NO per diiron site. As described above, an RFQ EPR time course (Figure S5, Supporting Information) showed transient minor amounts of FeII{FeNO}7 even at 1500 μM NO (>10 equiv per diiron site). These quantifications indicate that the first NO binds to the diiron site with much higher affinity than does the second. The stopped-flow time courses with 0.8 equiv of NO per diiron site in Figure 3 show formation of a stable FeII{FeNO}7 without significant FMNH2 oxidation, the latter of which occurred only with excess NO (Figure 6). Therefore, the steady-state Km likely reflects the much lower affinity for the second NO.
Kinetics and Mechanism of the FDP NOR Reaction
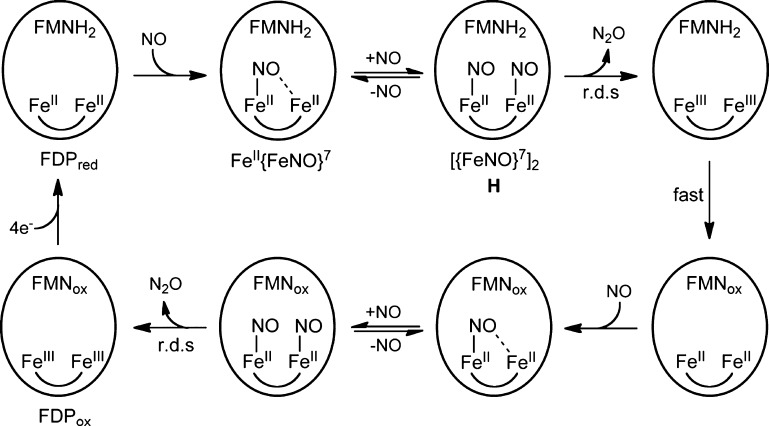
The results described here together with those from previously reported studies16,19 lead us to the mechanistic conclusions summarized in Scheme 3. Starting from FDPred (FMNH2–FeIIFeII), the first NO reacts relatively rapidly (submillisecond) and with high affinity, resulting in FMNH2–FeII{FeNO}7 (S = 1/2 diiron site). This form is stable at less than or equal to 1 equiv of NO. With excess NO, the FMNH2–FeII{FeNO}7 reacts with a second NO over the course of 100 ms to form an FMNH2–[{FeNO}7]2 intermediate (S = 0, diiron site, Mössbauer species H). In the rate-limiting step for the first turnover, the [{FeNO}7]2 converts to diferric over the course of ∼2 min, leading to a species we formulate as FMNH2–FeIIIFeIII. This species does not accumulate due to rapid internal electron transfer, leading to FMNox–FeIIFeII, as manifested by FMNH2 oxidation in the UV–vis absorption spectral time course with excess NO. This reaction sequence completes the first turnover of 2 NO → N2O. Depending on the level of excess NO, the diferrous site in FMNox–FeIIFeII then reacts with either one or two more NO analogously to that for the first turnover, ultimately leading to FDPox at a sufficiently large excess (>4 equiv) of NO. The reaccumulation of FeII{FeNO}7 in the RFQ Mössbauer spectral time course (Table 3) with ∼3 equiv of NO and its accumulation in the manual NO titration with less than 4 eq NO (Table 2) are consistent with this scenario. Scheme 3 together with the high Km for binding the second NO explains the less than quantitative accumulation of the [{FeNO}7]2 species H and diferric in the Mössbauer RFQ time course with 3 equiv of NO (Table 3).
Scheme 3.
The results reflected in Scheme 3 can be used to distinguish among the proposed mechanisms in Scheme 2. The sr mechanism requires a proximal FMNH2 in order to produce N2O. This requirement for proximal FMNH2 implies that the FMNox–FeIIFeII formed resulting from the first turnover could not proceed beyond either FMNox–FeII{FeNO}7 or, at sufficiently large excesses of NO, FMNox–[{FeNO}7]2. Therefore, in the absence of exogenous reducing equivalents, the sr mechanism would result in formation of a maximum of one N2O per four-electron reduced active site and could not attain the four-electron oxidized state, FDPox, even with excess NO. However, our results show that, at 5 equiv of NO, the active site of FDPred undergoes quantitative four-electron oxidation to FMNox–FeIIIFeIII (FDPox). Production of two N2O per FDPred active site from this reaction is also supported by previous Fourier transform IR data.16 The “inherent” ability of the [{FeNO}7]2 (S = 0) site to turn over 2NO → N2O in FDP is also supported by previously reported16 results on a deflavo-FDP. A comparison of the stopped-flow UV–vis absorption spectral time courses in Figure 6 and Figure S6 (Supporting Information) show that the first turnover of the diferrous-dinitrosyl in FDP occurs on the same time scale as that in the deflavo-FDP. Thus, these cumulative results do not support the sr mechanism. The hyp mechanism in Scheme 2 does not include [{FeNO}7]2 and is therefore also inconsistent with our results. However, the cumulative results are fully consistent with the diFeNO mechanism, in which [{FeNO}7]2 converts “spontaneously” to FeIIIFeIII and N2O in the rate-limiting step for both turnovers (r.d.s. in Scheme 3).
N–N Bond Formation and N–O Bond Cleavage
N2O formation from two NO requires N–N bond formation and an N–O bond cleavage. While the timing and sequence of these bond formation and cleavage events in FDP remain mysterious, our results suggest some restrictions on these processes in FDP. First and foremost is the apparent requirement for an antiferromagnetically coupled [{FeNO}7]2 species. The lower limit determined for the antiferromagnetic coupling in this [{FeNO}7]2 species, J ≥ 40 cm–1, is consistent with retention of the 1,3-bridging carboxylate together with either a hydroxo or oxo bridge, as shown in Scheme 1.46 This bridging motif would place the two {FeNO}7 centers in close proximity, thereby facilitating N–N bond formation. Our results do not rule out the possibility that N–N bond formation from [{FeNO}7]2 involves a diferric-hyponitrite intermediate. However, at least under our conditions, such a species would have to be a nonaccumulating transient species between [{FeNO}7]2 and FeIIIFeIII and N2O. Formation of N2O from [{FeNO}7]2 presumably requires cleavage of only one of the two substrate N–O bonds. Therefore, it might seem that some asymmetry must arise in the two {FeNO}7 centers despite the very similar coordination spheres around Fe1 and Fe2 (Scheme 1) and the indistinguishable Mossbauer parameters of the two {FeNO}7 centers. On the other hand, reduction of a symmetrical diruthenium dinitrosyl complex has been reported to form a diruthenium complex with a symmetrically N–N-bridging formally hyponitrito ligand, which upon addition of a proton source, yielded N2O.47 We are unaware of any verified synthetic nonheme iron hyponitrito complexes.
While the diferrous mononitrosyl (FeII{FeNO}7) must be inherently asymmetrical, it is currently unclear whether the NO selectively binds to the iron proximal or distal to the FMN.13 The N–O stretching frequency is abnormally low in the diferrous mononitrosyl complex of this FDP, implying a potentially “activated” FeIII–NO– character, which was attributed to a semibridging interaction with the other iron, as depicted in Scheme 3.19 The N–O stretching frequencies are not yet known for the magnetically coupled diferrous dinitrosyl (species H) identified in the present study.
Protonation of a substrate oxygen by either a proximal amino acid side chain or solvent (possibly the bridging solvent ligand) is presumably an additional requirement for N–O bond cleavage leading to N2O formation. However, we have recently determined by stopped-flow spectroscopy that the rates of neither formation of the diferrous dinitrosyl nor FMNH2 oxidation with excess NO show an isotope effect after equilibration of the FDPred in D2O (Frederick, R. E.; Kurtz, D. M., Jr., unpublished). This negative result indicates that any proton transfer must occur after the rate-limiting step leading to N2O formation. Therefore, it is tempting to speculate that the rate-limiting process involves N–N bond formation followed by rapid protonation of a transient hyponitrito ligand. In any case, our results indicate that N–N bond formation and N–O bond cleavage originate from what appears to be a structurally and electronically symmetrical antiferromagnetically coupled [{FeNO}7]2 site in FDP. Our preliminary results on FDPs with significantly higher NOR activities and higher second NO binding affinities support this conclusion.
Acknowledgments
This work was supported by the National Institutes of Health (GM040388 to D.M.K., GM077387 to M.P.H., and MBRS/RISE GM060655 to J.D.C.)
Supporting Information Available
Stopped-flow difference absorption spectra, single value decomposition global analysis, RFQ EPR time course with excess NO, diferrous deflavo-FDP and NO spectral time courses, and steady-state NOR activities. This material is available free of charge via the Internet at http://pubs.acs.org.
The authors declare no competing financial interest.
Funding Statement
National Institutes of Health, United States
Supplementary Material
References
- Saraiva L. M.; Vicente J. B.; Teixeira M. Adv. Microb. Physiol. 2004, 49, 77. [DOI] [PubMed] [Google Scholar]
- Vine C. E.; Cole J. A. FEMS Microbiol. Lett. 2011, 325, 99. [DOI] [PubMed] [Google Scholar]
- Kurtz D. M. Jr. Dalton Trans. 2007, 4115. [Google Scholar]
- Rodrigues R.; Vicente J. B.; Felix R.; Oliveira S.; Teixeira M.; Rodrigues-Pousada C. J. Bacteriol. 2006, 188, 2745. [DOI] [PMC free article] [PubMed] [Google Scholar]
- Vicente J. B.; Tran V.; Pinto L.; Teixeira M.; Singh U. Eukaryotic Cell 2012, 11, 1112. [DOI] [PMC free article] [PubMed] [Google Scholar]
- Mills P. C.; Rowley G.; Spiro S.; Hinton J. C. D.; Richardson D. J. Microbiology 2008, 154, 1218. [DOI] [PubMed] [Google Scholar]
- Le Fourn C.; Brasseur G.; Brochier-Armanet C.; Pieulle L.; Brioukhanov A.; Ollivier B.; Dolla A. Environ. Microbiol. 2011, 13, 2132. [DOI] [PubMed] [Google Scholar]
- Thorgersen M. P.; Stirrett K.; Scott R. A.; Adams M. W. W. Proc. Natl. Acad. Sci. U.S.A. 2012, 109, 18547. [DOI] [PMC free article] [PubMed] [Google Scholar]
- Kern M.; Volz J.; Simon J. Environ. Microbiol. 2011, 13, 2478. [DOI] [PubMed] [Google Scholar]
- Hillmann F.; Riebe O.; Fischer R. J.; Mot A.; Caranto J. D.; Kurtz D. M. Jr.; Bahl H. FEBS Lett. 2009, 583, 241. [DOI] [PMC free article] [PubMed] [Google Scholar]
- Vicente J. B.; Carrondo M. A.; Teixeira M.; Frazao C. Methods Enzymol. 2008, 437, 3. [DOI] [PubMed] [Google Scholar]
- Di Matteo A.; Scandurra F. M.; Testa F.; Forte E.; Sarti P.; Brunori M.; Giuffre A. J. Biol. Chem. 2008, 283, 4061. [DOI] [PubMed] [Google Scholar]
- Fang H.; Caranto J. D.; Mendoza R.; Taylor A. B.; Hart P. J.; Kurtz D. M. Jr. J. Biol. Inorg. Chem. 2012, 17, 1231. [DOI] [PMC free article] [PubMed] [Google Scholar]
- Frazão C.; Silva G.; Gomes C. M.; Matias P.; Coelho R.; Sieker L.; Macedo S.; Liu M. Y.; Oliveira S.; Teixeira M.; Xavier A. V.; Rodrigues-Pousada C.; Carrondo M. A.; Le Gall J. Nat. Struct. Biol. 2000, 7, 1041. [DOI] [PubMed] [Google Scholar]
- Silaghi-Dumitrescu R.; Coulter E. D.; Das A.; Ljungdahl L. G.; Jameson G. N.; Huynh B. H.; Kurtz D. M. Jr. Biochemistry 2003, 42, 2806. [DOI] [PubMed] [Google Scholar]
- Hayashi T.; Caranto J. D.; Wampler D. A.; Kurtz D. M. Jr.; Moenne-Loccoz P. Biochemistry 2010, 49, 7040. [DOI] [PMC free article] [PubMed] [Google Scholar]
- Berto T. C.; Speelman A. L.; Zheng S.; Lehnert N. Coord. Chem. Rev. 2013, 257, 244. [Google Scholar]
- Blomberg L. M.; Blomberg M. R. A.; Siegbahn P. E. M. J. Biol. Inorg. Chem. 2007, 12, 79. [DOI] [PubMed] [Google Scholar]
- Hayashi T.; Caranto J. D.; Matsumura H.; Kurtz D. M. Jr.; Moënne-Loccoz P. J. J. Am. Chem. Soc. 2012, 134, 6878. [DOI] [PMC free article] [PubMed] [Google Scholar]
- Enemark J. H.; Feltham R. D. Coord. Chem. Rev. 1974, 13, 339. [Google Scholar]
- Zheng S.; Berto T. C.; Dahl E. W.; Hoffman M. B.; Speelman A. L.; Lehnert N. J. Am. Chem. Soc. 2013, 135, 4902. [DOI] [PubMed] [Google Scholar]
- Jackson T. A.; Yikilmaz E.; Miller A. F.; Brunold T. C. J. Am. Chem. Soc. 2003, 125, 8348. [DOI] [PubMed] [Google Scholar]
- Wanat A.; Schneppensieper T.; Stochel G.; van Eldik R.; Bill E.; Wieghardt K. Inorg. Chem. 2002, 41, 4. [DOI] [PubMed] [Google Scholar]
- Brown C. A.; Pavlosky M. A.; Westre T. E.; Zhang Y.; Hedman B.; Hodgson K. O.; Solomon E. I. J. Am. Chem. Soc. 1995, 117, 715. [Google Scholar]
- Berto T. C.; Hoffman M. B.; Murata Y.; Landenberger K. B.; Alp E. E.; Zhao J. Y.; Lehnert N. J. Am. Chem. Soc. 2011, 133, 16714. [DOI] [PubMed] [Google Scholar]
- Arciero D. M.; Lipscomb J. D.; Huynh B. H.; Kent T. A.; Munck E. J. Biol. Chem. 1983, 258, 4981. [PubMed] [Google Scholar]
- Nocek J. M.; Kurtz D. M. Jr.; Sage J. T.; Xia Y. M.; Debrunner P.; Shiemke A. K.; Sanders-Loehr J.; Loehr T. M. Biochemistry 1988, 27, 1014. [DOI] [PubMed] [Google Scholar]
- Haskin C. J.; Ravi N.; Lynch J. B.; Münck E.; Que L. Jr. Biochemistry 1995, 34, 11090. [DOI] [PubMed] [Google Scholar]
- Orville A. M.; Chen V. J.; Kriauciunas A.; Harpel M. R.; Fox B. G.; Munck E.; Lipscomb J. D. Biochemistry 1992, 31, 4602. [DOI] [PubMed] [Google Scholar]
- Hauser C.; Glaser T.; Bill E.; Weyhermuller T.; Wieghardt K. J. Am. Chem. Soc. 2000, 122, 4352. [Google Scholar]
- Rodriguez J. H.; Xia Y.-M.; Debrunner P. G. J. Am. Chem. Soc. 1999, 121, 7846. [Google Scholar]
- Coufal D. E.; Tavares P.; Pereira A. S.; Hyunh B. H.; Lippard S. J. Biochemistry 1999, 38, 4504. [DOI] [PubMed] [Google Scholar]
- Vicente J. B.; Testa F.; Mastronicola D.; Forte E.; Sarti P.; Teixeira M.; Giuffre A. Arch. Biochem. Biophys. 2009, 488, 9. [DOI] [PubMed] [Google Scholar]
- Stookey L. L. Anal. Chem. 1970, 42, 779. [Google Scholar]
- Coulter E. D.; Kurtz D. M. Jr. Arch. Biochem. Biophys. 2001, 394, 76. [DOI] [PubMed] [Google Scholar]
- Silaghi-Dumitrescu R.; Ng K. Y.; Viswanathan R.; Kurtz D. M. Jr. Biochemistry 2005, 44, 3572. [DOI] [PubMed] [Google Scholar]
- Saavedra J. E.; Southan G. J.; Davies K. M.; Lundell A.; Markou C.; Hanson S. R.; Adrie C.; Hurford W. E.; Zapol W. M.; Keefer L. K. J. Med. Chem. 1996, 39, 4361. [DOI] [PubMed] [Google Scholar]
- Moura I.; Xavier A. V.; Cammack R.; Bruschi M.; Legall J. Biochim. Biophys. Acta 1978, 533, 156. [DOI] [PubMed] [Google Scholar]
- Yukl E. T.; Ioanoviciu A.; Sivaramakrishnan S.; Nakano M. M.; de Montellano P. R. O.; Moenne-Loccoz P. Biochemistry 2011, 50, 1023. [DOI] [PMC free article] [PubMed] [Google Scholar]
- Bollinger J. M.; Krebs C. J. Inorg. Biochem. 2006, 100, 586. [DOI] [PubMed] [Google Scholar]
- Golombek A. P.; Hendrich M. P. J. Magn. Reson. 2003, 165, 33. [DOI] [PubMed] [Google Scholar]
- Vicente J. B.; Justino M. C.; Goncalves V. L.; Saraiva L. M.; Teixeira M. Methods Enzymol. 2008, 437, 21. [DOI] [PubMed] [Google Scholar]
- Silaghi-Dumitrescu R.; Coulter E. D.; Das A.; Ljungdahl L. G.; Jameson G. N. L.; Huynh B. H.; Kurtz D. M. Jr. Biochemistry 2003, 42, 2806. [DOI] [PubMed] [Google Scholar]
- Garbett K.; Darnall D. W.; Klotz I. M.; Williams R. J. P. Arch. Biochem. Biophys. 1969, 135, 419. [DOI] [PubMed] [Google Scholar]
- Lynch J. B.; Juarez-Garcia C.; Munck E.; Que L. Jr. J. Biol. Chem. 1989, 264, 8091. [PubMed] [Google Scholar]
- Solomon E. I.; Brunold T. C.; Davis M. I.; Kemsley J. N.; Lee S.-K.; Lehnert N.; Neese F.; Skulan A. J.; Yang Y.-S.; Zhou J. Chem. Rev. 2000, 100, 235. [DOI] [PubMed] [Google Scholar]
- Arikawa Y.; Asayama T.; Moriguchi Y.; Agari S.; Onishi M. J. Am. Chem. Soc. 2007, 129, 14160. [DOI] [PubMed] [Google Scholar]
Associated Data
This section collects any data citations, data availability statements, or supplementary materials included in this article.


