Abstract
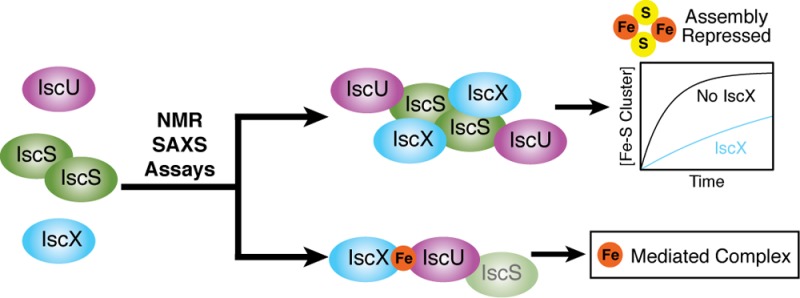
The Escherichia coliisc operon encodes key proteins involved in the biosynthesis of iron–sulfur (Fe–S) clusters. Whereas extensive studies of most ISC proteins have revealed their functional properties, the role of IscX (also dubbed YfhJ), a small acidic protein encoded by the last gene in the operon, has remained in question. Previous studies showed that IscX binds iron ions and interacts with the cysteine desulfurase (IscS) and the scaffold protein for cluster assembly (IscU), and it has been proposed that IscX functions either as an iron supplier or a regulator of Fe–S cluster biogenesis. We have used a combination of NMR spectroscopy, small-angle X-ray scattering (SAXS), chemical cross-linking, and enzymatic assays to enlarge our understanding of the interactions of IscX with iron ions, IscU, and IscS. We used chemical shift perturbation to identify the binding interfaces of IscX and IscU in their complex. NMR studies showed that Fe2+ from added ferrous ammonium sulfate binds IscX much more avidly than does Fe3+ from added ferric ammonium citrate and that Fe2+ strengthens the interaction between IscX and IscU. We found that the addition of IscX to the IscU–IscS binary complex led to the formation of a ternary complex with reduced cysteine desulfurase activity, and we determined a low-resolution model for that complex from a combination of NMR and SAXS data. We postulate that the inhibition of cysteine desulfurase activity by IscX serves to reduce unproductive conversion of cysteine to alanine. By incorporating these new findings with results from prior studies, we propose a detailed mechanism for Fe–S cluster assembly in which IscX serves both as a donor of Fe2+ and as a regulator of cysteine desulfurase activity.
Introduction
The iron–sulfur (Fe–S) cluster is an ancient, yet still abundant, protein cofactor that is essential for various biological activities.1 Although Fe–S clusters assemble spontaneously from iron and sulfide ions under anaerobic conditions, cells maintain strictly regulated machinery for Fe–S cluster biosynthesis owing to the toxicity of free iron and sulfide ions.2 Prokaryotes have evolved three major systems for Fe–S cluster biogenesis: the nitrogen fixation (NIF), the iron–sulfur cluster (ISC), and the sulfur utilization factor (SUF) systems.2 Of these, the ISC system is responsible for assembling and supplying Fe–S clusters to the majority of iron–sulfur proteins involved in metabolic processes.3 Higher eukaryotes make use of an orthologous set of ISC proteins for Fe–S cluster biosynthesis in their mitochondria.4,5
The biosynthesis of iron–sulfur proteins consists of two steps: (i) the assembly of clusters on the scaffold protein and (ii) the transfer of the assembled cluster to an apo-iron–sulfur protein.3 In Escherichia coli, cluster assembly involves IscU as the scaffold protein; sulfur is produced by the transformation of cysteine to alanine catalyzed by the cysteine desulfurase (IscS);6 electrons are provided by reduced ferredoxin upon its interaction with IscS;7,8 and iron ions are donated by a presumed iron protein. In E. coli, cluster transfer involves a DnaJ-type cochaperone (HscB), which binds to IscU containing an assembled Fe–S cluster and targets the complex to a DnaK-type chaperone bound to ATP (HscA:ATP). Cluster transfer from IscU to a target apoprotein occurs in a subsequent process involving ATP hydrolysis.9,10 The scaffold protein (IscU) is metamorphic in that it adopts two different conformations (S and D) that are interconvertible and stabilized differentially by molecular interactions.11−13 Initial interaction with IscS stabilizes the D-state of IscU, which does not bind metals and whose unligated cysteinyl thiol groups are free to pick up sulfur produced by the cysteine desulfurase. Upon cluster assembly, IscU converts to the S-state13 and binds preferentially to the cochaperone (HscB), which targets the complex to the ATP-bound chaperone (HscA:ATP). Fe–S cluster release and transfer involves the conversion of IscU back to its D-state through preferential interaction of this state with the ADP bound chaperone (HscA:ADP). Finally, exchange of the ADP bound to HscA with ATP releases IscU.12
It has been assumed that Fe–S cluster biosynthesis is highly regulated. Currently, the best understood mechanism of regulation is by bacterial frataxin (CyaY), a protein not encoded by the E. coliisc operon. CyaY has been shown to inhibit in vitro Fe–S cluster reconstitution by forming a complex with IscS.14,15 We demonstrated that the binding of CyaY to IscS inhibits the interaction of IscU with IscS, thus blocking this key step in cluster assembly.7 Another potential regulator of cluster biosynthesis is IscX, the ∼7.7 kDa protein encoded by the last gene in the isc operon. Structural studies have shown that IscX (also called YfhJ) adopts a compact α-helical structure that exposes several acidic residues that mediate iron binding.16,17 Previous studies also reported that IscX binds directly to IscS and suggested that it may play a role in Fe–S cluster assembly.17,18 Intriguingly, bioinformatic analysis of genomes from various organisms found that the IscX gene co-occurs with that for IscS, whereas it correlates poorly with the presence of the gene for CyaY. The fact that some eukaryotes that lack CyaY have orthologs of IscX, suggested that these two proteins might have redundant functions.17
We show here that IscX acts as a regulator of Fe–S cluster assembly. By combining results from NMR spectroscopy, small-angle X-ray scattering (SAXS), and chemical crossing-linking experiments we confirmed the previously identified interaction between IscX and IscS, identified a separate interaction between IscX and IscU, and demonstrated that the three proteins form a ternary complex. Analysis of the cysteine desulfurase activity of IscS revealed that the enzyme is active in both the IscU–IscS and IscX–IscS binary complexes but is greatly diminished in the IscX–IscU–IscS ternary complex. We found, furthermore, that the addition of IscX inhibits the assembly of Fe–S clusters on IscU in an in vitro Fe–S cluster assembly reaction. Thus, IscX and CyaY inhibit cluster assembly by very different mechanisms. We propose a mechanism for Fe–S cluster assembly that incorporates these and earlier findings.
Experimental Procedures
Expression and Purification of Proteins
We used previously described procedures to prepare samples of IscS,13 CyaY,7 Fdx,7 and unlabeled and uniformly 15N-labeled IscU.11,19 The procedures used to prepare unlabeled and 15N-labeled IscX are presented in the Supporting Information.
NMR Spectroscopy
The buffer used for NMR samples contained, unless stated otherwise, 20 mM Tris·HCl pH 7.5, 0.5 mM EDTA, 150 mM NaCl, and 5 mM dithiothreitol (DTT) with 7% D2O, 0.7 mM DSS, and 0.02% sodium azide. All NMR spectra were acquired at 25 °C on 600 or 900 MHz Varian VNMRS spectrometers (Agilent) equipped with z-gradient cryogenic probes. Raw data were processed with NMRPipe,20 and data were analyzed with the SPARKY21 software suite.
Previously assigned NMR signals from IscX (BMRB; accession number 6776)17 were checked and extended by reference to a 3D 1H-1H NOESY 15N-HSQC data set obtained with 0.8 mM [U-15N]-IscX. We were able to assign the backbone 1HN-15N signals from all nonprolyl residues except M1, G2, F29, T30, and E51.
The IscX titration experiments were conducted by adding 0.2 mM IscS, 0.4 mM IscU, 0.4 mM CyaY, or 0.4 mM Fdx to a sample of 0.2 mM [U-15N]-IscX. 2D 15N-TROSY-HSQC spectra of the [U-15N]-IscX sample were recorded before and after addition of the previously specified proteins.
To measure the NMR signal perturbations of [U-15N]-IscX and [U-15N]-IscU upon addition of unlabeled IscU and IscX, respectively, we started with a sample containing 0.2 mM [U-15N]-IscX/IscU. We collected a 2D 15N-TROSY-HSQC spectrum before and after adding an aliquot of unlabeled IscU/IscX. We continued adding aliquots of unlabeled IscU/IscX and collecting a spectrum, until the peak movement appeared to saturate. The final concentrations of the unlabeled proteins were 0.8 mM. We quantified the perturbations (ΔδNH) of assigned signals by the equation: ΔδNH = [(ΔδH)2 + ((ΔδN)/6)2]1/2.
The titration experiments of [U-15N]-IscX with Fe2+ or Fe3+ were carried out as follows. A sample containing 0.5 mM [U-15N]-IscX, 20 mM Tris·HCl pH 7.5, 150 mM NaCl, 0.7 mM DSS, and 0.02% sodium azide in 7% D2O/93% H2O was prepared in an anaerobic chamber (O2 level <5 ppm; Coy Laboratory). The sample was transferred to an airtight NMR tube (Wilmad) in the anaerobic chamber. Subsequent samples were prepared in the anaerobic chamber by addition of aliquots of either ferrous ammonium sulfate (for titration with Fe2+) or ferric ammonium citrate (for titration with Fe3+). 2D 15N-TROSY-HSQC spectra were acquired with each sample.
The titration experiment of IscX with IscU in the presence of Fe2+ was initiated by collecting a 2D 15N-TROSY-HSQC spectrum of a sample containing 0.2 mM [U-15N]-IscX and 0.6 mM ferrous ammonium sulfate in 20 mM Tris·HCl pH 7.5, 150 mM NaCl, and 5 mM DTT with 7% D2O, 0.7 mM DSS, and 0.02% sodium azide. The sample was prepared anaerobically. After obtaining the first spectrum, IscU was added anaerobically to the sample to achieve a concentration of 0.6 mM, and a 2D 15N-TROSY-HSQC spectrum was taken.
SAXS Data Acquisition and Analysis
Protein samples for SAXS were dialyzed extensively against 20 mM Tris·HCl pH 7.5, 150 mM NaCl buffer prior to data collection. The protein complexes investigated in this study were prepared by mixing the proteins in equimolar ratios. We initially attempted to purify each protein complex by gel filtration chromatography (HiLoad 16/60 Superdex 200, GE Healthcare); however, each mixture, with the exception of IscU–IscS, eluted from the column as its individual protein components. Prior to SAXS data collection, all protein samples and dialysate buffer were filtered through a 0.2 μm filter to remove any small particles or aggregates in solution. SAXS data for each protein complex were collected at a minimum of three concentrations ranging from 1.3 to 10.0 mg/mL. We did not observe significant interparticle interactions for any of the concentrations used in our SAXS studies.
SAXS experiments were carried out both at Sector 12-ID of the Advanced Photon Source (APS), Argonne National Laboratory, and on a Bruker Nanostar benchtop SAXS system at the National Magnetic Resonance Facility at Madison (NMRFAM). Synchrotron data at the APS were recorded with an X-ray radiation energy of 14 keV. The sample to detector distance was ∼2 m allowing for simultaneous collection of q-ranges (q = 4πsin θ/λ) for SAXS (0.004 > q > 0.522 Å–1) and WAXS (0.990 > q > 2.860 Å–1) data. Protein and buffer samples were loaded separately into a 1 mm thick capillary and flowed back and forth during data collection. Data were collected as a series of 1 s exposures for a total exposure time of 20 s. The data sets were converted to 1D scattering profiles and averaged post removal of any scattering profiles that differed significantly—usually as the result of bubble formation.
The Bruker Nanostar system was equipped with a rotating anode (Cu) Turbo X-ray Source and a Vantec-2000 (2048 × 2048 pixel) detector (Bruker AXS). The sample-to-detector distance was set at ∼1 m allowing for the detection range: 0.012 > q > 0.240 Å–1. Sample and buffer scattering data were collected for 4 h with frames recorded every hour. Each frame was compared to check for radiation damage, and none was detected over the course of the experiments. The SAXS data sets were then averaged and converted to 1D scattering profiles for further analysis.
Buffer background subtraction for the SAXS data recorded at the APS was guided by use of the corresponding WAXS data and carried out with IGOR PRO (WaveMetrics) software. After buffer subtraction, the ATSAS22 software suite was used to process the SAXS data. The radius of gyration (Rg) for each protein and protein complex reported in this study was determined by using the Guinier approximation in the q range, such that qmax·Rg < 1.3. The software package GNOM23 was used to obtain pairwise distance distribution functions for each protein and protein complex. Dmax was varied in increments of 2 Å until the pairwise distance distribution function dropped off smoothly to zero. The Rg values determined from GNOM were in very good agreement with those determined by the Guinier approximation (Figure S1). The output from GNOM was then used in conjunction with DAMMIF to generate 20 independent ab initio dummy atom models to gauge the molecular shape of each protein complex.24 Given prior knowledge of similar complexes with IscS,15,25 we imposed P2 symmetry in our structural calculations. Most of the 20 models for each complex exhibited excellent agreement with the experimental scattering curve (χ2 < 1). However, ∼40% of the models for IscU–IscS exhibited distortions inconsistent with the known structures of IscU and IscS; we excluded these structures upon visual inspection. The variation in the IscU–IscS shape models could be due to the dynamic nature of IscU upon binding IscS or a lack of P2 symmetry. The final accepted models had a normalized spatial discrepancy (NSD) of <1. When we did not enforce P2 symmetry, all models were in excellent agreement (average NSD of 0.78) and were nearly identical to the accepted models achieved by enforcing P2 symmetry for each complex (IscX–IscS, IscU–IscS, IscX–IscU–IscS). We used DAMAVER26 to average the individual shape models in generating the reported shape models for each complex.
We used the software package SASREF27 to carry out rigid-body modeling simulations of the binary and ternary complexes of IscS, IscU, and IscX. The restraints used in docking simulations were derived from NMR data reported here and in previous studies.15,25 Specifically, IscX was restrained to localize about the positively charged binding patch on IscS (residues 220–223), and IscU was restrained to localize in the region of IscS as determined from point mutation studies that influenced binding interactions.15 The CRYSOL28 software suite was used to compare the models resulting from the rigid-body modeling simulations to experimental data.
We used the recently proposed χfree2 statistic29 to validate the models derived from rigid-body modeling simulations and the ScÅtter software package (http://www.bioisis.net/tutorial) to calculate χfree with 5000 selection rounds. The effects of weak complex formation were investigated using the “minimal ensemble search” (MES) ensemble selection algorithm.30 The structure pool used in deriving ensembles contained monomeric and dimeric structures of IscX, IscU, and IscS, the structure of the IscX–IscU complex derived from NMR chemical shift perturbations, and the complexes of IscX–IscU, IscU–IscS, and IscX–IscU–IscS derived from rigid-body modeling simulations.
Cross-Linking Experiments
The cross-linking experiments to identify interactions among IscX, IscU, and IscS were initiated in solutions containing various combinations of the three proteins at 1 mg/mL along with excess DTT. After a 10–20 min incubation, the solvent in each sample was exchanged to 50 mM HEPES·NaOH pH 7.5 by employing a zeba spin desalting column (Thermo Scientific). Each sample was incubated with 20-fold Sulfo-SMCC (Thermo Scientific) for 1 h at ambient temperature. Sulfo-SMCC is an amine-to-sulfhydryl chemical cross-linker whose reactive groups are separated by 0.83 nm. Each cross-linking reaction was quenched by adding excess Tris and DTT, and the product was analyzed by SDS-PAGE. The band corresponding to the IscX–IscU–IscS ternary complex was excised and analyzed further by mass spectrometry, which confirmed the expected mass of the ternary complex (data not shown).
Cysteine Desulfurase Activity Assay
The assay was initiated by anaerobically preparing 1 mL reaction mixtures containing 50 mM Tris·HCl at pH 7.5, 5 mM DTT, 125 μM ferrous ammonium sulfate, and 0.5 μM IscS alone and with other proteins (IscX, CyaY, IscU, IscU + IscX, or IscU + CyaY). The concentration of IscU (25 μM) was set as a 50-fold excess over IscS to mimic the conditions of the Fe–S cluster reconstitution experiment (see below). IscX and CyaY were added at two different concentrations: one equivalent to the concentration of IscS and another equivalent to that of IscU. Sulfide production was initiated by the addition of l-cysteine to an initial concentration of 125 μM. After 20 min anaerobic incubation at ambient temperature, 300 μL of the reaction mixture was diluted to 800 μL, and 100 μL of 20 mM N,N-dimethyl-p-phenylenediamine in 7.2 N HCl and 100 μL of 30 mM FeCl3 in 1.2 N HCl were added to quench the reaction and to convert sulfide to methylene blue. The quenched reaction was incubated for 20 min, and then the absorbance at 670 nm was measured and used to estimate the amount of sulfide by comparison to a standard curve obtained from known concentrations of Li2S.
In Vitro Assembly of Fe–S Clusters on IscU
Fe–S cluster assembly experiments were conducted in an anaerobic chamber (Coy Laboratory). The reaction mixture contained 0.5 μM IscS, 25 μM IscU, 5 mM DTT, and 125 μM ferrous ammonium sulfate in a 50 mM Tris·HCl buffer at pH 7.5. We also investigated the effects of added IscX or CyaY on this Fe–S assembly reaction. Cluster assembly reactions were initiated by the addition of 125 μM l-cysteine. The mixtures were transferred to 1 cm path length cuvettes, which were capped with rubber septa, and the Fe–S cluster assembly reaction was monitored by following the absorbance at 456 nm.
Results
IscX Binds IscS and Participates in an IscX–IscU–IscS Ternary Complex; However, IscX, CyaY, and Fdx Compete for an Overlapping Binding Site on IscS
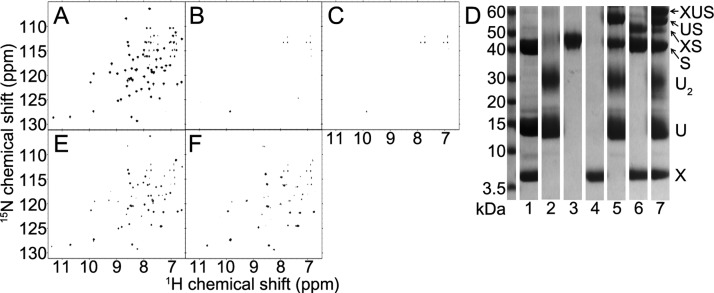
We interpreted the 2D 15N-TROSY-HSQC spectrum of [U-15N]-IscX (Figure 1A) in terms of the assigned chemical shifts deposited in the BMRB.17 We also collected a 3D 1H-1H NOESY–15N-HSQC spectrum of [U-15N]-IscX to confirm and extend the resonance assignments. The addition of unlabeled IscS led to broadening of signals from [U-15N]-IscX (Figure 1B) as consistent with the formation of a high molecular weight complex. A set of these IscX peaks (R9, I11, A14, D17, V60, W61, D63, and E64) broadened noticeably in advance of the others upon the addition of 0.5 equiv IscS (data not shown). The IscX residues affected corresponded to those in the previously proposed interaction face with IscS.17
Figure 1.
IscX–IscS complex accommodates subsequent binding of IscU, whereas added CyaY or Fdx displace IscX from IscS. (A) 2D 15N-TROSY-HSQC spectrum of [U-15N]-IscX. (B) The addition of 1 equiv of unlabeled IscS to the sample shown in A led to the broadening of most of the 2D 15N-TROSY-HSQC signals from [U-15N]-IscX as expected for the formation of an IscX–IscS complex. (C) 2D 15N-TROSY-HSQC spectrum of the sample in B following the addition of 2 equiv of unlabeled IscU. Further broadening of the signals from [U-15N]-IscX are consistent with the formation of an IscX–IscU–IscS ternary complex. (D) Results from the chemical cross-linking experiment used to investigate the formation of protein–protein complexes. Different combinations of IscS (S), IscU (U), and IscX (X) were incubated with a chemical cross-linker, and the products were analyzed by SDS PAGE. The mixture containing all three proteins (lane 7) showed a band corresponding to the expected mass of the ternary complex (XUS). The other mixtures (lane 2: IscU alone, lane 3: IscS alone, lane 4: IscX alone, lane 5: IscU + IscS, lane 6: IscX + IscS) yielded bands corresponding the expected masses of the labeled species (U2, dimeric IscU; US, IscU–IscS; XS, IscX–IscS); bands corresponding to most of these species were also observed in the cross-linked mixture of the three proteins (lane 7). Lane 1 shows the control mixture of the three proteins untreated with cross-linker. (E) The addition of 2 equiv of unlabeled CyaY to the sample shown in B partially restored the 2D 15N-TROSY-HSQC signals from unbound [U-15N]-IscX, indicating that CyaY displaces IscX bound to IscS. (F) The addition of 2 equiv of unlabeled Fdx to the sample shown in B yielded 2D 15N-TROSY-HSQC signals corresponding to unbound [U-15N]-IscX, indicating that Fdx displaces IscX from IscS.
We investigated whether other proteins active in Fe–S cluster assembly, namely IscU, CyaY, and Fdx, affect formation of the IscX–IscS complex. Previous studies had shown that IscX, IscS, and IscU form a ternary complex, whereas CyaY and IscX were found to compete for a conserved positively charged binding site on IscS.25 We found that the addition of IscU perturbed the NMR spectrum of [U-15N]-IscX mixed with an equivalent amount of IscS (Figure 1C), as expected for a ternary complex. Chemical cross-linking experiments also were consistent with an IscX–IscU–IscS ternary complex (Figure 1D). On the other hand, the addition of CyaY (Figure 1E) or Fdx (Figure 1F) to the mixture of [U-15N]-IscX and IscS restored sharp peaks of free [U-15N]-IscX, indicating that CyaY, Fdx, and IscX compete for overlapping binding sites on IscS.
SAXS Studies Provide a Low-Resolution Model for the IscX–IscU–IscS Ternary Complex
Investigations of the complexes between IscS and its binding partners pose a challenge owing to the disparity in molecular mass between IscS (90 kDa homodimer) and IscU (28 kDa for two molecules) or IscX (14 kDa for two molecules). This challenge is exacerbated by their relatively weak binding interactions. The dissociation constants for IscS and its binding partners are in the low μM range: IscU (1.5 μM), Fdx (1.5 μM), and CyaY (23 μM).8,15
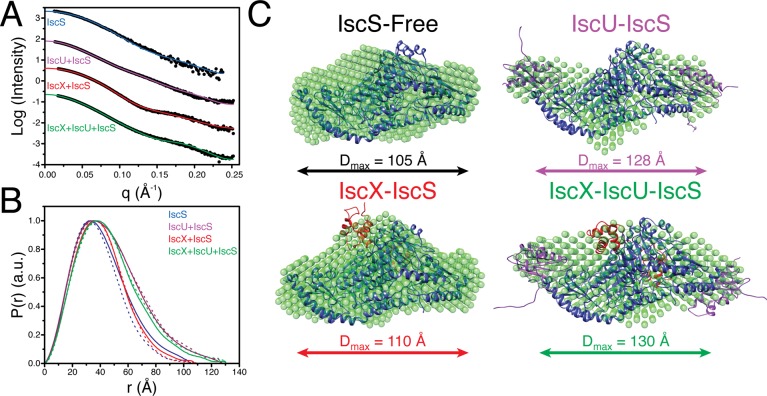
Before examining the ternary complex, we investigated the IscS homodimer alone and its binary complexes (IscU–IscS, IscX–IscS, Fdx–IscS, and CyaY–IscS). The IscU–IscS complex had been studied previously by SAXS,15 NMR,13 and X-ray crystallography.25 Previous SAXS studies15 revealed that the IscU–IscS complex is elongated relative to the IscS homodimer with the maximum end-to-end distance (Dmax) expanding from ∼110 to 130 Å. Further, the radius of gyration of the complex (36 Å) was greater than that of the IscS homodimer (31 Å).15 Our results confirmed these observations (Figures 2 and S1; Table S1). To further verify formation of the IscU–IscS complex, we also determined its molecular mass by SAXS. The molecular mass of globular proteins typically is determined from SAXS data by reference to zero angle scattering intensities (I(0)) obtained as a function of concentration for globular protein standards, such as lysozyme or BSA.31 In addition to this approach, we used the new SAXS invariant parameter (Vc)29 to determine the molecular mass of the complex. Whereas the zero angle scattering I(0) method requires the species to be globular, the Vc approach works with both compact and disordered molecules. The I(0) and Vc approaches yielded molecular masses for the IscS homodimer of 88 and 81 kDa, respectively, both lower than the theoretical value of 90 kDa. This discrepancy could be the result of inherent errors in each technique (∼10%) or to the presence of monomeric IscS. Next, we applied the I(0) and Vc approaches to the IscS–IscU complex and obtained molecular masses of 102 and 92 kDa, respectively. Both methods yielded molecular masses larger than for the IscS homodimer but smaller than the theoretical value of 118 kDa; again the discrepancy could reflect incomplete IscS–IscU complex formation owing to the low association constant. To explore the influence of incomplete complex formation on the observed SAXS data, we simulated the population-weighted linear combination of the scattering of each particle in the mixture (Figure S2). We also used the minimal ensemble search (MES) algorithm30 to study the impact of weak complex formation on our experimental data for the IscU–IscS complex (Figure S3). Ensembles of size 1–4 were selected from a pool of structures that would be present in the scenario of weak complex formation. Regardless of the allowed ensemble size, the IscU–IscS structure was selected over competing structures by >90%. These results indicate that the observed scattering profile is largely influenced by that of the IscU–IscS complex. Our simulations indicated that, whereas incomplete complex formation does alter the observed scattering profile, the derived Rg, Dmax, and pairwise distance distributions still serve to define the binding interface, even at levels of IscS–IscU complex formation as low as 60%. Thus, SAXS can provide detailed structural information about these weak complexes.
Figure 2.
Structural models from SAXS data. (A) Experimental SAXS data (circles) recorded for IscS (blue), IscU + IscS (purple), IscX + IscS (red), and IscX + IscU + IscS (green). Fits of the molecular models for IscS (PDB 1P3W) and those determined from rigid-body modeling to experimental SAXS are plotted as solid lines. (B) Pairwise distance distribution functions derived from experimental SAXS data (solid-lines) for IscS (blue), IscU + IscS (purple), IscX + IscS (red), and IscX + IscU + IscS (green) compared to those derived from the rigid-body modeling derived structures (dashed-lines). (C) Molecular models of IscS (black, PDB 1P3W), IscU–IscS (purple), IscX–IscS (red), and IscX–IscU–IscS (green) determined from rigid-body modeling simulations. The structures used for each complex component in the rigid-body modeling simulations were: IscS (blue; PDB 1P3W),32 IscU (purple; PDB 2L4X),33 and IscX (red; PDB 2BZT).17 The resulting structures from rigid-body modeling are overlaid with ab initio shape models determined from the SAXS data with DAMMIF.24
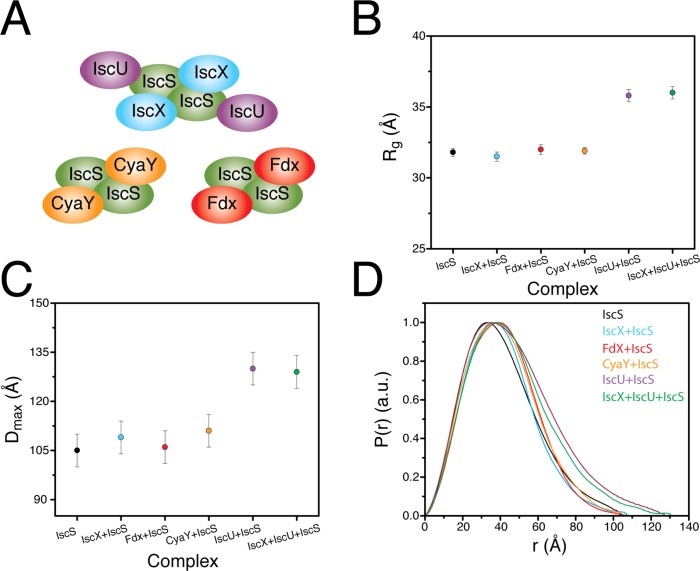
In contrast to IscU, the addition of IscX to the IscS homodimer did not result in a significant change in the Dmax or Rg values (Figures 2 and 3; Table S1). These results are consistent with IscX binding near the dimerization interface of IscS rather than elongating the complex like IscU (Figure 3).
Figure 3.
Comparison of results from SAXS experiments for several complexes involving IscS. (A) Cartoon representations of the IscX–IscS, IscU–IscS, Fdx–IscS,8 CyaY–IscS,15 and IscX–IscU–IscS complexes. (B) Experimentally determined radius of gyration for IscS and the complexes depicted in A. (C) Experimentally determined Dmax for IscS and the complexes depicted in A. (D) Distance distribution functions determined from experimental SAXS data from IscS and the complexes depicted in A.
CyaY, Fdx, and IscX are each reported to bind to same conserved positively charged patch at the IscS homodimer interface (Figure 3).8,15 As with the IscX–IscS binary complex, we observed no significant change in the Dmax or Rg values upon formation of the binary CyaY–IscS and Fdx–IscS complexes (Figure 3B,C). We also identified congruent changes in the distance distribution function for all three complexes relative to the IscS homodimer (Figure 3D). With the exception of CyaY–IscS, the molecular masses determined from SAXS data by the I(0) approach, as with the IscU–IscS complex, were systematically ∼20% lower than the corresponding theoretical values (Table S1). Again, this probably is a consequence of the complexes not being saturated owing to the weak binding affinities. The related binding sites shown by SAXS are all consistent with the competitive binding interplay among IscX, CyaY, and Fdx, as observed here by NMR. Thus, our SAXS and NMR data strongly support that all three proteins bind to and compete for a similar site on IscS.
SAXS experiments on a mixture of IscS, IscU, and IscX revealed an expansion in both Dmax and Rg relative to the IscS homodimer with values of 130 and 35 Å, respectively (Figure 3B,C). Identification of the ternary complex cannot simply be made by comparing changes in the Dmax or Rg relative to the IscS homodimer because similar changes were observed for the IscU–IscS complex. Interestingly, inspection of the distance distribution function of the IscS, IscU, IscX mixture revealed a hybrid of the changes observed for the binary complexes IscU–IscS and IscX–IscS (Figures 2 and 3). Here the distance distribution function of the complex showed an expansion of Dmax (130 Å) from that of the IscS homodimer (105 Å). This expansion of Dmax is consistent with IscU binding on the periphery of the IscS homodimer when in the ternary complex. The distance distribution function of the ternary complex relative to the IscU–IscS complex had an expansion of the most probable distance (Figure 3D), suggesting that IscX occupies the same binding site in the ternary complex as in the binary complex. Similar to the binary complexes, the molecular mass of the ternary complex calculated from the SAXS data was ∼20% below the theoretical value. As with the binary complexes, we used simulations to validate the ability of SAXS to detect the presence of an unsaturated ternary complex and found that the overall shape of the scattering curve was constant at saturation levels above 50% (Figure S2). Furthermore, the Porod volumes measured for each complex were consistent with ternary complex formation: IscX–IscU–IscS yielded a larger Porod volume than either of the binary complexes (IscX–IscS or IscU–IscS) (Table S1).
Assuming that the known
structures of IscS, IscX, and IscU are
mostly maintained upon forming a complex, we used the SASREF27 software package to carry out rigid-body modeling
simulations to generate molecular models of each complex (IscU–IscS,
IscX–IscS, and IscX–IscU–IscS) consistent with
our experimental SAXS data. The docking simulations used the interaction
sites determined here by NMR and by previous structural and mutagenesis
studies as structural restraints. First, we carried out SAXS-based
rigid-body modeling simulations of the X-ray structure of IscS (1P3W)32 and docked two models for IscU, the NMR structure of apo-IscU
(2L4X),33 and the NMR structure of Zn2+:IscU
(1Q48).34 Both yielded similar good fits with  values of
0.9 and 0.6, respectively, and
each had a
  value of 1.1. The apo-IscU–IscS
complex showed excellent agreement between the structural model and
experimental data (Figure 2A), and the structural
model was also consistent with the ab initio shape
model (Figure 2B). The largest deviations between
the theoretical and experimental scattering curves for IscU–IscS
were at higher angles (q > 0.15 Å–1), as expected for a weak complex with incomplete saturation. We
also fit the IscU–IscS crystal structure (3LVL)25 to the experimental SAXS data, and it showed excellent
agreement with
  and
and  values of 0.8 and 1.0, respectively.
Lastly,
we explored the ability of SAXS to decipher the bound conformation
of IscU at the resolution used in our study. NMR studies from our
laboratory have shown that IscS binds preferentially to the D-state
of IscU,13 which lacks secondary structure,12 contains two cis-peptidyl-prolyl
peptide bonds not present in the S-state,35 but is not fully unfolded.36 Rigid-body
modeling simulations of IscU with varying extents of structure revealed
that the bound conformation of IscU cannot be determined reliably
by SAXS alone (Figure S4). Rather, we can
only confirm that IscU binds to IscS in at least a semicompact manner.
The model generated for the IscX–IscS complex was in good
agreement with the experimental SAXS data (Figure 2) with  and
and  values of 1.0 and 1.1, respectively.
The
largest deviations between the theoretical and experimental SAXS data
were at higher angles (q > 0.15 Å–1) consistent with weak complex formation. Our molecular model is
consistent with IscX binding to the positive patch of IscS that exists
at its homodimer interface.
Finally, the model generated for
the IscX–IscU–IscS
ternary complex was in good agreement with the experimental SAXS data
(Figure 2) with  and
and  values of 0.7 and 0.8, respectively.
As
with the IscX–IscS and IscU–IscS complexes, the largest
deviations between the theoretical and experimental SAXS data were
at higher angles (q > 0.15 Å–1) consistent with weak complex formation (Figure 2). Also, the molecular model obtained from rigid-body modeling
was in good agreement with the ab initio shape model.
We also carried simulations using the MES algorithm to determine if
the ternary complex model could be distinguished from a mixture of
binary complexes between IscX–IscS and IscU–IscS (Figure S5). The simulations of experimental and
synthetic data showed that the best fit was to the ternary complex
model. The binary complex model was a close second, but it can be
invalidated on the grounds that the species selected in fitting this
model failed to satisfy the law of mass action. Evidence for ternary
complex formation from our NMR and chemical cross-linking experiments
confirmed that the model that best fit the SAXS data is likely to
be true. This model defines the positions of IscX and IscU on the
IscS homodimer and excludes direct interaction between IscX and IscU
in the ternary complex.
IscX interacts with IscU
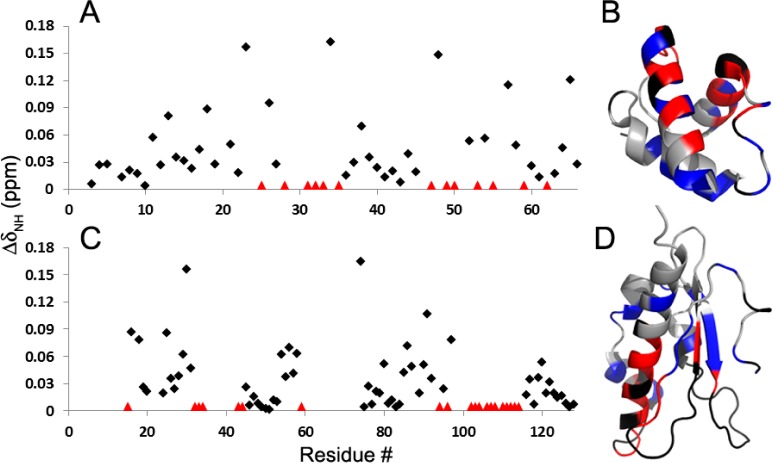
Although an interaction between IscX and IscU was reported a decade ago on the basis of an affinity chromatography assay,18 this complex has not been characterized further. We have used NMR spectroscopy to confirm this interaction and to identify residues in the interaction surface (Figure 4). The addition of unlabeled IscU led to broadening of cross peaks in the 1H-15N HSQC spectrum of [U-15N]-IscX assigned to K25, R28, D31–H33, W35, Q47, S49, N50, I53, E55, L59, and L62 (colored red in Figure 5AB). Another set of backbone 1HN-15NH peaks from [U-15N]-IscX exhibited significant shifts (ΔδNH > 0.04 ppm); these were assigned to I11, E13, D17, A18, D21, D23, T26, Q34, D38, A48, K52, L54, I57, L58, E64, and A65 (colored blue in Figure 5B). Similarly, the addition of unlabeled IscX led to broadening of cross peaks in the 1H-15N HSQC spectrum of [U-15N]-IscU assigned to R15, V32–A34, L43, Q44, K59, A94, E96, V102–I104, C106–I108, and A110–I114 (colored red in Figure 5CD). An additional set of peaks from [U-15N]-IscU exhibited significant shifts (ΔδNH > 0.04 ppm); these were assigned to N16, G18, E25, S29–M31, E54, A56–F58, T74, K80, A85–A87, N90, T91, L97, and D120 (colored blue in Figure 5D). Notably, only the signals from the S-state of IscU were perturbed by the titration with IscX, indicating that this interaction involves the more structured state of IscU. Consistent with preferential binding to the S-state, the addition of a 2-fold excess of IscX led to a 15% increase in %S = [S]/([S] + [D]) as determined from the relative intensities of the 1H-15N peaks from K128 assigned to the two states.12
Figure 4.
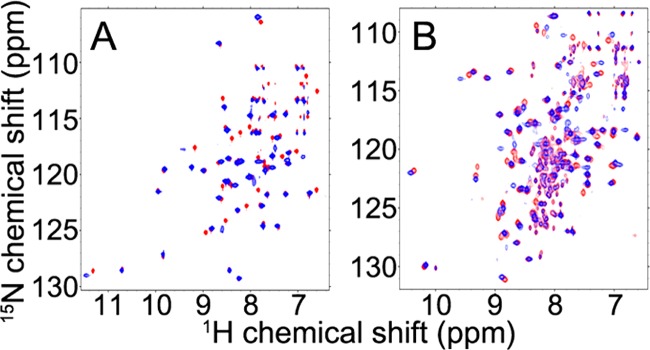
NMR evidence for the interaction between IscX and IscU. (A) 2D 15N-TROSY-HSQC spectrum of [U-15N]-IscX alone (red) overlaid with the spectrum of [U-15N]-IscX following the addition of 4 equiv of unlabeled IscU (blue). (B) 2D 15N-TROSY-HSQC spectrum of [U-15N]-IscU alone (red) overlaid with the spectrum of [U-15N]-IscU following the addition of 4 equiv of unlabeled IscX (blue). The sets of peaks from [U-15N]-IscX and [U-15N]-IscU that broadened considerably upon addition, respectively, of unlabeled IscU and IscX likely correspond to residues in the contact regions.
Figure 5.
NMR evidence for the surfaces by which IscX and IscU interact. (A) Perturbation of the 15NH-1HN signals (ΔδNH) of [U-15N]-IscX, resulting from the addition of 4 equiv of IscU. Red triangles denote residues whose chemical shift changes could not be followed because of severe line broadening. (B) Results from panel A mapped onto the structure of IscX (PDB 2BZT)17 with the following color code: gray, not affected; blue, significantly shifted (ΔδNH > 0.04 ppm); red, broadened; black, not assigned or overlapped. (C) Perturbation of the 15NH-1HN signals of [U-15N]-IscU resulting from the addition of 4 equiv IscX. Red triangles denote residues whose chemical shift changes could not be followed because of severe line broadening. (D) Results from panel C mapped onto the structure of IscU (PDB 2L4X)33 with the same color code used for panel B.
An earlier NMR study reported that IscX binds both Fe2+ and Fe3+.17 NMR spectral changes upon anaerobic titration of [U-15N]-IscX with ferrous ammonium sulfate (Figures 6 and S6) confirmed formation of an IscX–Fe2+ complex. However, the analogous experiment with a 3-fold excess of added ferric ammonium citrate failed to show an interaction (Figures 6 and S6). The subsequent anaerobic addition of DTT to the sample containing IscX and excess Fe3+ produced the spectral signature of IscX–Fe2+ (Figure S6). The earlier experiment added Fe3+ in the form of ferrous chloride;17 thus the discrepancy appears to result from the inability of IscX to compete with citrate for Fe3+.
Figure 6.
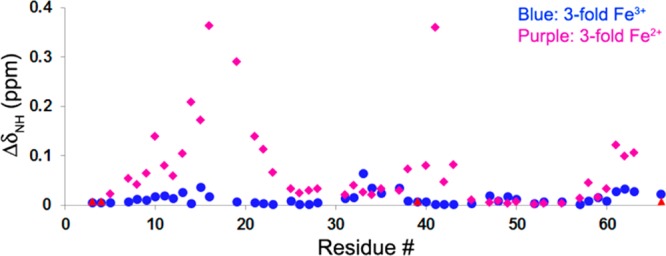
NMR signal perturbation of [U-15N]-IscX upon adding 3-fold Fe3+ as ferric ammonium citrate (blue) or upon adding 3-fold Fe2+ as ferrous ammonium sulfate (purple). Residues from IscX, whose signals are broadened beyond detection by the addition of Fe2+ (L3, K4, L39, and E66) are marked with red triangles; upon the addition of Fe3+, the signals from these residues were neither broadened nor shifted.
We next investigated whether the IscU–IscX interaction occurs in the presence of Fe2+ added as ferrous ammonium sulfate. The anaerobic addition of IscU along with Fe2+ to [U-15N]-IscX resulted in many changes to its 1HN-15NH signals. The interaction led to a new set of signals indicating a slow process on the time scale of NMR chemical shifts (Figure 7). Several signals from IscX, however, were not perturbed; these were found to correspond to residues (T6–S8, E10, G12, L15, and E40–D43) not involved in interaction with IscU in the absence of Fe2+. The 2D 15N-TROSY-HSQC spectrum of [U-15N]-IscX mixed with 3-fold Fe2+ and 3-fold IscU (blue, Figure 7) clearly differs from those of apo-IscX (Figure 1A), Fe2+–IscX (red, Figure 7), or IscX–IscU (blue, Figure 4A). These results appear consistent with a model in which Fe2+ stabilizes the IscU–IscX complex but does not change its interaction site.
Figure 7.
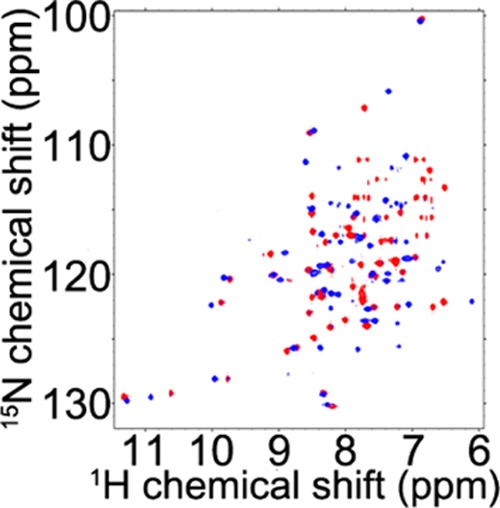
2D 15N- HSQC spectrum of [U-15N]-IscX in the presence of 3 equiv of ferrous ion (red) overlaid with the 2D 15N-TROSY-HSQC spectrum of [U-15N]-IscX in the presence of 3 equiv of ferrous ion following the addition of 3 equiv of unlabeled IscU (blue). Note that the blue spectrum is different from those of [U-15N]-IscX alone (Figure 4A, red), Fe2+:[U-15N]-IscX (Figure S6D, purple), or [U-15N]-IscX–IscU (Figure 4A, blue).
Although Fe2+ strengthens the IscU–IscX interaction, it does not appear to strengthen the interaction between IscX and IscS. The addition of unlabeled IscS to [U-15N]-IscX led to similar line broadening effects in the presence or absence of Fe2+ (data not shown).
IscX Suppresses Sulfide Production of IscS in the Presence of IscU
Given the various interactions between the cysteine desulfurase (IscS) and other proteins, it was of interest to determine their effects on its enzymatic activity. We monitored sulfide production in the presence of a catalytic amount of IscS without and with comparable or excess amounts of IscU, IscX, or CyaY. All of the reaction mixtures contained excess ferrous ion, l-cysteine, and DTT to mimic the conditions of the in vitro Fe–S cluster assembly reaction. We observed that neither IscX nor CyaY by itself altered the amount of sulfide produced by IscS (Figure 8). By contrast, IscU in 50-fold excess decreased sulfide production by a factor of 2: sulfide production of IscS by itself was 44 μM (±1 μM) after 20 min incubation, and IscU decreased it to 19 μM (±2.7 μM). The subsequent addition of a 50-fold excess of IscX suppressed it further by an additional factor of 2; sulfide production under these conditions was 9 μM (±0.1 μM). In comparison, the sulfide production was restored to some extent by adding 50-fold CyaY to the sample containing 50-fold IscU. The inhibitory effect of IscX in the presence of IscU has not been reported previously, but the other observations are consistent with reports that IscU decreases desulfurase activity of IscS, whereas CyaY restores this activity,39 and that CyaY displaces IscU from IscS.7
Figure 8.
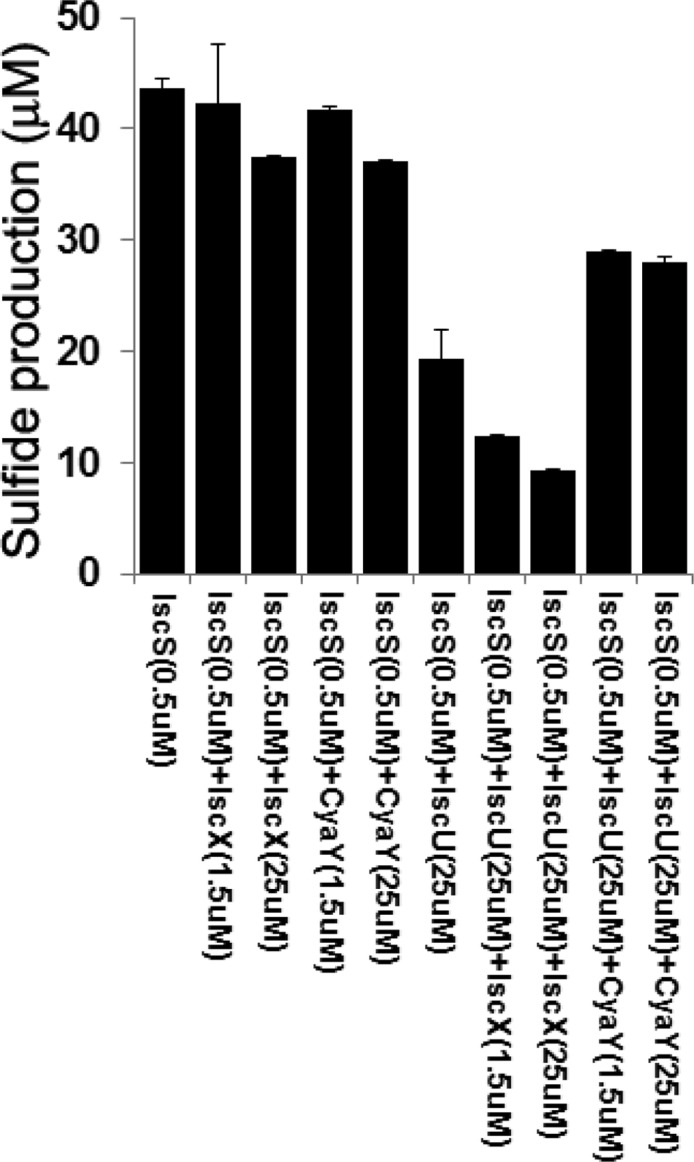
Sulfide production of reaction mixtures containing 5 mM DTT, 125 μM l-cysteine, and 125 μM ferrous ammonium sulfate plus the protein(s) designated below the x-axis. Sulfide was measured after incubating each mixture for 20 min at ambient temperature.
IscX Represses IscU-Mediated Fe–S Cluster Assembly
We also tested whether IscX perturbs in vitro Fe–S cluster assembly on IscU in the presence of catalytic amount of IscS, excess iron, l-cysteine, and DTT, as monitored by the absorbance at 456 nm (Figure 9) or by following full UV–vis spectra (from 900 to 300 nm; Figure S7).13,37 We found that the addition of catalytic (red, Figures 9 and S7) or stoichiometric (blue, Figures 9 and S7) amounts of IscX repressed Fe–S cluster assembly compared to the control (black, Figures 9 and S7). Thus, the IscX-mediated inhibition of cysteine desulfurase activity in the presence of IscU translates into compromised cluster assembly. As expected,14,39 the addition of CyaY to the reaction mixture further slowed Fe–S cluster assembly (green; Figures 9 and S7). Repression of Fe–S cluster assembly in this case can be explained by the competition between CyaY and IscU for binding to IscS.7
Figure 9.
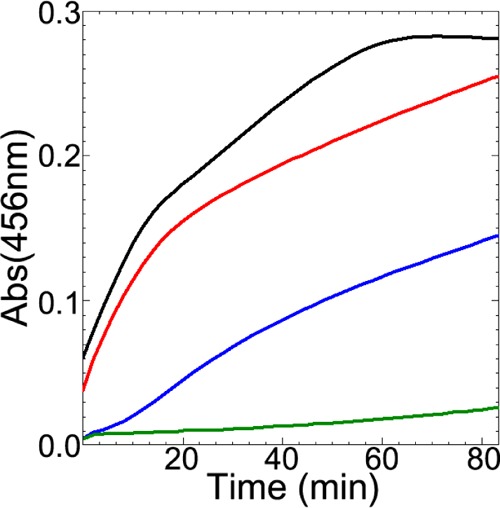
IscX and CyaY suppress iron–sulfur cluster assembly. Iron–sulfur cluster assembly on IscU was monitored by following absorbance at 456 nm. All reaction mixtures contained 0.5 μM IscS, 25 μM IscU, 5 mM DTT, 125 μM l-cysteine, and 125 μM ferrous ammonium sulfate: reaction mixture alone (black); reaction mixture with added 1.5 μM IscX (red); reaction mixture with added 25 μM IscX (blue); reaction mixture with added 25 μM CyaY (green). The entire UV–vis spectrum for each reaction is shown as a function of time in Figure S7.
Discussion
The addition of ferrous ammonium sulfate to [U-15N]-IscX caused the broadening beyond detection of backbone 1H-15N signals from 4 residues (L3, K4, L39, and E66) and large chemical shifts (ΔδNH > 0.1 ppm) for signals from 11 residues (Figure 6). Because the shifted peaks are sharp (Figure S6), we attribute them to conformational changes that accompany binding of Fe2+ rather than hyperfine interactions. By contrast, the addition of excess ferric ammonium citrate had no effect on signals assigned to L3, K4, L39, and E66 and led to no chemical shifts with ΔδNH > 0.1 ppm (Figure 6). Thus, IscX fails to compete with citrate for binding of Fe3+, and we attribute the slight perturbations observed to nonspecific binding.
We have shown here that IscX interacts directly with the S-state of IscU (Figures 4 and 5) and that this interaction is stabilized by Fe2+ (Figure 7). We confirmed our previous studies7 showing that IscX forms a binary complex with IscS, which is displaced by ferredoxin (Fdx) or bacterial frataxin (CyaY), but not by IscU (Figure 1). We provide evidence here for an IscX–IscU–IscS ternary complex (Figure 2). Notably, IscX was found to inhibit the cysteine desulfurase activity of IscS in the ternary complex but not in the IscX–IscS binary complex (Figure 8). The inhibitory effect of IscX also manifests itself as a decrease in the rate of cluster assembly on IscU in an in vitro Fe–S cluster assembly reaction (Figure 9). CyaY is another inhibitor of cluster assembly, but it appears to operate by a different mechanism in that CyaY displaces IscU7 and thereby leads to stimulation of the cysteine desulfurase activity of IscS.39 Because bacterial frataxin (CyaY) inhibits Fe–S cluster biosynthesis but not cysteine desulfurase activity, its physiological role in bacteria may conceivably be to redirect sulfur trafficking from Fe–S cluster biosynthesis to other sulfur-requiring mechanisms. IscS has been shown to be essential for various other sulfur-related mechanisms.38
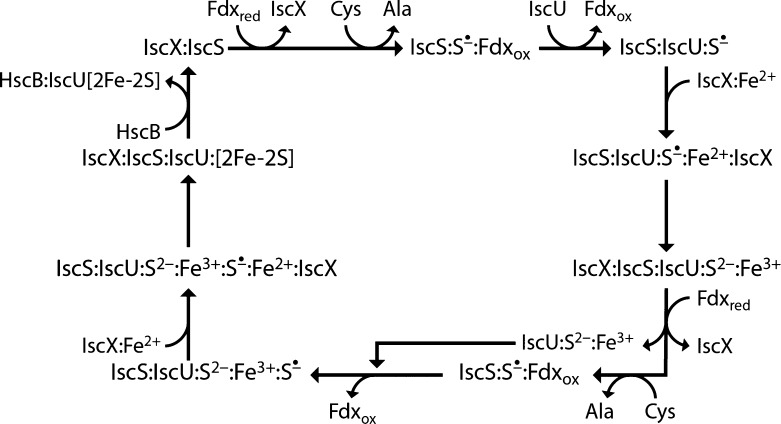
The challenge is to come up with a mechanism for Fe–S cluster assembly that is consistent with these and previous observations. We propose a speculative mechanism (Figure 10) that can be subject to future testing. A major stumbling block is the unknown nature of the iron donor; on the basis of our current findings, we assume that it is, in fact, IscX. Because we found that ferredoxin (Fdx) displaces both IscU and IscX,7 the first step in Fe–S cluster biosynthesis would appear to be the binding of reduced Fdx (Fdxred) to IscS, which would displace any bound IscX and remove inhibition of the cysteine desulfurase reaction that converts Cys to Ala to produce S0, which is bound to C328 of IscS. Reaction between Fdxred and −S–S0 would lead to Fdxox and −S–S•. Binding of IscU would displace Fdxox, and attack by one of the Cys sulfhydryl groups of IscU on C328 would lead to transfer of the S• to IscU. IscS binds preferentially to the D-state of IscU, the form of IscU that fails to bind to metal ions and thus has free cysteine sulfhydryl groups.13 Following sulfur transfer, IscX:Fe2+ is attracted to IscU:S• to initiate the oxidation of Fe2+ to Fe3+ the reduction of S• to S2–, and the transfer of iron to IscU. Such a reaction is consistent with our finding that Fe2+ binds to IscX and strengthens its interaction with IscU, whereas Fe3+ does not interact with IscX. Also, the presence of the −S–S• on one of the cysteine side chains of IscU is expected to facilitate iron transfer. The interaction with IscX may stabilize the S-state of IscU, which is the state that binds metals and Fe–S clusters. We envision that the −S–S2– group binds Fe3+ as an intermediate in cluster assembly. The NMR results presented here demonstrate that the residues of IscU that interact with IscX are different from those in the IscU–IscS interface.25 We postulate, thus, that IscX interacts at the face of IscU that is not contacting IscS and that the binding site for IscX on IscS is too far away to be involved in this interaction as determined from the SAXS-based model (Figure 2C). Ligation of the iron by two of the three Cys residues, D39, and H105 would leave the side chain of the third cysteine residue free. After its release of iron, IscX could move to its binding site on IscS leading to inhibition of desulfurase activity. The second cycle would then be initiated by the binding of Fdxred to IscS, with displacement of both IscX and IscU with its nascent cluster. Release of IscX would reactivate cysteine desulfurase activity and lead to a second conversion of Cys to Ala with the production of S0, which is bound to C328 of IscS and reduced to S• by conversion of Fdxred to Fdox. Next, IscU:S2–:Fe3+ binds to IscS, displacing Fdxox. Attack by a free cysteine of the scaffold protein on C328–S–S• leads to the production of IscU:S2–:Fe3+:S•. Subsequent interaction with IscX:Fe2+ would lead to the reduction of S• and the transfer of Fe3+ to IscU followed by assembly of the 2Fe–2S cluster. The released IscX would could then bind to IscS and inhibit the desulfurase reaction until IscU[2Fe–2S] is carried away by HscB. The above mechanism employs only proteins encoded by the isc operon.
Figure 10.
Proposed mechanism for the ISC Fe–S cluster assembly that is mediated by IscX as an iron supplier and as a regulator of cysteine desulfurase (IscS). The species S• is bound to the sulfur of a cysteine residue of either IscS or IscU as indicated, and S2–:Fe3+ is bound to a cysteine residue of IscU as Cys–S–Fe–S. See the text for details of each step.
Eukaryotes do not have an IscX homologue. It appears that frataxin, which has been shown to be essential to Fe–S cluster biosynthesis, evolved to take the place of IscX.17 The mechanism of eukaryotic Fe–S cluster assembly also differs from the bacterial mechanism in that frataxin increases the activity of the eukaryotic cysteine desulfurase (Nfs1).37
Acknowledgments
We thank Xiaobing Xuo (Advanced Photon Source, Argonne National Laboratory) for his help in collecting SAXS data. We also thank W. Milo Westler (National Magnetic Resonance Facility at Madison) for providing models of disordered conformations of IscU from molecular dynamics simulations and George H. Reed for helpful comments. This work was supported by NIH grant U01 GM94622. NMR and SAXS data were collected at the National Magnetic Resonance Facility at Madison funded by NIH grants P41 GM103399, P41 RR02301-27S1, and S10 RR027000. Additional SAXS data were collected at the Advanced Photon Source, an Office of Science User Facility operated for the U.S. Department of Energy (DOE) Office of Science by Argonne National Laboratory, supported by the U.S. DOE under contract no. DE-AC02-06CH11357. J.R.B. was supported by a Ruth L. Kirschstein National Research Service Award (F32 GM110939).
Supporting Information Available
Description of the procedures used to produce unlabeled and 15N-labeled IscX; a table summarizing the SAXS data; a figure showing Guinier plots of experimental data; a figure showing the simulated effect of incomplete saturation on SAXS results for protein–protein complexes; a figure showing the calculated effect of partial disorder in the structure of IscU on SAXS results for the IscU–IscS complex; a figure showing the ability of SAXS data alone to distinguish ternary complex formation; NMR spectra showing interactions between IscX and iron; and full UV–vis spectra showing the time course of Fe–S cluster assembly reactions. This material is available free of charge via the Internet at http://pubs.acs.org.
Author Contributions
§ These authors contributed equally.
The authors declare no competing financial interest.
Funding Statement
National Institutes of Health, United States
Supplementary Material
References
- Beinert H.; Holm R. H.; Munck E. Science 1997, 277, 653. [DOI] [PubMed] [Google Scholar]
- Johnson D. C.; Dean D. R.; Smith A. D.; Johnson M. K. Annu. Rev. Biochem. 2005, 74, 247. [DOI] [PubMed] [Google Scholar]
- Roche B.; Aussel L.; Ezraty B.; Mandin P.; Py B.; Barras F. Biochim. Biophys. Acta 2013, 1827, 455. [DOI] [PubMed] [Google Scholar]
- Lill R.; Muhlenhoff U. Annu. Rev. Biochem. 2008, 77, 669. [DOI] [PubMed] [Google Scholar]
- Lill R.; Hoffmann B.; Molik S.; Pierik A. J.; Rietzschel N.; Stehling O.; Uzarska M. A.; Webert H.; Wilbrecht C.; Muhlenhoff U. Biochim. Biophys. Acta 2012, 1823, 1491. [DOI] [PubMed] [Google Scholar]
- Smith A. D.; Agar J. N.; Johnson K. A.; Frazzon J.; Amster I. J.; Dean D. R.; Johnson M. K. J. Am. Chem. Soc. 2001, 123, 11103. [DOI] [PubMed] [Google Scholar]
- Kim J. H.; Frederick R. O.; Reinen N. M.; Troupis A. T.; Markley J. L. J. Am. Chem. Soc. 2013, 135, 8117. [DOI] [PMC free article] [PubMed] [Google Scholar]
- Yan R.; Konarev P. V.; Iannuzzi C.; Adinolfi S.; Roche B.; Kelly G.; Simon L.; Martin S. R.; Py B.; Barras F.; Svergun D. I.; Pastore A. J. Biol. Chem. 2013, 288, 24777. [DOI] [PMC free article] [PubMed] [Google Scholar]
- Vickery L. E.; Cupp-Vickery J. R. Crit. Rev. Biochem. Mol. Biol. 2007, 42, 95. [DOI] [PubMed] [Google Scholar]
- Chandramouli K.; Johnson M. K. Biochemistry 2006, 45, 11087. [DOI] [PMC free article] [PubMed] [Google Scholar]
- Kim J. H.; Füzéry A. K.; Tonelli M.; Ta D. T.; Westler W. M.; Vickery L. E.; Markley J. L. Biochemistry 2009, 48, 6062. [DOI] [PMC free article] [PubMed] [Google Scholar]
- Kim J. H.; Tonelli M.; Frederick R. O.; Chow D. C.; Markley J. L. J. Biol. Chem. 2012, 287, 31406. [DOI] [PMC free article] [PubMed] [Google Scholar]
- Kim J. H.; Tonelli M.; Markley J. L. Proc. Natl. Acad. Sci. U. S. A. 2012, 109, 454. [DOI] [PMC free article] [PubMed] [Google Scholar]
- Adinolfi S.; Iannuzzi C.; Prischi F.; Pastore C.; Iametti S.; Martin S. R.; Bonomi F.; Pastore A. Nat. Struct. Mol. Biol. 2009, 16, 390. [DOI] [PubMed] [Google Scholar]
- Prischi F.; Konarev P. V.; Iannuzzi C.; Pastore C.; Adinolfi S.; Martin S. R.; Svergun D. I.; Pastore A. Nat. Commun. 2010, 1, 95. [DOI] [PMC free article] [PubMed] [Google Scholar]
- Shimomura Y.; Takahashi Y.; Kakuta Y.; Fukuyama K. Proteins 2005, 60, 566. [DOI] [PubMed] [Google Scholar]
- Pastore C.; Adinolfi S.; Huynen M. A.; Rybin V.; Martin S.; Mayer M.; Bukau B.; Pastore A. Structure 2006, 14, 857. [DOI] [PubMed] [Google Scholar]
- Tokumoto U.; Nomura S.; Minami Y.; Mihara H.; Kato S.; Kurihara T.; Esaki N.; Kanazawa H.; Matsubara H.; Takahashi Y. J. Biochem. 2002, 131, 713. [DOI] [PubMed] [Google Scholar]
- Hoff K. G.; Silberg J. J.; Vickery L. E. Proc. Natl. Acad. Sci. U. S. A. 2000, 97, 7790. [DOI] [PMC free article] [PubMed] [Google Scholar]
- Delaglio F.; Grzesiek S.; Vuister G. W.; Zhu G.; Pfeifer J.; Bax A. J. Biomol. NMR 1995, 6, 277. [DOI] [PubMed] [Google Scholar]
- Goddard T. D.; Kneller D. G.. SPARKY 3 computer program, version 3.113; University of California: San Francisco, CA, 2006.
- Petoukhov M. V.; Franke D.; Shkumatov A. V.; Tria G.; Kikhney A. G.; Gajda M.; Gorba C.; Mertens H. D. T.; Konarev P. V.; Svergun D. I. J. Appl. Crystallogr. 2012, 45, 342. [DOI] [PMC free article] [PubMed] [Google Scholar]
- Svergun D. I. J. Appl. Crystallogr. 1992, 25, 495. [Google Scholar]
- Franke D.; Svergun D. I. J. Appl. Crystallogr. 2009, 42, 342. [DOI] [PMC free article] [PubMed] [Google Scholar]
- Shi R.; Proteau A.; Villarroya M.; Moukadiri I.; Zhang L.; Trempe J. F.; Matte A.; Armengod M. E.; Cygler M. PLoS Biol. 2010, 8, e1000354. [DOI] [PMC free article] [PubMed] [Google Scholar]
- Volkov V. V.; Svergun D. I. J. Appl. Crystallogr. 2003, 36, 860. [Google Scholar]
- Petoukhov M. V.; Svergun D. I. Biophys. J. 2005, 89, 1237. [DOI] [PMC free article] [PubMed] [Google Scholar]
- Svergun D.; Barberato C.; Koch M. H. J. J. Appl. Crystallogr. 1995, 28, 768. [Google Scholar]
- Rambo R. P.; Tainer J. A. Nature 2013, 496, 477. [DOI] [PMC free article] [PubMed] [Google Scholar]
- Pelikan M.; Hura G. L.; Hammel M. Gen. Physiol. Biophys. 2009, 28, 174. [DOI] [PMC free article] [PubMed] [Google Scholar]
- Mylonas E.; Svergun D. I. J. Appl. Crystallogr. 2007, 40, S245. [Google Scholar]
- Cupp-Vickery J. R.; Urbina H.; Vickery L. E. J. Mol. Biol. 2003, 330, 1049. [DOI] [PubMed] [Google Scholar]
- Kim J. H.; Tonelli M.; Kim T.; Markley J. L. Biochemistry 2012, 51, 5557. [DOI] [PMC free article] [PubMed] [Google Scholar]
- Ramelot T. A.; Cort J. R.; Goldsmith-Fischman S.; Kornhaber G. J.; Xiao R.; Shastry R.; Acton T. B.; Honig B.; Montelione G. T.; Kennedy M. A. J. Mol. Biol. 2004, 344, 567. [DOI] [PubMed] [Google Scholar]
- Dai Z.; Tonelli M.; Markley J. L. Biochemistry 2012, 51, 9595. [DOI] [PMC free article] [PubMed] [Google Scholar]
- Markley J. L.; Kim J. H.; Dai Z.; Bothe J. R.; Cai K.; Frederick R. O.; Tonelli M. FEBS Lett. 2013, 587, 1172. [DOI] [PMC free article] [PubMed] [Google Scholar]
- Bridwell-Rabb J.; Iannuzzi C.; Pastore A.; Barondeau D. P. Biochemistry 2012, 51, 2506. [DOI] [PMC free article] [PubMed] [Google Scholar]
- Agar J. N.; Krebs C.; Frazzon J.; Huynh B. H.; Dean D. R.; Johnson M. K. Biochemistry 2000, 39, 7856. [DOI] [PubMed] [Google Scholar]
- Mihara H.; Esaki N. Appl. Microbiol. Biotechnol. 2002, 60, 12. [DOI] [PubMed] [Google Scholar]
Associated Data
This section collects any data citations, data availability statements, or supplementary materials included in this article.


