

Abstract
Immunohistochemistry-based clinical diagnoses require invasive core biopsies and use a limited number of protein stains to identify and classify cancers. Here, we introduce a technology that allows analysis of hundreds of proteins from minimally invasive fine needle aspirates (FNA), which contain much smaller numbers of cells than core biopsies. The method capitalizes on DNA-barcoded antibody sensing where barcodes can be photo-cleaved and digitally detected without any amplification steps. Following extensive benchmarking in cell lines, this method showed high reproducibility and achieved single cell sensitivity. We used this approach to profile ~90 proteins in cells from FNAs and subsequently map patient heterogeneity at the protein level. Additionally, we demonstrate how the method could be used as a clinical tool to identify pathway responses to molecularly targeted drugs and to predict drug response in patient samples. This technique combines specificity with ease of use to offer a new tool for understanding human cancers and designing future clinical trials.
Introduction
An increasing number of cancer trials require tissue biopsies to measure individual drug response markers (1). Surgically harvested tissues are often used to collect data at two ends of the cellular spectrum: 1) genomic analyses that reveal driver oncogenes and specific mutations (2) and 2) protein analyses of handpicked biomarkers intended to monitor cellular responses (3, 4). Ideally, clinical samples are collected serially to monitor change in expression levels of key proteins. This raises many challenges, notably risk of morbidity with repeat core biopsies, increased cost, and logistical limitations. Alternative sample collection methods include fine needle aspirates (FNA), “liquid biopsies” of circulating tumor cells, or analysis of scant cells present in other easily harvested fluids. However, these samples have much lower cell numbers than biopsies, thereby limiting the number of proteins that can be analyzed.
After tissues have been sampled, selecting ubiquitous biomarkers can be difficult due to heterogeneity and dynamic network changes. Typically, small molecule drugs influence more than one target protein while numerous proteins modulate downstream specific drug actions, trigger alternative molecular pathways, and induce tumor cell death or resistance (5). The current tools to profile these key proteins in scant clinical samples are limited; standard practice encompasses immunocytology, which often precludes broad protein analysis due to insufficient sample within FNAs or liquid biopsies (6). Thus, the number of markers is often limited (<10) and requires time-consuming analyses of tissue sections by specialists. Proteomic analyses by mass spectrometry has seen a number of advances over the years, but remains technically challenging for single cells, phosphoproteomic detection, and is costly for routine clinical purposes (7). In research settings, multiplexed flow cytometry and mass cytometry have been used to examine an expanded set of markers (10 to 45) using single cell populations. Multiplexed flow cytometry often encounters limits in the amount of markers it can measure due to spectral overlap. Mass cytometry vaporizes cells during sample preparation, resulting in sample loss (8). In both these methods, it is currently not possible to isolate a rare cell of interest or perform concurrent genetic analyses once samples are used for proteomic analyses.
We designed an antibody barcoding with photocleavable DNA (ABCD) platform to perform multiplexed protein measurements and systems-wide profiling on small amounts of clinical sample material (~100 cells). Importantly, we designed the method to preserve genetic material, and to enable specific isolation of rare, single cells. This approach interrogates single cells by tagging antibodies of interest with short (~70mer) DNA “barcodes”—with each antibody having a unique sequence—using a stable photocleavable linker (9). After antibody binding to the cells, the photocleavable linker releases the unique DNA barcode, which can then be detected by various means. Previously, we identified different DNA barcodes based on size using gel electrophoresis. However, this method had limited multiplexing (8 to 12 markers), and was only semi-quantitative (9). Other quantitative methods, such as sequencing and quantitative PCR (qPCR), are reliable but introduce bias during amplification steps, require prolonged processing time, or are not cost-effective. Multiplexed qPCR only measures a maximum of 5 markers at a time. We thus opted for a fluorescent hybridization technology traditionally used for multiplexed quantitation (16,384 barcodes) of femtomolar amounts of DNA and RNA (10, 11); however, this method had not been previously extended to measure proteins within cells or clinical samples. We initially validated ABCD in cell lines before applying the assay to human clinical specimens, with a specific interest in evaluating drug treatment response and inter- and intra-patient heterogeneity in lung cancer.
RESULTS
Platform development and validation
We first harvested cells procured from FNAs from a given patient (Fig. 1A). To better isolate cancer cells from their heterogeneous cellular milieu, we labeled aspirates with antibodies directed against established markers (e.g. CD45 to deplete tumor infiltrating leukocytes from the sample). The antibody was tagged with magnetic nanoparticles and passed through a microfluidic device containing a self-assembled magnetic layer to deplete tagged cells (12). The purified cancer cell population was retrieved from the device and stained with a cocktail of antibody conjugates (table S1), each containing a unique barcode attached via photo-cleavable linkers (Fig. 1B; fig. S1). In our case, we chose over 90 antibodies in the cocktail after careful demonstration that bulk labeling yielded similar results to single antibody labeling. The 90 antibody-DNA conjugates were specially designed to tag an “alien” DNA sequence that would not cross react with the human genome. Target markers were selected to cover hallmark pathways in cancer (apoptosis, epigenetic, DNA damage), cancer diagnostic markers commonly used in the clinic, and housekeeping and control proteins. Prior to labeling, antibody-DNA conjugates were isolated via IgG-specific pull down and pooled together into a cocktail. Following cell blocking, permeabilization and labeling, and washing, the DNA was released from the cells of interest with both proteolytic cleavage and photocleavage to increase yield and by extension, sensitivity (Fig. 1C).
Figure 1. Multiplexed protein analysis in single cells.

(A) Cells were harvested from cancer patients by FNA. In this case, a heterogeneous population of EpCAM-positive cancer cells (green) is displayed alongside mesothelial cells (red) with nuclei shown in blue (Hoechst) from an abdominal cancer FNA. Cancer cells were enriched and isolated via magnetic separation in PDMS microfluidic devices with herringbone channels using both positive (e.g. EpCAM+/CK+) and negative (e.g. CD45−) selection modes. (B) Cells of interest were incubated with a cocktail of DNA-conjugated antibodies containing a photo-cleavable linker (fig. S1) to allow DNA release after exposure to ultraviolet light. (C) DNA-antibody conjugates released from lysed cells (fig. S2) were isolated using size-separation and IgG pull-down. Released “alien” DNA barcodes were processed with a fluorescent DNA barcoding platform (NanoString). Fluorescent barcodes were hybridized and imaged using a CCD camera. The quantified barcodes were translated to protein expression levels by normalizing to DNA per antibody and housekeeping proteins and subtracting non-specific binding from control IgGs. A representative profile of SKOV3 ovarian cancer cell lines shows high CD44 and high Her2 expression, characteristic of this cell line.
We first tested the antibody-DNA conjugates in MDA-MB-231 (human breast cancer) cells. Cells were blocked to prevent nonspecific DNA or antibody labeling and then “stained” with the pooled cocktail following techniques akin to standard flow cytometry staining. Next, DNA was released with a light pulse, hybridized to fluorescent barcodes and imaged on a cartridge via a charge-coupled imaging device (NanoString Technologies). Several DNA conjugation and release methods were tested and optimized; ultimately, the photocleavable linker was selected for its superior performance (figs. S1 and S2). Probe quantification translated into proteomic sample profiling (Fig. 1C) by normalizing according to DNA per antibody and housekeeping proteins (fig. S3). On average, there were 3–5 DNA fragments per antibody; markers were thresholded based on non-specific binding of IgG controls.
Repeated analyses showed consistent results across different batches of cells analyzed on different days and over time (Fig. 2). In subsequent studies, antibodies that did not fall above 1.2-fold control IgG threshold were not included [e.g. here, di-methyl-histone H3 (Lys4)]. Excluding these outliers, the median standard error across all antibodies was 6%. A profile of the human MDA-MB-231 line was derived from just 50 cells and showed expected results, such as high keratin 7 and EGFR expression, two diagnostic markers commonly used in pathology labs to identify cancer subtypes. Epigenetic and phosphoproteomic markers have lower expression, as these naturally occur at lower abundance in cells relative to extracellular markers. Intracellular markers such as phosphorylated Src (pSRC), and phosphorylated glycogen synthase kinase 3β (pGSK3b) could be robustly detected with the optimized permeabilization method (fig. S4).
Figure 2. Multiplexed protein profiling of a human breast cancer cell line.
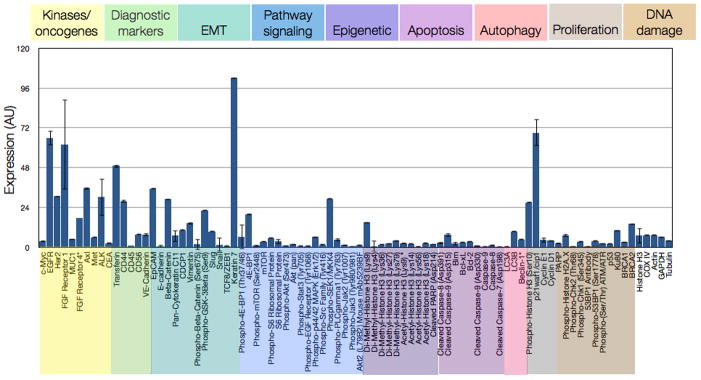
Representative example of 88 different antibodies spanning cancer-relevant pathways (color-coded) profiled in triplicate (mean ± SEM) on the MDA-MB-231 triple-negative breast cancer cell line. DNA counts were converted to protein binding by normalizing to the amount of DNA per antibody. Non-specific binding from expression of six control IgGs was subtracted and expression was normalized by housekeeping proteins Cox IV, histone H3, tubulin, actin, and GAPDH (far right).
Additional benchmarking experiments were performed to demonstrate assay consistency and reproducibility. Conjugated antibodies behaved similarly to native, unmodified antibodies as evidenced by head-to-head comparison on flow cytometry (fig. S5A). Similar results were found when testing intracellular antibodies such as p53 and phospho-s6 ribosomal protein with dot blots and immunoblotting (fig. S5B). Antibody-DNA conjugates generated equal or stronger signals compared to native antibodies on dot blots. Furthermore, the DNA-modified antibodies showed similar expression patterns across cell lysates when compared to native antibody. To test reproducibility, we also showed that two DNA-modified antibody clones specific to the same target (i.e. epithelial cell adhesion molecule, EpCAM), gave nearly identical expression levels (R2 = 0.99) across multiple cell lines and clinical samples (fig. S6A). Antibody staining was tested using both a cocktail of 60+ antibodies and as single agent; expression levels from both methods, as measured by ABCD, showed high, linear correlation (R2= 0.93; fig. S6B). Protein marker changes measured with the ABCD platform linearly correlated to expression changes measured by independent immunofluorescence studies in taxol-treated HT1080 fibrosarcoma cells (fig. S6C). Finally, flow cytometry measurements across eight cell lines and six different markers showed linear correlations (R2 = 0.92–0.99) (fig. S7).
Single cell sensitivity
Sensitivity of the ABCD platform was assessed by detecting across varying cell numbers (50, 15, 10, or 5 cells) from a bulk sample of 500,000 cells, in multiple repeats, by serial dilution (Fig. 3A). The correlations between bulk and diluted DNA counts were linear, with correlation coefficients >0.9 (Fig. 3B). Additional experiments were performed to validate the ABCD platform in single human A431 cells. Figure 3C displays expression levels of 90 analyzed proteins for four randomly chosen single cells and in bulk samples. Consistent with literature (13), we witnessed some intercellular heterogeneity, but generally, single cell profiles matched their respective bulk profiles with correlations as high as 0.96 and as low as 0.63. Multinucleated cells were excluded; cells were otherwise selected at random.
Figure 3. Detection sensitivity using a human epidermal cancer cell line.

(A) A bulk 500,000 cells from the epidermoid carcinoma cell line A431 was lysed and processed as shown in Fig. 1. Dilutions corresponding to 5, 15, and 50 cells were then compared to the bulk measurement. (B) Correlation values for single A431 cells selected by micromanipulation are compared to the bulk measurements (500,000 cells). (C) Protein expression profiles (log 2 expression values) of four single cells compared with the bulk sample. Correlations were highly significant when comparing all single cells to bulk measurements (p<.0001, paired t-test, GraphPad Prism 6.0).
To demonstrate biological variation at the single cell level, we compared untreated single human A431 cells to cells treated with gefitinib—a selective tyrosine kinase inhibitor of the epidermal growth factor receptor (EGFR). Unsupervised clustering of single cells showed unique patterns for treated and untreated groups (fig. S8A). A431 cell lines over-express EGFR and are highly sensitive to gefitinib (IC50 = 100 nM), as evidenced by widespread pathway inhibition in gefitinib-treated A431 cells. We applied a threshold at the single-cell level to ensure that marker expression levels were detectable above all six IgG controls for all cell lines. The majority of the panel was still detectable, though some markers such as phosphorylated EGFR (pEGFR) fell below threshold levels in some cells, and thus were not included for hierarchical clustering. Nevertheless, pairwise comparisons between the two cohorts showed significant changes in key markers (fig. S8B) such as phospho-s6 ribosomal protein (p-S6RP), Ku80 and phospho-histone H3 (p-H3), also consistent with literature (14, 15). Unlike most signaling inhibition studies, the untreated cell line was not pre-stimulated with epidermal growth factor (EGF) prior to treatment. As such, the assay conditions mimicked natural signaling variability to better approximate patient samples.
Measuring inter- and intra-tumoral heterogeneity in clinical samples
To demonstrate the clinical capabilities of ABCD and explore single-cell heterogeneity, we obtained FNAs from patients with lung adenocarcinoma. Single-pass FNA samples were initially processed using antibody-mediated magnetic selection to isolate EpCAM-positive cells. Single cells for subsequent analyses were harvested via micromanipulation while other sample debris was removed. In one representative patient, protein marker expression in 11 single cells (EpCAM+/DAPI+/CD45−) correlated with bulk measurement (approximately 100 remaining cells from FNA) (Fig. 4A). Yet overall, correlation between patient cells and bulk FNA were lower and varied compared to single cells from cell lines and their respective bulk in Fig. 3. The highest correlation with the bulk measurement was 0.79 (cell culture showed R= 0.96), while the lowest value was 0.43 (Fig. 4B).
Figure 4. Single-cell protein analysis in a patient sample.

An FNA was obtained from a patient with biopsy-proven lung adenocarcinoma. (A) Eleven harvested cells were analyzed individually, and protein expression levels in each cell (y-axis) were correlated with expression levels from the bulk tumor sample (x-axis). Each data point represents the expression for a given marker (n= 85 markers, 3 below detection threshold). (B) Spearman R correlation coefficient values for each of the single cells in (A) relative to each other and to the bulk measurement.
We next determined inter-patient heterogeneity in bulk samples from six patients with biopsy-proven lung adenocarcinoma (Fig. 5). Although these cancers harbored identical histopathology, proteomic profiling revealed clear differences, even in this small cohort. Marker panels were chosen to evaluate protein heterogeneity across a broad range of functional protein networks (16) relevant for therapy assessment. Figure 5 shows visual similarity among Patients 1, 2, and 5 (Spearman R1,2 = 0.94, R1,5 = 0.96, R2,5 = 0.95). This partially concurred with genotyping as both Patients 1 and 2 had EGFR T790M mutations whereas Patient 5 had a KRAS mutation (KRAS 35G>T). This suggests that different genotypes may still yield similar proteomic phenotypes. Patients 3, 4, and 6 harbored distinct proteomic profiles and differing mutations (Fig. 5). Patient 3 had an exon 20 EGFR mutation while patient 4 had an EGFR L858R mutation and an additional BRAF mutation. Patient 6 was noted to have an EML4-ALK translocation.
Figure 5. Inter-patient heterogeneity in lung cancer.

FNAs were obtained from six patients with biopsy-proven lung adenocarcinoma, and bulk samples (~100 cells each) were processed as shown in Fig. 1 with 88 barcoded antibodies. Expression data were log2 normalized by row to show differences between each patient. Note the heterogeneity in expression profiles despite the identical histological type (upon genetic analysis, it was noted that patients 1 and 2 had EGFR exon 19 amplification and T790m mutations, patient 3 had an exon 20 EGFR mutation, patient 4 had an EGFR L858R mutation and an additional BRAF mutation, patient 5 had a KRAS mutation, and patient 6 had an EML4-ALK translocation).
Protein clustering also revealed possible personalized targets (Fig. 5). For example, Patient 4 (EGFR/BRAF mutant) had high phospho-ERK1/2 and phospho-s6rp, as expected for a patient with an EGFR L588R mutation; however, this patient also showed a high level of the DNA repair/damage markers poly (ADP-ribose) polymerase (PARP), Ku80, and pH2A.x expression, suggesting that PARP inhibitors or DNA damaging agents (e.g. cisplatin) could be effective in this case. Such information could complement pharmacogenomics.
In vitro discrimination of pathway analyses during treatment
Having established feasibility of inter- and intra-patient analyses in clinical samples, we sought to explore the feasibility of monitoring cancer treatment over time. We first confirmed that we could discriminate known pathway responses to different drug treatments. Triple-negative breast cancer cells (MDA-MB-436) treated with kinase inhibitors (gefitinib, PKI-587), antibody drugs (cetuximab), and DNA-damaging drugs (olaparib, cisplatin) showed profiles that clustered according to drug mechanism of action (Fig. 6A). As a control study, cell lines with cetuximab resulted in expected drug inhibition (fig. S9B). We demonstrated expected protein inhibition in drug-sensitive human cancer cell lines using optimized drug doses and incubation times. Notable examples include phospho-S6-ribosomal protein (pS6RP) for targeted treatments; pH2A.X, pATM/ATR substrate, and cleaved PARP for DNA damaging agents. We also found unexpected results, such as epigenetic histone modifications following treatment with a PI3K inhibitor (PI3Ki) (fig. S9E). For additional in vitro validation of treatment, we treated HT1080 fibrosarcoma cell lines with 4 different doses of taxol. Several panel markers displayed dose response changes to taxol treatment, including phospho-ERK and phospho-cyclin D.
Fig. 6. Effect of different therapies on protein expression profiles in MDA-MB-436 triple negative breast cancer cell line.

(A) MDA-MB-436 cells were treated with different agents and marker proteins were measured. Unsupervised hierarchical clustering based on Euclidean distance grouped drug treatments by their mechanisms of action (molecularly targeted vs. DNA-damaging) and primary targets (EGFR for gefitinib/cetuximab and mTOR/PI3K for PKI-587). Data shows the log2 fold change of marker expression in treated compared to untreated cells for n = 84 markers. All experiments were performed in triplicate. (B) Correlating drug sensitivity of 4 different cell lines with proteomic profile changes following treatment with cisplatin and olaparibs. IC50 values (black bars) were calculated based on viability curves (fig. S9A). The cell profile change after treatment is represented by the number of significant markers (grey bars) that were identified by a pairwise t-test of treated vs. untreated samples (FDR = 0.1).
Proteomic profiling of olaparib and cisplatin treatments was performed for four human cancer cell lines, showing varying drug sensitivities as measured by viability assays (Fig. 6; fig. S9A). We quantified the degree of change in protein profiles by calculating the number of markers that were significantly different from the untreated condition using pairwise t-testing (FDR = 0.1). This profiling confirmed that global pharmacodynamic changes correlated with treatment sensitivity: as IC50 values decreased, the number of protein markers with significant changes increased (Fig. 6B). In fact, for resistant cell lines (e.g. OVCA429), no significant changes were detected. We also saw expected changes in DNA damage and apoptosis markers, such as degradation of Bim and up-regulation of pERK (fig. S9B, left two panels), confirming previous studies of DNA damage response to cisplatin treatment (17).
Finally, to test the assay’s ability to measure even small marker changes, we treated HT1080 human fibrosarcoma cells with taxol at five different doses. Marker changes at high doses were compared to marker changes quantified by an independent immunofluorescence screen (fig. S10A). Several protein markers showed dose response curves, including CDCP1, phosphor-cyclin D, cyclin E1, fibroblast growth factor 4 (FGF4), BRCA2, and pERK1/2. These in vitro studies established that our marker panel could indeed measure pathway changes in response to varying drug mechanisms; furthermore, these changes could be detected in a sensitive, dose-dependent manner. Additionally, pairwise t-tests between the dosed and untreated cells showed an increase in significant marker changes at the highest dose (700 nM taxol) compared to the lower 70 nM dose (fig. S10, B and C).
Monitoring PI3Ki treatment response in cancer patients
Ultimately, we seek to translate these pathway analyses to patient samples, in particular to analyze serial biopsies in early phase clinical trials with the goal to better assess drug efficacy and dosage. However, such invasive procedures can introduce risk of morbidity and high costs. The ability to analyze small numbers of cells from alternative sources (e.g. FNAs) becomes paramount when responsive tumors shrink after treatment, making repeat biopsies difficult. As proof of concept, we performed scant cell analyses in 4 patients before and after PI3Ki treatment during Phase I dose escalation trials (Fig. 7A). Pre-treatment samples were collected the day before the first drug dose; post-treatment samples were collected at the end of the second treatment cycle. Collection and processing occurred over the course of a year to correlate profiles to patient response. All four patients had metastatic cancers of various subtypes and were selected based on genetic PI3K mutations that could predispose their tumors to pathway inhibition using PI3Ki treatment. In all, two patients responded and two progressed. Data analysis was performed in a blinded manner. As expected, unsupervised clustering separated out two groups of responders vs. non-responders (Fig. 7A). Interestingly, among the two responders, one patient showed larger fold-changes across the marker panel. Subsequent unblinding revealed that this patient received a higher dose of the drug during Phase I dose-escalation than the other responding patient. Additional patient samples beyond this proof-of-principle work will be needed to measure ABCD’s clinical impact during drug dosing pathway studies.
Figure 7. Monitoring and predicting treatment response in patients receiving PI3K inhibitors.

(A) Profiles of five drug-naïve cancer patients are shown with clustering based on correlation metrics with weighted linkage. The dotted box shows cluster including the marker that best separated responders and non-responders (H3K79me2). Other markers in the cluster include pS6RP (a downstream target of PI3K), phospho-H2A.X (DNA damage marker), PARP (DNA repair protein) and 4EBP1 (protein translation).(B) Four patients with biopsy-proven adenocarcinoma were treated with PI3Ki, and primary cancers were biopsied before and after treatment. The heat map is a pre–post treatment difference map showing log2 fold changes in protein expression (normalized by row to highlight differences between patients). Patient segregation is by correlation distance metric (weighted linkage). The patient in the third column received a higher dose of the PI3Ki (400 mg b.i.d.) than the patient in the fourth column (150 mg b.i.d.).
The screen could potentially help predict clinical outcome or identify promising markers of treatment response. To demonstrate this, we profiled 5 drug-naïve patients, all with various PI3K mutations, who eventually received small-molecule PI3Ki treatment. We categorized patients as non-responders or responders (Fig. 7B), and employed a marker-ranking algorithm to determine top differential markers. The top marker, dimethylation of histone H3 lysine 79 (H3K79me2), clustered with several markers: pS6RP (a known downstream target of PI3K and an emerging key biomarker of treatment response (14), phospho-H2A.X, and PARP. According to canonical pathway signaling, selecting epigenetic or DNA damage markers as readouts of PI3K treatment response, would not be an intuitive decision. DNA damage and epigenetic marker changes were also identified by in vitro profiling of a PI3Ki (fig. S7B). This cluster covered diverse proteins across various pathways: epigenetic changes, DNA damage, and growth and survival pathways (PI3K, MAPK), demonstrating the potential value of systems-wide profiling for developing better companion diagnostics during treatment.
DISCUSSION
We developed an amplification-free method capable of sensing hundreds of proteins in human cells by using DNA-barcoded antibodies coupled with highly sensitive optical readouts. Cell labeling, washing and analysis can be completed within hours, making same-day protein analysis possible. The method measures more markers on limited material than immunohistochemistry, and preserves genetic material from samples, which is not possible with traditional tools like multiplexed cytometry (18). The protein coverage described here can be extended to include additional protein targets through antibody-DNA conjugations, resulting in a scalable, multiplexed protein screening platform.
In general, the method can provide insight into protein expression levels both for single and bulk cell populations. Our in vitro studies showed that single cells from cell lines showed higher correlation to bulk measurements than single cells isolated from patient tumors. In FNAs, the single cells also showed higher correlations with each other than with the bulk population. This could be because an averaged bulk measurement is less likely to correlate strongly with a single clonal phenotype. These findings reaffirm that current cell culture models are an insufficient estimate of proteomic heterogeneity in clinical samples. The ABCD platform tool is therefore particularly impactful for its ability to study rare single cells in clinical samples, such as circulating tumor cells, stem cells, and immune cell populations. We found that even scarce proteins, such as 53BP1 and phospho-histone H2A.X, could be detected at the single-cell level. Large-scale protein mapping of isolated, rare cells and clonal populations could shed insight into cancer heterogeneity, drug resistance, and the clinical utility of circulating tumor cells. Intra-tumoral heterogeneity may itself be a biomarker of poor clinical outcome (19). Establishing causal and reactive correlations between diseases and altered biomarkers could also radically improve physicians’ abilities to diagnose and treat patients (20, 21).
We also demonstrated the method’s ease-of-use, reproducibility, compatibility with clinical applications, such as profiling of FNA cancer samples, and its translational potential to monitor cancer treatment as demonstrated in 4 patients. Proof-of-concept case studies showed that broader profiling can improve understanding about potentially useful companion diagnostic biomarkers and help explore how drug dosing corresponds to cellular pharmacodynamics. Smarter protein-marker selection, as demonstrated by the ABCD platform, could dramatically reduce drug development costs, narrow patient cohorts, and improve clinical trial design.
This method could complement other single cell proteomic techniques, such as mass cytometry and fluorophore inactivated multiplexed immunofluorescence (8, 22). A major advantage of the ABCD platform is that both genetic material and protein barcodes can be concurrently extracted from a single sample, thus paving the way for more biologically relevant analyses of protein-DNA-RNA interrelationships. Such integrative measurements could explain “missing pieces” in the cancer genomics puzzle. For example, in this study, not all patients with PIK3CA DNA mutations responded to a given PI3Ki; this is consistent with clinical experience (23, 24). However, proteomic biomarkers revealed differential changes between responding and non-responding cohorts. These examples suggest that protein profiling will help complement genotyping to shape therapeutic advances for cancer and other diseases.
The current study also demonstrated proof of principle that the technology can work in clinical samples with a wide range of potential applications, including rare cell profiling and companion diagnostics within cancer clinical trials. Yet, we believe the platform could be further enhanced by future modifications. For example, the method could be adapted to work with both whole cells and cell lysates, and DNA could be quantified with other read outs (e.g. sequencing) to perform simultaneous measurement of RNA, DNA, epigenetic, and protein expression. A limitation of the ABCD platform is the current lack of methods to rapidly isolate and measure entire populations of single cells. Additional components and wells could be added to microfluidic devices such as the one described to increase the throughput of single cell analysis. It is also challenging to validate single cell studies owing to the lack of a clear reference. With a higher-throughput device, future work could examine larger numbers of cells to compare population differences and spreads between this method and other gold standards (e.g. flow cytometry). Finally, in our clinical studies, we show evidence of promising companion diagnostic markers; however, the small sample size limits definitive conclusions about specific pathway markers underscoring the need for broader testing across cancer subtypes and therapeutics.
Moving forward, this technology could enable larger-scale studies to yield mechanistic insights into existing and/or novel therapeutic strategies. Moreover, the platform could also be used for rare, single cell (e.g. circulating tumor cells) profiling to derive further understanding of their biological and clinical relevance. Since genetic material from samples is preserved, the ABCD platform is well positioned to study proteins that interact with genetic regulatory elements such as microRNAs. In summary, this platform is ready for clinical exploration in research labs, academic hospitals, and pharmaceutical companies, to help propel drug trials and biological investigation.
MATERIALS AND METHODS
Study design
The objective of this research was to develop a multiplexed platform for detecting protein expression in clinical samples and in cell lines with a focus on understanding treatment response in cancer. We hypothesized that protein networks (as opposed to single biomarkers) will reveal interesting insights into how cancers evolve and respond to drugs.
Clinical studies were performed on limited cohorts of patients for proof-of-principle. We selected the number of patients based on a one year enrollment cycle (March 2012 to March 2013). All protein measurements were included as long as their signals were 1.2-fold higher than that of its corresponding non-specific IgG isotype. This threshold was set to be over three times the median standard error from the antibody cohorts pooled. Only antibodies that were validated (via flow cytometry measurements on cell lines) were included. All in vitro studies were performed in replicates (typically n = 3, unless otherwise specified). Following optimization, studies with the final protocol were repeated multiple times on different days to ensure consistency and reproducibility. All experiments on clinical studies were performed blinded during experimental procedures and raw data analysis.
Cell lines
Validation experiments were performed in the following cell lines, which were purchased from the American Tissue Culture Collection (ATCC): SKOV3, ES-2, OVCA429, UCI-107, UCI-101, TOV-112D, TOV-21G, A2780, MDA-MB-231, MDA-MB-436, A431 and HT1080. Cells were passaged in DMEM (Cellgro) or RPMI (Cellgro) as recommended by ATCC. TIOSE6 cell line was kindly provided by Dr. Michael Birrer (Massachusetts General Hospital). NOSE cell lines were derived from ovarian surface epithelium (OSE) brushings cultured in 1:1 Media 199:MCDB 105 (Sigma-Aldrich) with gentamicin (25 μg/ml) and 15% heat-inactivated serum. TIOSE6 cell lines were obtained by transfecting hTERT into NOSE cells maintained in 1:1 Media 199:MCDB 105 with gentamicin (25 μg/ml), 15% heat-inactivated serum and G418 (500 μg/ml) (25). After trypsinization, cells were immediately fixed with 1× Lyse/Fix buffer (BD Bioscience) for 10 minutes at 37°C and then washed twice with SB+ (phosphate buffered saline with 2% bovine serum albumin/BSA). The cells were aliquoted into tubes (~1×10⁶ cells/mL) and stored at −20° C until labeling. Biological replicates were seeded in different wells and collected separately. Cultured cells were processed and stored under the exact same conditions as clinical samples. A total of 276 samples were prepared and analyzed independently via the barcoding method.
Clinical samples
The study was approved by the Institutional Review Board at the Dana Farber/Harvard Cancer Center and informed consent was obtained from all subjects (n = 10). Fourteen minimally invasive procedures were performed on the 10 enrolled patients. Six patients had primary lung adenocarcinomas. The 4 patients undergoing PI3Ki treatment with repeated biopsies had carcinomas of varying origins in the abdomen, all with underlying PI3K mutations. All pre-treatment biopsies were collected in the week before the first cycle of treatment. All post-treatment biopsies were collected after a cycle was completed, typically after several weeks to months. Image-guided fine needle aspirates using a 22-G needle were obtained prior to routine core biopsies. Correct needle location was confirmed by CT imaging and real-time read-out by cytopathology. FNA samples were processed immediately by centrifugation and removal of excess PBS. If there were visual clumps present before the fixation step, collagenase (Sigma Aldrich) was added at 0.2 mg/ml. Cells were fixed with Lyse/Fix buffer (BD Biosciences) for 10 min at 37°C and washed twice with PBS with 2% BSA. All centrifugations were performed at 300 x g for 5 minutes. Clinical samples were stored at −20°C. A total of 24 samples were prepared and analyzed independently via the barcoding method.
Drug treatments of cell lines
To test the effect of drug treatment on protein expression levels, cell lines were treated with a number of different chemotherapeutic or molecularly targeted drugs. A431 cell lines were dosed with gefitinib (Selleck Chemicals) in media with 1% DMSO for 12 hours at a concentration of 10 μM. The triple-negative human breast cancer MDA-MB-436 cell line was dosed with the PARP inhibitor olaparib (10 μM in 0.1% DMSO in media), cisplatin (10 μM, 1% HBSS in media), PI3K/mTOR inhibitor PKI-587 (100 nM, 0.1% DMSO/media) and the EGFR inhibitors cetuximab (75 μg/ml in media) and gefitinib (10 μM in 0.1% DMSO/media). All molecularly targeted agents (PKI-587, cetuximab, gefitinib) were applied for 12 hours. DNA-damaging agents olaparib and cisplatin were applied to cells for 3 days. Changes in protein expression levels were compared to media controls under identical conditions but without drug treatment.
Flow cytometry
Flow cytometry was used to validate protein expression levels in bulk samples. Fixed cells stored at −20 °C were thawed and then permeabilized with a saponin-based buffer, PW+ (1X Perm/Wash PhosFlow Buffer, BD Biosciences, with 2% BSA). Approximately 200,000 cells per tube were incubated with primary antibodies for 1 hr at either 1 μg/ml or the appropriate dilution as recommended by Cell Signaling for flow cytometry applications. A complete list of primary antibodies is shown in table S1. After one wash with PW+, the appropriate secondary antibodies targeting mouse, human or rabbit IgG were applied. The specific secondary antibodies used were anti-rabbit IgG (H+L) F(ab′)2 Fragment Alexa Fluor 647 Conjugate (Cell signaling #4414), anti-mouse IgG (H+L) F(ab′)2 Fragment Alexa Fluor 647 (Cell signaling #4410) and anti-human FITC (Abcam ab98623). Expression levels for each protein were then calculated by normalizing the geometric mean from each antibody with the appropriate control IgG. These values were then correlated to the expression values derived from the DNA barcoding technique.
DNA-antibody conjugations
Antibodies listed in table S1 were conjugated to specially designed alien DNA sequences derived from the potato genome (table S4). The 70mer sequence length was selected for optimal hybridization with the Nanotring capture and reporter probes. Other sizes were tested as well. Shortening sequence length tended to improve signal but reduce hybridization capability. For example, although 50mer sequences gave relatively higher signals when compared to controls, 30mer sequences did not reliably hybridize. Thus, we selected 70mer sequences for reliable hybridization.
Antibodies (table S1), purchased from commercial sources, were initially purified from BSA and/or other contaminants using either a Zeba spin column or centrifugal filter. Antibodies were then incubated with photocleavable bifunctional linker in PBS (containing 5% DMF and 10% 0.1 M NaHCO3) at RT for 1.5 h. Afterwards, excess reagents were removed from maleimide-activated antibodies using a Zeba spin column (7 K MWCO, eluent: PBS).
Thiol-modified DNA oligos (from Integrated DNA Technologies) were reduced using dithiothreitol (DTT, 100 mM) in PBS (1 mM EDTA, pH 8.0) for 2 h at RT. The reduced DNA oligos were then purified using NAP-5 column (GE Healthcare), with de-ionized water as the eluent. The fractions containing DTT (determined using the microBCA assay) were discarded. The remaining reduced-DNA fractions were pooled and concentrated using a 3000 MWCO Amicon filter (Millipore).
The maleimide-activated antibodies were incubated with the reduced DNA oligos in PBS solution. In a typical conjugation process, 15-molar excess of DNA oligos were incubated with maleimide-activated antibodies. The conjugation reaction was allowed to proceed for 12 h at 4°C. DNA barcode-antibody conjugates were purified using a Millipore 100 K MWCO centrifugal filter followed by 3 washes with PBS. After the antibodies were mixed, a final purification of excess DNA was conducted using Protein A/G coated magnetic beads (Pierce/Thermo Scientific). The commercial protocol from Thermo for magnetic separation was only slightly modified to use a TBS/0.1% Tween wash buffer and a gentle Ag/Ab elution buffer (Thermo Scientific). Three elutions were performed for 20 minutes each. Solvent antibody was exchanged into pure TBS using a Zeba desalting column (7 K MWCO).
Antibody storage and characterization is described in Supplementary Methods.
Fluorescent read-out
All capture and fluorescent probes were obtained from NanoString Technologies to be compatible with its commercially available Prep/Analyzer station (nCounter Analysis System). Commercial protocols from NanoString for hybridization and detection from the DNA lysis sample were followed. In brief, DNA barcodes, capture probes and fluorescent probes were combined in PCR tubes with hybridization buffer, and incubated at 65°C for a minimum of 12h, before running the automated NanoString Prep and Analyzer Station in order to immobilize DNA probes onto a cartridge, image the area, and count fluorescent probes. A total of 276 sample runs were performed for optimization (n=132), cell line measurements (n = 96), clinical sample measurements (n=24), and single cell measurements and optimization (n=36).
Single cell isolation and processing
After antibody staining, single cells were picked using a micromanipulator. Cells were stained with Hoechst 3342 (Molecular Probes) and added to an open 10-cm dish and imaged using a TE2000 microscope (Nikon). Single cells were placed directly into a PCR tube. Five μL of lysis buffer/proteinase K were added (4.5 μL ATL buffer, 0.5 μL proteinase K). Lysis/enzymatic cleavage proceeded for 30 minutes at 56°C before photocleavage for 15 minutes. Reporter and capture probes (NanoString Technologies) were then directly added to this tube according to manufacturer’s recommendations.
Data analysis
Calculating proteomic expression profiles
Protein expression profiles were extracted from raw data as follows. First, raw DNA counts were normalized via the mean of the internal NanoString positive controls, which account for hybridization efficiency. These counts were then converted to antibody expression values using the relative DNA/Ab counts. Next, average background signal from control IgG was subtracted. Lastly, housekeeping genes were used for normalization that accounted for cell number variations. We normalized signals via beta-tubulin, which provided the most consistent result. For the taxol treatments we normalized via the geometric mean of histone H3, GAPDH, and actin rather than tubulin, because tubulin is a primary target of taxol. Data was transformed into log2 scale as denoted in captions.
Clustering
Heat maps and clustergrams were plotted using MATLAB with a matrix input of marker expression values that were calculated as detailed above. All shown clustergrams were performed as a weighted linkage and were clustered using correlation values as a distance metric. Some clustergrams were normalized by row, as specified in captions, to highlight marker differences among different patients. If a marker was not detectable in one of the patients, it was removed from the matrix or heatmap and is not displayed.
Statistical analysis
Raw data from Nanostring DNA counts were normalized by first using the nSolver analysis software to account for hybridization differences on the cartridge. Only positive controls A through D on the Nanostring software were used in normalization. DNA counts were within the linear range of detection and met all other criteria for inclusion as determined by the nSolver software (maximum fields of view, image quality, etc.). After determining an expression value by taking into account non-specific IgG binding and housekeeping genes (cell count), data was log2 transformed.
Correlation between single-cell analysis and bulk measurement was calculated in GraphPad Prism. Spearman r values were calculated without assuming a normal, consistent distribution. Two-sided P values were calculated, where significant markers were identified by comparing two groups (e.g. treated vs. untreated) in Prism and performing pairwise t-tests with an FDR of 0.2 for multiple test correction error. Significant marker changes and their P-values between gefitinib-treated and untreated A431 single cells are shown in Table S2. For heat maps, if any samples had markers below threshold, the entire marker row was removed (no imputed data values were used). To identify differentiating markers between responders and non-responders, we used a multi-class sequential forward selection ranking algorithm. We classified the patients as responders or non-responders based on known data. Class separability was measured by the Bhattacharya distance.
Supplementary Material
Fig. S1. Scheme of DNA-antibody conjugation.
Fig. S2. Optimizing lysis and blocking methods.
Fig. S3: DNA per antibody for each conjugate.
Fig. S4: Effect of permeabilization schemes on antibody labeling.
Fig. S5: Comparison of unmodified antibodies to DNA-antibody conjugates.
Fig. S6: Validation of DNA-antibody conjugates.
Fig. S5. Protein marker expression correlates with flow cytometry.
Fig. S6: Single-cell variability in treated and untreated A431 cells.
Fig S7. Protein marker changes correlate with drug sensitivity.
Fig. S8: Taxol treatment and dose response screen in human HT1080 cells in vitro.
Table S1: List of antibodies.
Table S2: Significant markers between A431 single cells with or without gefitinib.
Table S3: Differential markers between responders and non-responders.
Table S4. List of 70mer alien sequences used for barcoding.
Acknowledgments
We thank J. Chung, D. Issadore, and H. Lee for help in chip development; K. Yang for help with Western blotting, H. Chung, A. Laughney and C. Vinegoni for experimental help; M. Pectasides for sample collection; and S. Young, M. Lee and J. Engreitz for help with the NanoString reader. We especially acknowledge J. Carlson, A. Shaw, J. Engelman and R. Langer for many helpful discussions.
Funding: This work was funded in part by U54 CA151884. A.V.U. was funded by an NSF fellowship and U54 CA151884.
Footnotes
Author Contributions: A.V.U. and V.P. designed or performed experiments, analyzed data, and wrote versions of the manuscript. S.S.A. synthesized the photocleavable linker. S.S.A and S.T. assisted in antibody-DNA conjugations and cell labeling experiments. D.J., C.M.C., and R.W. provided patient samples and clinical guidance. C.M.C. and R.W. wrote the IRB protocol and the manuscript. All authors commented on and edited the manuscript.
Competing Interests: The authors have no competing interests. Different aspects of this work (assay and microfluidic device) have been assigned to the General Hospital Corporation for patenting.
Data and materials availability: Reagents and anonymized data are available via an MTA.
References and notes
- 1.Basik M, Aguilar-Mahecha A, Rousseau C, Diaz Z, Tejpar S, Spatz A, Greenwood CM, Batist G. Biopsies: next-generation biospecimens for tailoring therapy. Nature reviews Clinical oncology. 2013;10:437–450. doi: 10.1038/nrclinonc.2013.101. published online EpubAug . [DOI] [PubMed] [Google Scholar]
- 2.Vogelstein B, Papadopoulos N, Velculescu VE, Zhou S, Diaz LA, Jr, Kinzler KW. Cancer genome landscapes. Science. 2013;339:1546–1558. doi: 10.1126/science.1235122. published online EpubMar 29 . [DOI] [PMC free article] [PubMed] [Google Scholar]
- 3.Paez JG, Janne PA, Lee JC, Tracy S, Greulich H, Gabriel S, Herman P, Kaye FJ, Lindeman N, Boggon TJ, Naoki K, Sasaki H, Fujii Y, Eck MJ, Sellers WR, Johnson BE, Meyerson M. EGFR mutations in lung cancer: correlation with clinical response to gefitinib therapy. Science. 2004;304:1497–1500. doi: 10.1126/science.1099314. published online EpubJun 4 . [DOI] [PubMed] [Google Scholar]
- 4.Soda M, Choi YL, Enomoto M, Takada S, Yamashita Y, Ishikawa S, Fujiwara S, Watanabe H, Kurashina K, Hatanaka H, Bando M, Ohno S, Ishikawa Y, Aburatani H, Niki T, Sohara Y, Sugiyama Y, Mano H. Identification of the transforming EML4-ALK fusion gene in non-small-cell lung cancer. Nature. 2007;448:561–566. doi: 10.1038/nature05945. published online EpubAug 2 . [DOI] [PubMed] [Google Scholar]
- 5.Yaffe MB. The scientific drunk and the lamppost: massive sequencing efforts in cancer discovery and treatment. Science signaling. 2013;6:pe13. doi: 10.1126/scisignal.2003684. published online EpubApr 2 . [DOI] [PubMed] [Google Scholar]
- 6.Hsi ED. A practical approach for evaluating new antibodies in the clinical immunohistochemistry laboratory. Archives of pathology & laboratory medicine. 2001;125:289–294. doi: 10.1043/0003-9985(2001)125<0289:APAFEN>2.0.CO;2. published online EpubFeb . [DOI] [PubMed] [Google Scholar]
- 7.Lanni EJ, Rubakhin SS, Sweedler JV. Mass spectrometry imaging and profiling of single cells. Journal of proteomics. 2012;75:5036–5051. doi: 10.1016/j.jprot.2012.03.017. published online EpubAug 30 . [DOI] [PMC free article] [PubMed] [Google Scholar]
- 8.Bendall SC, Simonds EF, Qiu P, Amirel AD, Krutzik PO, Finck R, Bruggner RV, Melamed R, Trejo A, Ornatsky OI, Balderas RS, Plevritis SK, Sachs K, Pe’er D, Tanner SD, Nolan GP. Single-cell mass cytometry of differential immune and drug responses across a human hematopoietic continuum. Science. 2011;332:687–696. doi: 10.1126/science.1198704. published online EpubMay 6 . [DOI] [PMC free article] [PubMed] [Google Scholar]
- 9.Agasti SS, Liong M, Peterson VM, Lee H, Weissleder R. Photocleavable DNA barcode-antibody conjugates allow sensitive and multiplexed protein analysis in single cells. Journal of the American Chemical Society. 2012;134:18499–18502. doi: 10.1021/ja307689w. published online EpubNov 14 . [DOI] [PMC free article] [PubMed] [Google Scholar]
- 10.Fortina P, Surrey S. Digital mRNA profiling. Nature biotechnology. 2008;26:293–294. doi: 10.1038/nbt0308-293. published online EpubMar . [DOI] [PubMed] [Google Scholar]
- 11.Geiss GK, Bumgarner RE, Birditt B, Dahl T, Dowidar N, Dunaway DL, Fell HP, Ferree S, George RD, Grogan T, James JJ, Maysuria M, Mitton JD, Oliveri P, Osborn JL, Peng T, Ratcliffe AL, Webster PJ, Davidson EH, Hood L, Dimitrov K. Direct multiplexed measurement of gene expression with color-coded probe pairs. Nature biotechnology. 2008;26:317–325. doi: 10.1038/nbt1385. published online EpubMar . [DOI] [PubMed] [Google Scholar]
- 12.Chung J, Issadore D, Ullal A, Lee K, Weissleder R, Lee H. Rare cell isolation and profiling on a hybrid magnetic/size-sorting chip. Biomicrofluidics. 2013;7 doi: 10.1063/1.4821923. http://dx.doi.org/10.1063/1.4821923. [DOI] [PMC free article] [PubMed] [Google Scholar]
- 13.Spencer SL, Gaudet S, Albeck JG, Burke JM, Sorger PK. Non-genetic origins of cell-to-cell variability in TRAIL-induced apoptosis. Nature. 2009;459:428–432. doi: 10.1038/nature08012. published online EpubMay 21 . [DOI] [PMC free article] [PubMed] [Google Scholar]
- 14.Andersen JN, Sathyanarayanan S, Di Bacco A, Chi A, Zhang T, Chen AH, Dolinski B, Kraus M, Roberts B, Arthur W, Klinghoffer RA, Gargano D, Li L, Feldman I, Lynch B, Rush J, Hendrickson RC, Blume-Jensen P, Paweletz CP. Pathway-based identification of biomarkers for targeted therapeutics: personalized oncology with PI3K pathway inhibitors. Science translational medicine. 2010;2:43ra55. doi: 10.1126/scitranslmed.3001065. published online EpubAug 4. [DOI] [PubMed] [Google Scholar]
- 15.Shintani S, Li C, Mihara M, Terakado N, Yano J, Nakashiro K, Hamakawa H. Enhancement of tumor radioresponse by combined treatment with gefitinib (Iressa, ZD1839), an epidermal growth factor receptor tyrosine kinase inhibitor, is accompanied by inhibition of DNA damage repair and cell growth in oral cancer. International journal of cancer Journal international du cancer. 2003;107:1030–1037. doi: 10.1002/ijc.11437. published online EpubDec 20 . [DOI] [PubMed] [Google Scholar]
- 16.Hanahan D, Weinberg RA. Hallmarks of cancer: the next generation. Cell. 2011;144:646–674. doi: 10.1016/j.cell.2011.02.013. published online EpubMar 4 . [DOI] [PubMed] [Google Scholar]
- 17.Wang J, Zhou JY, Wu GS. Bim protein degradation contributes to cisplatin resistance. The Journal of biological chemistry. 2011;286:22384–22392. doi: 10.1074/jbc.M111.239566. published online EpubJun 24 . [DOI] [PMC free article] [PubMed] [Google Scholar]
- 18.Benoist C, Hacohen N. Immunology. Flow cytometry, amped up. Science. 2011;332:677–678. doi: 10.1126/science.1206351. published online EpubMay 6 . [DOI] [PubMed] [Google Scholar]
- 19.McGranahan N, Burrell RA, Endesfelder D, Novelli MR, Swanton C. Cancer chromosomal instability: therapeutic and diagnostic challenges. EMBO reports. 2012;13:528–538. doi: 10.1038/embor.2012.61. published online EpubJun . [DOI] [PMC free article] [PubMed] [Google Scholar]
- 20.Bousquet J, Anto JM, Sterk PJ, Adcock IM, Chung KF, Roca J, Agusti A, Brightling C, Cambon-Thomsen A, Cesario A, Abdelhak S, Antonarakis SE, Avignon A, Ballabio A, Baraldi E, Baranov A, Bieber T, Bockaert J, Brahmachari S, Brambilla C, Bringer J, Dauzat M, Ernberg I, Fabbri L, Froguel P, Galas D, Gojobori T, Hunter P, Jorgensen C, Kauffmann F, Kourilsky P, Kowalski ML, Lancet D, Pen CL, Mallet J, Mayosi B, Mercier J, Metspalu A, Nadeau JH, Ninot G, Noble D, Ozturk M, Palkonen S, Prefaut C, Rabe K, Renard E, Roberts RG, Samolinski B, Schunemann HJ, Simon HU, Soares MB, Superti-Furga G, Tegner J, Verjovski-Almeida S, Wellstead P, Wolkenhauer O, Wouters E, Balling R, Brookes AJ, Charron D, Pison C, Chen Z, Hood L, Auffray C. Systems medicine and integrated care to combat chronic noncommunicable diseases. Genome medicine. 2011;3:43. doi: 10.1186/gm259. [DOI] [PMC free article] [PubMed] [Google Scholar]
- 21.Schadt EE. Molecular networks as sensors and drivers of common human diseases. Nature. 2009;461:218–223. doi: 10.1038/nature08454. published online EpubSep 10 . [DOI] [PubMed] [Google Scholar]
- 22.Gerdes MJ, Sevinsky CJ, Sood A, Adak S, Bello MO, Bordwell A, Can A, Corwin A, Dinn S, Filkins RJ, Hollman D, Kamath V, Kaanumalle S, Kenny K, Larsen M, Lazare M, Li Q, Lowes C, McCulloch CC, McDonough E, Montalto MC, Pang Z, Rittscher J, Santamaria-Pang A, Sarachan BD, Seel ML, Seppo A, Shaikh K, Sui Y, Zhang J, Ginty F. Highly multiplexed single-cell analysis of formalin-fixed, paraffin-embedded cancer tissue. Proceedings of the National Academy of Sciences of the United States of America. 2013;110:11982–11987. doi: 10.1073/pnas.1300136110. published online EpubJul 16. [DOI] [PMC free article] [PubMed] [Google Scholar]
- 23.Janku F, Wheler JJ, Westin SN, Moulder SL, Naing A, Tsimberidou AM, Fu S, Falchook GS, Hong DS, Garrido-Laguna I, Luthra R, Lee JJ, Lu KH, Kurzrock R. PI3K/AKT/mTOR inhibitors in patients with breast and gynecologic malignancies harboring PIK3CA mutations. J Clin Oncol. 2012;30:777–782. doi: 10.1200/JCO.2011.36.1196. published online EpubMar 10 . [DOI] [PMC free article] [PubMed] [Google Scholar]
- 24.Elkabets M, Vora S, Juric D, Morse N, Mino-Kenudson M, Muranen T, Tao J, Campos AB, Rodon J, Ibrahim YH, Serra V, Rodrik-Outmezguine V, Hazra S, Singh S, Kim P, Quadt C, Liu M, Huang A, Rosen N, Engelman JA, Scaltriti M, Baselga J. mTORC1 Inhibition Is Required for Sensitivity to PI3K p110α Inhibitors in PIK3CA-Mutant Breast Cancer. Sci Transl Med. 2013 Jul 31;5(196):196ra99. doi: 10.1126/scitranslmed.3005747. [DOI] [PMC free article] [PubMed] [Google Scholar]
- 24.Zorn KK, Jazaeri AA, Awtrey CS, Gardner GJ, Mok SC, Boyd J, Birrer MJ. Choice of normal ovarian control influences determination of differentially expressed genes in ovarian cancer expression profiling studies. Clinical cancer research : an official journal of the American Association for Cancer Research. 2003;9:4811–4818. published online EpubOct 15. [PubMed] [Google Scholar]
- 25.Devaraj NK, Upadhyay R, Haun JB, Hilderbrand SA, Weissleder R. Fast and sensitive pretargeted labeling of cancer cells through a tetrazine/trans-cyclooctene cycloaddition. Angewandte Chemie. 2009;48:7013–7016. doi: 10.1002/anie.200903233. [DOI] [PMC free article] [PubMed] [Google Scholar]
Associated Data
This section collects any data citations, data availability statements, or supplementary materials included in this article.
Supplementary Materials
Fig. S1. Scheme of DNA-antibody conjugation.
Fig. S2. Optimizing lysis and blocking methods.
Fig. S3: DNA per antibody for each conjugate.
Fig. S4: Effect of permeabilization schemes on antibody labeling.
Fig. S5: Comparison of unmodified antibodies to DNA-antibody conjugates.
Fig. S6: Validation of DNA-antibody conjugates.
Fig. S5. Protein marker expression correlates with flow cytometry.
Fig. S6: Single-cell variability in treated and untreated A431 cells.
Fig S7. Protein marker changes correlate with drug sensitivity.
Fig. S8: Taxol treatment and dose response screen in human HT1080 cells in vitro.
Table S1: List of antibodies.
Table S2: Significant markers between A431 single cells with or without gefitinib.
Table S3: Differential markers between responders and non-responders.
Table S4. List of 70mer alien sequences used for barcoding.