
Figure 3.
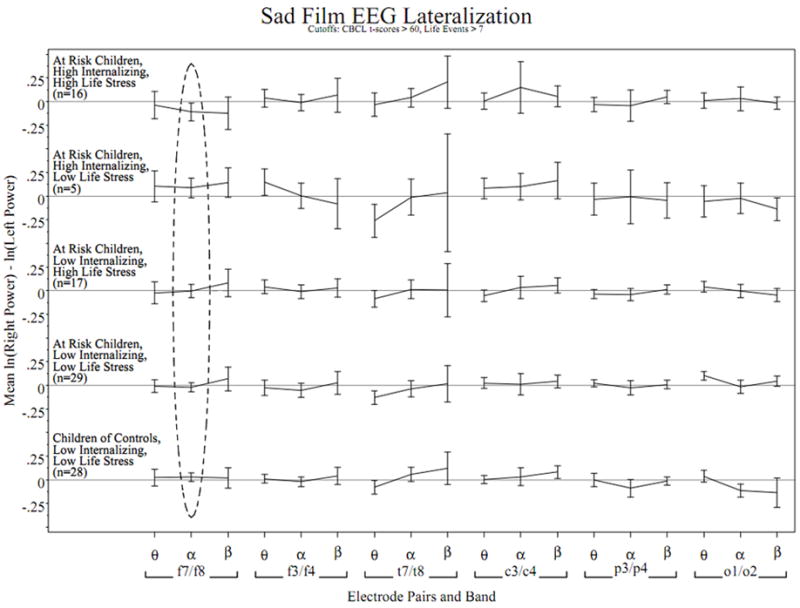
EEG asymmetry profiles across scalp regions and EEG band in participant subgroups while watching a sad film. Lines connect mean asymmetry in adjacent bands from the natural log power spectrum in the same electrode pair and subgroup, error bars extend +/-2 standard errors from each mean. The horizontal reference is at zero asymmetry for each subgroup. Positive values indicate greater left than right activation. The dashed circle highlights the only significant observed risk status-by-asymmetry-by-life event interaction predicting internalizing symptoms after adjusting for baseline asymmetry. This effect can be seen in the F7/F8 alpha asymmetry where the topmost subgroup (at-risk children with high internalizing scores with high life stress) tend to display greater relative right-lateral frontal activity, in contrast to the middle subgroup (at-risk children with low internalizing scores with high life stress) whose mean asymmetry is near zero. This three way interaction was not significant in any of the other electrode pairs or frequency bands.