

Abstract

The synthetic protocol for preparation of 1-13C-phosphoenolpyruvate-d2, precursor for parahydrogen-induced polarization (PHIP) of 1-13C-phospholactate-d2, is reported. 13C nuclear spin polarization of 1-13C-phospholactate-d2 was increased by >30,000,000-fold (5.75 mT) in water. The reported 13C polarization level approaching unity (>15.6%), long lifetime of 13C hyperpolarized 1-13C-phospholactate-d2 (58 ± 4 s versus 36 ± 2 s for nondeuterated form at 47.5 mT), and large production quantities (52 μmoles in 3 mL) in aqueous medium make this compound useful as a potential contrast agent for the molecular imaging of metabolism and other applications.
Hyperpolarized (HP) 13C magnetic resonance imaging (MRI) has evolved from proof-of-principle studies1,2 to clinical trials over the past decade.3 The high sensitivity of HP MRI was the main driving force behind its application for metabolic imaging. Indeed, HP MRI provides several orders of magnitude signal enhancement over the conventional MRI. Furthermore, HP MRI permits fast imaging of HP contrast agents and their metabolites within the time scale of the hyperpolarization decay, e.g., 1–3 min in vivo.4−6 Monitoring the metabolic signatures of HP contrast agents7 allows one to interrogate disease aggressiveness, progression, and response to treatment.
While dissolution dynamic nuclear polarization (DNP) is the most widely used hyperpolarization method at present,1 parahydrogen-induced polarization (PHIP)8 is an alternative approach, which enables HP contrast agent preparation in less than 1 min.4,5 PHIP is a chemical method relying on ultrafast molecular hydrogenation of an unsaturated precursor with parahydrogen enabled by Rh(I) catalysts, Figure 1.6,9 The use of hyperpolarization techniques for bioimaging requires a relatively long lifetime of the HP state in vivo, which historically has been demonstrated with isolated 13C sites in biomolecules, e.g., 13C carboxyl sites without directly attached protons with in vivo13C T1 > 20 s.3 Isotopic enrichment with ∼99% 13C is mandatory to boost the sensitivity of the contrast agent by increasing the payload of HP 13C magnetization per μmole of injected agent. In the PHIP process, the long-lived 13C sites J-coupled to nascent parahydrogens are hyperpolarized using polarization transfer from the parahydrogens to 13C, Figure 1. In addition to the mandatory 13C10,11 labeling of carboxyl carbon adjacent to the double or triple carbon–carbon bond required for molecular addition of parahydrogen,10,11 the spin system of the hydrogenated molecule often benefits from simplification to three spins via deuteration: two parahydrogen protons and a 13C nucleus, Figure 1. This deuteration of the precursor molecules also lengthens the 13C relaxation times T1 of HP states.12−14
Figure 1.
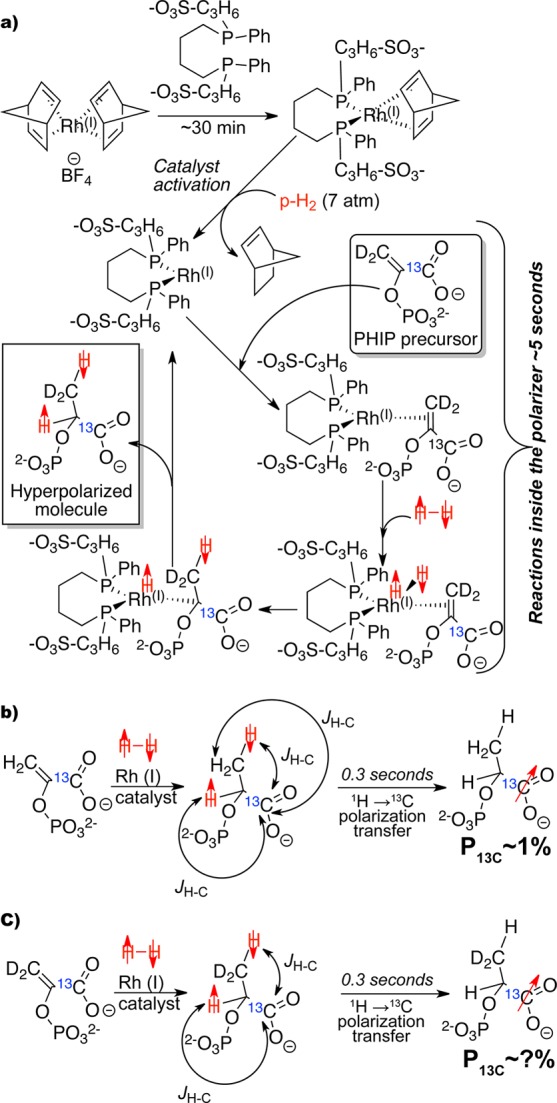
(a) Rh(I) water-soluble catalyst preparation outside of PHIP polarizer and subsequent catalytic cycle inside the PHIP polarizer leading to 1H polarized 1-13C-phospholactate-d2 (1-13C-PLAC-d2). (b) Molecular addition of parahydrogen and polarization transfer leading to 13C HP 1-13C-phospholactate (1-13C-PLAC).18 (c) Molecular addition of parahydrogen and polarization transfer leading to 13C HP 1-13C-phospholactate-d2 (1-13C-PLAC-d2).
Despite the synthetic challenges related to deuterium and 13C enrichments, several contrast agents such as 2-hydroxy-ethyl propionate-1-13C,2,3,3-d3 (HEP), 1-13C-succinate,12−14 tetrafluoropropyl propionate-1-13C,2,3,3-d3 (TFPP),15,1615N-propargylcholine,17 and 1-13C-phospholactate18 have been demonstrated. HEP,19 1-13C-succinate-d2,12−14 and TFPP15,16 have been used for in vivo metabolic imaging of vasculature, cancer, and plaque lipid content, respectively.
The recently introduced concept of −OH protection of the C=C–OH moiety18,20 expanded the number of potential PHIP-based HP contrast agents. HP 1-13C-phospholactate (PLAC)18,21 is particularly attractive, Figure 1, because it can be rapidly dephosphorylated to HP 1-13C-lactate by blood phosphatases.21 Therefore, bioavailable 1-13C-lactate can be prepared by the PHIP method. HP lactate22−25 elevation in cancer cells enables in vivo metabolic imaging using injection of HP 1-13C-lactate.26,27
A low polarization level of ∼1% has been the main obstacle for use of HP PLAC, Figure 1. Here, a significantly greater polarization level and larger-scale production for HP PLAC is demonstrated by using fully deuterated PHIP precursor, 1-13C-phosphoenolpyruvate-d2 (1-13C-PEP-d2), and higher hydrogenation reaction temperature, respectively. Finally, a complete synthetic methodology for preparation of 1-13C-PEP-d2 is reported.
Results and Discussion
Commercial phosphoenolpyruvate (PEP) has been previously synthesized by the Hirschbein procedure,28 where pyruvic acid is the starting material. It has also been shown that protons of pyruvic acid can be exchanged by deuterons of D2O.29,30 However, the product, pyruvic-d3 acid, was either used in situ(30) or prepared with low yield.29 For example, the actual yield of the pure deuterated product was not reported, and the yield of a crude material was <50%.29 Moreover, only modest isotopic purity of 70% of pyruvic-d3 acid was achieved. Therefore, a more efficient exchange procedure was required for preparation of 1-13C-PEP-d2. The exchange procedure shown in Figure 2a was developed after several model experiments with unlabeled pyruvic acid. In this synthetic protocol, pyruvic acid is converted to pyruvic-d3 acid by exchange with D2O followed by its conversion to the sodium salt 1 and subsequent recrystallization. The use of a mild base, e.g., sodium bicarbonate, is essential, because stronger bases, e.g., NaOH, cause pyruvate to polymerize (Supporting Information (SI), Figure S7).
Figure 2.
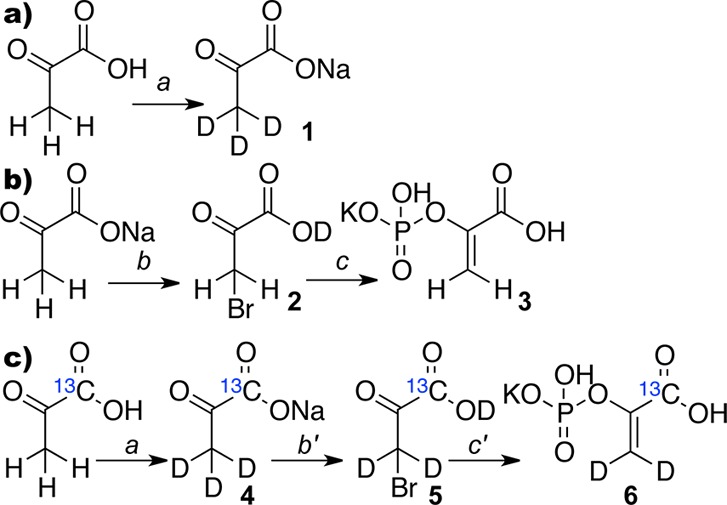
Step-wise optimization of deuterium exchange of pyruvic acid, synthesis of PEP from sodium pyruvate, and preparation of 1-13C-phosphoenolpyruvate-d2 (1-13C-PEP-d2, 6). (a) Deuterium exchange: (a) (i) D2O (450 mL), 100 °C, 5 h; (ii) 0.95 eq. NaHCO3; (iii) Rec. D2O/EtOH; sodium pyruvate-d3 (2, 54% yield, ratio C3D3O3– to C3D2HO3– = 1:0.28). (b) Potassium phosphoenolpyruvate synthesis based on sodium pyruvate: (b) 0.95 eq. H2SO4, 0.95 eq. Br2 (dry), CCl4; (c) (i) P(OMe)3, THF; (ii) H2O; (iv) KOH to pH ∼ 2.7; (v) Rec. H2O/EtOH; potassium phosphoenolpyruvate (3, 52% over two steps); (c) preparation for potassium 1-13C-phosphoenolpyruvate-d3 (1-13C-PEP-d3): (a) (i) D2O (450 mL), 100 °C, 5 h; (ii) 0.95 eq. NaHCO3; (iii) Rec. D2O/EtOH; sodium 1-13C-pyruvate-d3 (4, 75% yield, C213CD3O3– to C213CD2HO3– = 1:0.25). (b′) 0.95 eq. D2SO4, 0.95 eq. Br2 (dry), CCl4; (c′) (i) P(OMe)3, THF; (ii) D2O; (iii) KOH to pH ∼ 2.7; (iv) Rec. H2O/EtOH (6, 43% over 2 steps, C213CH2D2O6P– to C213CH3DO6P– to C213CH4O6P– = 1:0.10:0.05).
While the Hirschbein procedure28 is the best PEP preparation protocol to date, it requires pyruvic acid as the starting material. Therefore, it cannot be directly applied to sodium pyruvate. Our attempt to use the previously reported Dotson procedure31 resulted in relatively low yields with variable reproducibility. Here, a new PEP synthesis using sodium pyruvate is reported representing the combination of modified Hirschbein and Dotson protocols, Figure 2b. Optimization of all steps in Figures 2a and 2b allowed one to prepare the main synthetic target 1-13C-PEP-d2 shown in Figure 2c. To summarize, deuteration of 1-13C-pyruvic acid resulted in sodium 1-13C-pyruvate-d34 with 75% yield and ∼80% isotopic purity. It was converted to 1-13C-bromopyruvic-d2 acid 5, which was reacted with P(OMe)3 to form the desired 1-13C-PEP-d26 with 43% yield over two steps and ∼87% deuterium isotopic purity. This procedure is efficient, because it allows for a high percent deuterium isotopic labeling and high yields of the new isotopomer.
The preliminary PHIP studies with nondeuterated and deuterated 1-13C-PEP were conducted using previously described setup and sample preparation18 in 47.5 mT PHIP polarizer,32 where the hydrogenation high-pressure reactor was maintained at 35 °C. The pilot experiments were conducted with PHIP precursor concentration ∼6 mM, [Rh(I) catalyst] ∼2.5 mM at pH ∼12, and in 99.8% D2O. The effective 13C polarization %P was 1.86 ± 0.55% for 1-13C-PLAC-d2 and %P was 0.13 ± 0.015% for 1-13C-PLAC. The effective %P was low primarily because of an incomplete hydrogenation (data not shown) due to slow hydrogenation reaction. However, the ratio %P(1-13C-PLAC-d2)/%P(1-13C-PLAC) was 14.3 ± 4.5, representing a significant improvement due to deuteration of PHIP precursor. 13C T1 increased from 36 ± 2 s (PLAC) to 58 ± 4 s (1-13C-PLAC-d2).
The previously described PHIP polarizer design utilized a 47.5 mT permanent magnet with a relatively narrow bore of 89 mm, which cannot be heated above 50 °C. Kadlecek and co-workers33 demonstrated that the PHIP hydrogenation reaction with similar Rh(I) catalyst and precursors can be significantly accelerated by a reaction temperature increase. Therefore, further studies with high PHIP precursor concentration were conducted using a variable temperature electromagnet PHIP setup operating at 5.75 mT and utilizing the identical chemical reactor. All samples at both polarizing fields were hydrogenated using ultrahigh purity H2 (∼7 atm partial pressure using normal H2 gas, i.e., 75% ortho-/25% para-, or higher percent para-enrichment) for ∼5 s in a 60 mL volume reactor.
The 5.75 mT PHIP polarizer setup enabled experiments at medium (55 °C) and high (68 °C) reaction temperatures for ∼5 s-long reaction with ∼7 atm of normal H2 gas pressure, Figure 3. pH dependence of PEP to PLAC conversion via molecular hydrogenation was evaluated next (Figure 3a). Figure 3b,c shows the percent conversion of 5 and 30 mM PEP, respectively, as measured using high-resolution proton NMR spectroscopy. Briefly, D2O solution of PEP (5 mM) in phosphate buffer (25 mM) was prepared and divided into 25 mL fractions, which were adjusted to seven pH values: 3.9, 5.95, 7.14, 8.07, 9.93, 11.12, and 12.11. An equimolar solution of PEP and Rh (I) catalyst (5.3 mM) was prepared by a previously described procedure from each fraction.34 The solutions collected from the polarizer outputs were analyzed by 1H NMR spectroscopy using PEP/PLAC vinyl/methyl proton intensities’ ratio. Percent conversion (Figure 3b) was calculated as an average of two injections at each pH. A high level (>80%) of hydrogenation was observed in all cases except at pH 12 and above.
Figure 3.

(a) Diagram of PEP to PLAC conversion using automated PHIP polarizer. (b) pH optimization of PEP (5 mM) in phosphate buffer (25 mM) using Rh(I) catalyst (5.3 mM) at 55 ± 2 °C. (c) pH optimization of PEP (30 mM) in phosphate buffer (30 mM) using Rh(I) catalyst (5.3 mM) in the pH range of interest. Rh(I) catalyst performs several hydrogenation cycles using 30 mM PEP, Figure 1. The reaction temperatures were 68 ± 1 °C (red trace) and 55 ± 1 °C (blue trace). (d) Final pH (of solutions exiting PHIP polarizer) as a function of the starting pH (solutions entering PHIP polarizer) of solutions used in (c). All hydrogenations were performed at ∼7 atm of H2 gas partial pressure during an ∼5 s reaction time.
While hydrogenation of low concentrated PEP (5 mM) can be useful for in vitro applications, significantly higher concentration of an injectable, aqueous, HP contrast agent is typically required for in vivo imaging.14,16,23,35 Moreover, previous studies with 1-13C-succinates12,13 indicated that 13C compounds with exchangeable carboxyl protons near pH ∼5–6 may lose polarization rapidly at neutral pH due to significantly shortened T1. Therefore, PEP (30 mM) molecular hydrogenation with phosphate buffer (30 mM) was evaluated in the upper-middle pH range (10.0, 10.5, 11.0, and 11.5), away from neutral pH. [PEP]/[Rh(I)] ratio was >5.5:1. Polarizer output solutions were analyzed by 1H NMR spectroscopy. The intensity ratio of PEP vinyl protons and PLAC proton adjacent to the phosphate group of (CH3CH(OPO3HK)CO2H) yielded % conversion (an average of 2 injections per each pH value, Figure 3c) ranging from 41% to 74%. Higher reaction temperature translated into a 3–6% increase of conversion %. Note that the hydrogenation reaction may continue after exiting PHIP polarizer, but at a significantly lower rate, because the ejected solution temperature returned to ∼25 °C and H2 pressure ≪1 atm.
The initial PEP and produced PLAC have different pKa values, and hydrogenation also modifies the Rh(I) catalyst by removing NBD from its complex. As a result, pH of solutions passing through PHIP polarizer changes. Figure 3d clearly demonstrates the observed 1.4 ± 0.3 pH shift between starting solution (i.e., entering PHIP polarizer) and final solution (i.e., exiting PHIP polarizer). This effect must be considered since neutral pH, e.g., 7.0–7.5, is required for the in vivo injection of HP contrast agents, and pH of solutions exiting PHIP polarizer, e.g., pH 8.5–10.5, must be adjusted to the neutral pH range.
The above evaluation of PEP hydrogenation was used in HP studies of the fully labeled 1-13C-PEP-d2 precursor 6 (Figure 4a), and ∼26 mM solution of 1-13C-PEP-d26 ([PEP]/[Rh(I)] > 6.5:1) with 30 mM of phosphate buffer in D2O was prepared at pH = 10.3. Molecular addition of parahydrogen was performed using ultrahigh purity H2 with >90% para-state.36 After polarization transfer to 13C, Figure 1, PHIP product 1-13C-PLAC-d28″ was detected in situ of the polarizer by single-scan 13C NMR spectroscopy, Figure 4b, with a similar RF probe body as previously reported.32,37 The enhancement factor and %P were calculated as before32 yielding P = 15.6 ± 3.0% corresponding to the 13C signal and polarization enhancement factor ε = (3.1 ± 0.6) × 107 when compared to 13C thermal nuclear spin polarization of only 5.0 × 10⁻⁷ % at 5.75 mT and 289 K with in situ T1 (5.75 mT) = 51 ± 2 s (SI), which would be impractical to detect at such a low field without a hyperpolarization procedure; it would take an estimated >1 billion years to record the same signal from this sample without sensitivity enhancement.
Figure 4.

PHIP of 1-13C-PEP-d2 to HP 1-13C-PLAC-d2. (a) Diagram of molecular hydrogenation of 1-13C-PEP-d2, deuterium enrichment of 95% (SI, section 2.4), with parahydrogen to form HP 1-13C-PLAC-d2. (b) 13C spectrum of PHIP HP 1-13C-PLAC-d2 (52 μmoles in ∼3 mL and ∼12 μmoles of unreacted 1-13C-PEP-d2 corresponding to ∼82% conversion) acquired at 5.75 mT in situ of the automated PHIP polarizer using 7 atm of parahydrogen and ∼92 °C. (c) Signal reference 13C spectrum of sodium 1-13C-acetate (165 mmol in 52 mL of D2O) with polarization P = 4.70 × 10⁻⁴% at acquisition. (d) T1 decay of 13C hyperpolarization of HP 1-13C-PLAC-d2.
Percent conversion of 1-13C-PEP-d2 to HP 1-13C-PLAC-d2 determined by 13C NMR of solutions ejected from the PHIP polarizer immediately after in situ NMR detection (SI, Table S1) was ∼82% (Figure 4b), and it was used to calculate the effective HP 1-13C-PLAC-d2 concentration used for calculation of % 13C hyperpolarization P and ε above (SI). Importantly, in situ NMR detection required several extra seconds. As a result, the apparent % conversion (measured by high-resolution NMR spectroscopy using samples ejected from PHIP polarizer) was affected by this additional reaction time, leading to an overestimate of % conversion and an underestimate of % P and ε. Therefore, the reported values of 13C P = 15.6 ± 3.0% and ε = (3.1 ± 0.6) × 107 represent the lower limit of the achieved 13C hyperpolarization. Consequently, the actual polarization level may be significantly higher, but the conversion yield is lower. Improving % conversion of PEP to PLAC and approaching ∼100% conversion is feasible similarly to PHIP of succinate13 by further increasing the reaction temperature or parahydrogen partial pressure.
Conclusion
Deuterium labeling of PHIP precursor, Figures 1 and 2, significantly improved 13C PLAC hyperpolarization. PHIP conducted under identical conditions demonstrated the polarization increase by 14.3 ± 4.5-fold, as well as the T1 increase from 36 ± 2 s to 58 ± 2 s at 47.5 mT. This effect of PHIP precursor deuteration was systematically quantified for the first time. Furthermore, acceleration of hydrogenation reaction by performing PHIP at elevated temperatures enabled preparation of highly concentrated and highly 13C polarized 1-13C-PLAC-d2, e.g., >15.6% of 52 μmoles in 3 mL. This represents ∼100-fold increase in the payload of produced 13C magnetization per unit volume, when compared to previously reported 1% polarization of 7 μmoles in 3 mL for 1-13C-PLAC. These improvements make 13C HP 1-13C-PLAC-d2 suitable for in vivo applications. The synthetic methodology presented here allows for large-scale (tens of grams) production of 1-13C-PEP-d2, which produces highly polarized 1-13C-PLAC-d2 via PHIP. The produced 13C hyperpolarization enables >7 orders of sensitivity enhancements of 13C NMR signal and nuclear spin polarization. As an example, a small quantity of analyte (52 μmoles) was detected in a large volume (60 mL) reactor with high signal-to-noise ratio (SNR ∼ 200) using direct 13C detection at 5.75 mT.
Acknowledgments
We thank NIGMS 1R21 GM107947-01 (K.W.W.), NIH ICMIC 5P50 CA128323-03 (K.W.W.), 5R00 CA134749-03, 3R00CA134749-02S1, and DoD CDMRP Breast Cancer Program Era of Hope Award W81XWH-12-1-0159/BC112431 for funding support.
Supporting Information Available
Synthetic and PHIP buffers preparation protocols, 1H, 13C NMR, and HR-MS spectra, and raw PHIP data. This material is available free of charge via the Internet at http://pubs.acs.org.
Author Contributions
The manuscript was written through contributions of all authors. All authors have given approval to the final version of the manuscript.
The authors declare no competing financial interest.
Funding Statement
National Institutes of Health, United States
Supplementary Material
References
- Ardenkjaer-Larsen J. H.; Fridlund B.; Gram A.; Hansson G.; Hansson L.; Lerche M. H.; Servin R.; Thaning M.; Golman K. Proc. Natl. Acad. Sci. U. S. A. 2003, 100, 10158–10163. [DOI] [PMC free article] [PubMed] [Google Scholar]
- Goldman M.; Johannesson H. C. R. Phys. 2005, 6, 575–581. [Google Scholar]
- Kurhanewicz J.; Vigneron D.; Brindle K.; Chekmenev E.; Comment A.; Cunningham C.; DeBerardinis R.; Green G.; Leach M.; Rajan S.; Rizi R.; Ross B.; Warren W. S.; Malloy C. Neoplasia 2011, 13, 81–97. [DOI] [PMC free article] [PubMed] [Google Scholar]
- Hövener J.-B.; Chekmenev E.; Harris K.; Perman W.; Robertson L.; Ross B.; Bhattacharya P. Magn. Reson. Mater. Phys., Biol. Med. 2009, 22, 111–121. [DOI] [PMC free article] [PubMed] [Google Scholar]
- Hövener J.-B.; Chekmenev E.; Harris K.; Perman W.; Tran T.; Ross B.; Bhattacharya P. Magn. Reson. Mater. Phys., Biol. Med. 2009, 22, 123–134. [DOI] [PMC free article] [PubMed] [Google Scholar]
- Bowers C. R.; Weitekamp D. P. Phys. Rev. Lett. 1986, 57, 2645–2648. [DOI] [PubMed] [Google Scholar]
- Albers M. J.; Bok R.; Chen A. P.; Cunningham C. H.; Zierhut M. L.; Zhang V. Y.; Kohler S. J.; Tropp J.; Hurd R. E.; Yen Y.-F.; Nelson S. J.; Vigneron D. B.; Kurhanewicz J. Cancer Res. 2008, 68, 8607–8615. [DOI] [PMC free article] [PubMed] [Google Scholar]
- Eisenschmid T. C.; Kirss R. U.; Deutsch P. P.; Hommeltoft S. I.; Eisenberg R.; Bargon J.; Lawler R. G.; Balch A. L. J. Am. Chem. Soc. 1987, 109, 8089–8091. [Google Scholar]
- Bowers C. R.; Weitekamp D. P. J. Am. Chem. Soc. 1987, 109, 5541–5542. [Google Scholar]
- Reineri F.; Viale A.; Giovenzana G.; Santelia D.; Dastru W.; Gobetto R.; Aime S. J. Am. Chem. Soc. 2008, 130, 15047–15053. [DOI] [PubMed] [Google Scholar]
- Goldman M.; Johannesson H.; Axelsson O.; Karlsson M. C. R. Chimie 2006, 9, 357–363. [Google Scholar]
- Bhattacharya P.; Chekmenev E. Y.; Perman W. H.; Harris K. C.; Lin A. P.; Norton V. A.; Tan C. T.; Ross B. D.; Weitekamp D. P. J. Magn. Reson. 2007, 186, 150–155. [DOI] [PMC free article] [PubMed] [Google Scholar]
- Chekmenev E. Y.; Hovener J.; Norton V. A.; Harris K.; Batchelder L. S.; Bhattacharya P.; Ross B. D.; Weitekamp D. P. J. Am. Chem. Soc. 2008, 130, 4212–4213. [DOI] [PMC free article] [PubMed] [Google Scholar]
- Zacharias N. M.; Chan H. R.; Sailasuta N.; Ross B. D.; Bhattacharya P. J. Am. Chem. Soc. 2012, 134, 934–943. [DOI] [PMC free article] [PubMed] [Google Scholar]
- Chekmenev E. Y.; Chow S. K.; Tofan D.; Weitekamp D. P.; Ross B. D.; Bhattacharya P. J. Phys. Chem. B 2008, 112, 6285–6287. [DOI] [PMC free article] [PubMed] [Google Scholar]
- Bhattacharya P.; Chekmenev E. Y.; Reynolds W. F.; Wagner S.; Zacharias N.; Chan H. R.; Bünger R.; Ross B. D. NMR Biomed. 2011, 24, 1023–1028. [DOI] [PMC free article] [PubMed] [Google Scholar]
- Reineri F.; Viale A.; Ellena S.; Alberti D.; Boi T.; Giovenzana G. B.; Gobetto R.; Premkumar S. S. D.; Aime S. J. Am. Chem. Soc. 2012, 134, 11146–11152. [DOI] [PubMed] [Google Scholar]
- Shchepin R. V.; Coffey A. M.; Waddell K. W.; Chekmenev E. Y. J. Am. Chem. Soc. 2012, 134, 3957–3960. [DOI] [PMC free article] [PubMed] [Google Scholar]
- Goldman M.; Johannesson H.; Axelsson O.; Karlsson M. Magn. Reson. Imaging 2005, 23, 153–157. [DOI] [PubMed] [Google Scholar]
- Trantzschel T.; Bernarding J.; Plaumann M.; Lego D.; Gutmann T.; Ratajczyk T.; Dillenberger S.; Buntkowsky G.; Bargon J.; Bommerich U. Phys. Chem. Chem. Phys. 2012, 14, 5601–5604. [DOI] [PubMed] [Google Scholar]
- Shchepin R. V.; Pham W.; Chekmenev E. Y.. J. Labelled Comp. Radiopharm. 2014, under review [DOI] [PMC free article] [PubMed]
- Golman K.; Petersson J. S. Acad. Radiol. 2006, 13, 932–942. [DOI] [PubMed] [Google Scholar]
- Day S. E.; Kettunen M. I.; Gallagher F. A.; Hu D. E.; Lerche M.; Wolber J.; Golman K.; Ardenkjaer-Larsen J. H.; Brindle K. M. Nat. Med. 2007, 13, 1382–1387. [DOI] [PubMed] [Google Scholar]
- Hurd R. E.; Yen Y.-F.; Mayer D.; Chen A.; Wilson D.; Kohler S.; Bok R.; Vigneron D.; Kurhanewicz J.; Tropp J.; Spielman D.; Pfefferbaum A. Magn. Reson. Med. 2010, 63, 1137–1143. [DOI] [PMC free article] [PubMed] [Google Scholar]
- Lupo J. M.; Chen A. P.; Zierhut M. L.; Bok R. A.; Cunningham C. H.; Kurhanewicz J.; Vigneron D. B.; Nelson S. J. Magn. Reson. Imaging 2010, 28, 153–162. [DOI] [PMC free article] [PubMed] [Google Scholar]
- Mayer D.; Yen Y. F.; Josan S.; Park J. M.; Pfefferbaum A.; Hurd R. E.; Spielman D. M. NMR Biomed. 2012, 25, 1119–1124. [DOI] [PMC free article] [PubMed] [Google Scholar]
- Chen A. P.; Kurhanewicz J.; Bok R.; Xua D.; Joun D.; Zhang V.; Nelson S. J.; Hurd R. E.; Vigneron D. B. Magn. Reson. Imaging 2008, 26, 721–726. [DOI] [PMC free article] [PubMed] [Google Scholar]
- Hirschbein B. L.; Mazenod F. P.; Whitesides G. M. J. Org. Chem. 1982, 47, 3765–3766. [Google Scholar]
- White R. H. Biochemistry 1978, 17, 3833–3840. [DOI] [PubMed] [Google Scholar]
- Guzman M. I.; Colussi A. J.; Hoffmann M. R. J. Phys. Chem. A 2006, 110, 931–935. [DOI] [PubMed] [Google Scholar]
- Dotson G. D.; Dua R. K.; Clemens J. C.; Wooten E. W.; Woodard R. W. J. Biol. Chem. 1995, 270, 13698–13705. [DOI] [PubMed] [Google Scholar]
- Waddell K. W.; Coffey A. M.; Chekmenev E. Y. J. Am. Chem. Soc. 2011, 133, 97–101. [DOI] [PMC free article] [PubMed] [Google Scholar]
- Kadlecek S.; Vahdat V.; Nakayama T.; Ng D.; Emami K.; Rizi R. NMR Biomed. 2011, 24, 933–942. [DOI] [PubMed] [Google Scholar]
- Cai C.; Coffey A. M.; Shchepin R. V.; Chekmenev E. Y.; Waddell K. W. J. Phys. Chem. B 2013, 117, 1219–1224. [DOI] [PMC free article] [PubMed] [Google Scholar]
- Golman K.; in’t Zandt R.; Thaning M. Proc. Natl. Acad. Sci. U. S. A. 2006, 103, 11270–11275. [DOI] [PMC free article] [PubMed] [Google Scholar]
- Feng B.; Coffey A. M.; Colon R. D.; Chekmenev E. Y.; Waddell K. W. J. Magn. Reson. 2012, 214, 258–262. [DOI] [PMC free article] [PubMed] [Google Scholar]
- Coffey A. M.; Shchepin R. V.; Wilkens K.; Waddell K. W.; Chekmenev E. Y. J. Magn. Reson. 2012, 220, 94–101. [DOI] [PMC free article] [PubMed] [Google Scholar]
Associated Data
This section collects any data citations, data availability statements, or supplementary materials included in this article.