Abstract
An ideal deposition marker for measuring regional flow is completely extracted during transcapillary passage and permanently retained. β-Labeled desmethylimipramine ([3H]DMI) is a nearly ideal flow marker. To obtain γ-and positron-emitting markers, DMI was iodinated to form 2-iododesmethylimipramine (IDMI). IDMI was more lipophilic than DMI. In isolated saline-perfused rabbit hearts its trans-organ extraction was >99%; and retention was >98% at 5 min at mean flows of up to 3.5 ml · g–·min–1. During washout, the fractional escape rate was <0.1% . min–1 and was independent of flow. In isolated blood-perfused rabbit hearts, extraction was still 98%, but retention was as low as 86% after 5 min at a flow of 1.6 ml·g–1 · min–1. The fractional escape rate was up to 2%. min–1 but independent of flow. Despite this relatively rapid loss, regional IDMI deposition remains proportional to regional flow for many minutes. Therefore IDMI is useful as an externally detectable “molecular microsphere” for myocardial flow imaging in vivo.
Keywords: rabbits; humans; multiple-indicator dilution; microspheres; 2-iodo-5-[3-(methylamino)propyl]-10,11-dihydro-2,3,6,7-dibenz (b,f)azepine; regional coronary blood flow; myocardial capillary extraction; radioactive iodine
INTRAORGAN REGIONAL BLOOD FLOW can be measured by the use of any marker that is deposited in tissues in proportion to flow and remains in the area where it was extracted. The amount of intra-arterially injected tracer that is deposited and retained in a region is then equal to the flow to the region times the net extraction. Markers that are partially barrier limited in their loss from the blood into tissue are not completely extracted and have less extraction in the high flow regions compared with the low flow regions. Flow-limited markers such as water or xenon wash out of the tissue rapidly and thus require mathematical interpretations to allow their use. Particulate markers such as microspheres, even though completely extracted, may not provide a measure of the regional flow of substances being transported in blood and may cause rheological disturbances in small vessels.
Desmethylimipramine (DMI), a lipophilic tricyclic antidepressant and an α2-adrenergic antagonist, (mol wt 266) has high extraction and long retention in isolated saline-perfused rabbit hearts (12). When labeled with 3H, it is nearly ideal as a deposited tracer for measuring regional plasma flow. To obtain an externally detectable flow marker we have radioiodinated desmethylimipra-mine to form 2-iododesmethylimipramine (IDMI). The molecular weight is 396 for [131I]DMI. Gamma or positron labeling of IDMI allows the use of conventional gamma counters and probes as well as positron and gamma tomographic reconstruction to provide an image of the distribution of flow through a given organ.
Our aim was to develop a deposited flow marker that could be used in vivo as well as in vitro. Thus we had to demonstrate appropriate extraction and retention over a wide range of flows (to demonstrate flow limitation) in the presence of blood and with minimum artifact. The isolated saline-perfused rabbit heart was used to determine whether or not the extraction and retention of IDMI remained high at several times normal myocardial flow. If IDMI associated with protein or cellular elements of blood this could compromise the usefulness of IDMI by decreasing its extraction. Blood from three species was used to assess the red blood cell (RBC): plasma partitioning and the RBC and plasma-protein binding characteristics of IDMI. The binding of IDMI to blood elements is unimportant if the dissociation rate is sufficiently high to allow myocardial uptake and retention to dominate the tracer kinetics. Therefore transcorontiry extractions must be determined in blood-perfused hearts. Other organs may trap less IDMI than the heart, allowing increased recirculating tracer, possibly changing the relative regional concentrations in the heart. To assess the extent of this problem, total-body clearance of IDMI and the amount of recirculating IDMI was determined from blood disappearance curves obtained from open-chest rabbits.
IDMI is an effective deposited marker for regional cardiac blood flow when injected between the pulmonary circulation and the coronary arteries. The deposition of IDMI is proportional to regional flow for several minutes, and the amount of recirculation and the rate of loss of IDMI are small. Further, the high systemic extraction indicates that IDMI may be a viable flow marker for other organs.
METHODS
Synthesis and Chemical Characterization of IDMI
DMI was electrophilically thallated at room temperature (~23°C) in an air atmosphere by a modification of the methods of Taylor and McKillop (13, 16, 17). Specifically, thallium trifluoroacetate (TlTFA) (Aldrich) in trifluoroacetic acid (TFA) was added to DMI (1.3 to 1.6 × 10⁻⁵ moles) dissolved in TFA at a molar ratio of 1-to-10 (TlTFA:DMI). After 1 min, radioiodide was added to the reaction mixture and 5 min later, aqueous potassium iodide (KI) was added to the reaction mixture in a molar ratio of 2-to-1 (KI-to-TITFA). After 10 min, sodium thiosulfate (molar excess compared with KI) was added. With the addition of KI, the thallium was reduced from the +3 to the +1 oxidation state; the resulting thallous iodide is an insoluble precipitate. A second iodine atom replaced the thallium that was on the aromatic ring. The advantage of this method was that substitution of the thallium and ultimately the iodine on the ring can be directed by the reaction conditions. The disadvantages of this method are that thallium is toxic and must be handled carefully and that the TlTFA:DMI intermediate is water sensitive. Radioiodination yields by this method were as great as 70%.
The radioiodinated product was purified by reverse-phase high-pressure liquid chromatography (HPLC), using a C-18 column and a 95% ethanol:0.013 M (pH 2.3) phosphate buffer mobile phase (7:4 vol/vol). Under these conditions, retention volumes were 2.9 ml, 7.2 ml, and 10.0 ml for Tl and I–, DMI, and IDMI, respectively. This was not the most efficient mobile phase for purification of IDMI, but it was convenient for radiopharmaceutical preparation because the ethanol could be rapidly removed to leave a bufferable solution suitable for injection. The IDMI used for these experiments was 98.1 ± 0.9% pure and contained 1.9 ± 0.9% impurity, primarily as I-.
Assignment of the site of iodination of the DMI was made using nuclear magnetic resonance (NMR) spectroscopy. Several milligrams of IDMI were purified from the parent compound by repeated chloroform:water extractions. Purity was determined by HPLC with UV detection at 270 nm. Chloroform was evaporated from the IDMI using dry N2 at 25°C for ~30 min, and then the IDMI was dissolved in deuterated chloroform (CDCl3) containing 0.03% tetramethylsilane (Aldrich). DMI, as obtained from the manufacturer, was also dissolved in CDCl3. The 1H-NMR spectra were measured using a Bruker 500 MHz pulsed Fourier transform NMR spectrometer. All spectra were referenced to the chemical shift of the chloroform resonance at 7.24 ppm. The NMR spectra for both DMI and IDMI were sufficiently complex that the determination of chemical shifts and coupling constants alone provided inadequate information to assign aromatic proton resonances. Nuclear Overhauser Enhancement (NOE) and homonuclear spin decoupling experiments were undertaken to definitively assign positions to the observed proton resonances.
RESULTS
Chemical Tests
Multiple iodinated DMI products can be formed by this reaction, depending primarily on the molar ratio of TlTFA-to-DMI used. Only two of these have been tested in animals thus far. The IDMI that has shown the greatest cardiac extraction had the best radiochemical yield at a thallium-to-DMI molar ratio of ~0.1. At this. molar ratio, it was possible, by more rapid addition of KI and then sodium thiosulfate, to complete the synthesis in 4 min after addition of radioiodine. Purification could be completed in an additional 6 min with a radiochemical yield of ~70%. The product was stable over time, with less than 1% loss of iodine from the molecule after 11 days at 25°C, and less than 8% loss at 90°C after 1 h in (pH 7) 0.9% saline and air atmosphere.
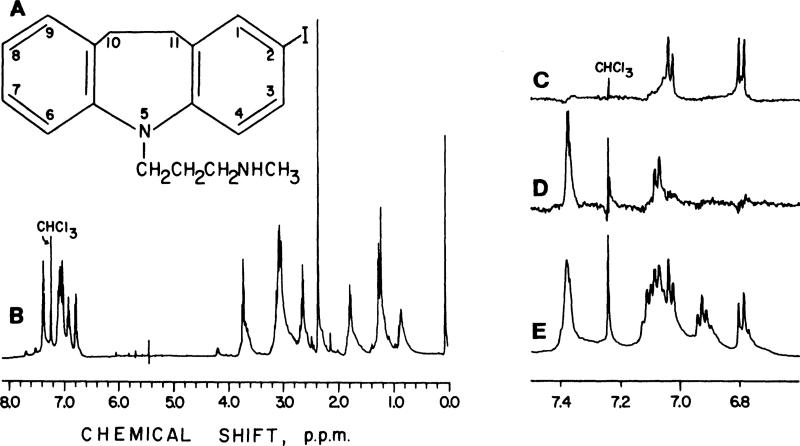
DMI had the following resonances, in ppm: δ(CHCl3) 9.40, 7.15, 7.10, 7.05, 6.85, 3.85, 3.10, 2.90, 2.40, and 2.05. The NMR spectra of IDMI is presented in Fig. 1. IDMI had the following resonances, in ppm: δ(CHCl3) 7.37, 7.11, 7.07, 7.03, 6.90, 6.80, 3.70, 3.10, 2.55, 2.30, 1.75, 1.20, and 0.80. NOE of the IDMI resonance at 3.10 ppm, due to the CH2—CH2 on the seven-membered ring, left only two peaks: a singlet at 7.37 ppm and a doublet at 7.07 ppm due to the protons at positions 1 and 9. The 7.37 ppm resonance was shifted downfield from 7.07 ppm due to the iodine ring substitution adjacent to that proton. The resonance for the proton at position 9 was unshifted from the parent compound at 7.07 ppm. By convention the lowest numbering was given to the substituted ring. NOE of the IDMI resonance at 3.70, due to the CH2 group attached to the ring nitrogen, left doublets at 7.03 and 6.80 ppm, the protons on positions 6 and 4, respectively. The proton on position 4 showed a slight upfield shift from 7.03 ppm due to its position on the substituted ring, but more distant from the electro-negative iodine. Spin decoupling experiments supported the above conclusions. The IDMI resonance at 6.80 ppm, i.e., the 4 position, was coupled to the resonance at 7.37 ppm, indicating that the latter resonance was due to the proton at the 3 position as well as the 1 position, and that the proton at the 3 position was next to the iodine on the ring. Decoupling of the IDMI resonance at 6.90 ppm, due to the proton at position 8, simplified the resonance at 7.15 ppm to a triplet and the one at 7.10 ppm to a singlet. Thus the former resonance was assigned to the position 7 proton and the latter confirmed as the proton at position 9. Assignments of protons in the alkyl region for IDMI were made by spin decoupling experiments. Decoupling of the resonance at 2.70 ppm simplified the resonance at 1.80 ppm. Decoupling of the resonance at 1.80 ppm simplified the resonances at 3.70 and 2.70 ppm. In summary, IDMI is a monoiodinated product with the iodine on the 2 position of the aromatic ring, i.e., 2-iodo-5-[3-(methylamino)propyl]-l0,1l~dihydro-2,3,6,7-di-benz(b,f)azepine.
Fig. 1.
Nuclear magnetic resonance spectra of IDMI. A: structure of IDMI (2-iodo-5-[3-(methylamino)propyl]-10, 11-dihydro-N-methyl-5H-dibenz[b,f]azepine). B: entire 1H nuclear magnetic resonance spectrum of IDMI. E: An expansion of aromatic 1H resonances is also presented. C and D: 1H resonances after Nuclear Overhauser Enhancement. C: irradiation of CH2 protons attached to azepine ring nitrogen left resonances at 7.00 and 6.80 ppm, protons at the 6 and 4 positions. D: irradiation of CH2—CH2 protons of the azepine ring left resonances at 7.35 and 7.10 ppm, which were due to the protons at positions 1 and 9.
METHODS
IDMI Partition Experiments
After the chemical synthesis and structure of IDMI were determined, we examined the partitioning of IDMI in to octanol and water, into various fractions of blood and the association of IDMI with microspheres. These experiments were performed to determine how lipid soluble IDMI was, and also to give some indication of how IDMI would interact with biological material.
octanol:weater partition experiments. The octanol:water partitioning of DMI and IDMI was determined by shaking together equal volumes of octanol and distilled water and a small amount of one of the following: [3H]DMI, unlabeled DMI, [125I]DMI, or [131I]DMI. The phases were allowed to separate. The octanol:water partition coefficient was determined by measuring the amount of (I)DMI in equal volumes of each phase by beta or gamma counting or UV absorbance at 270 nm.
blood partition experiments. [131I]DMI (1.1 ± 0.2% impurity) was added to heparinized whole blood, RBCs, or plasma.
whole blood experiments. Blood was obtained from rabbits (anesthetized with pentobarbital sodium) and humans (no anesthesia). Less than 0.5 μCi IDMI (20 μl) was added to 1.0 ml of whole blood. The blood was vortexed and then separated into plasma and cellular phases by centrifugation (B microfuge, Beckman Instruments). Plasma and RBCs (100-μl aliquots) were removed and counted in a NaI(Tl) well counter (Harshaw crystal, Tennelec NIM electronics). The RBCs were not washed. In separate experiments, IDMI was added to whole blood, and the phases were separated as described above. After the entire plasma phase was removed, the cellular fraction was washed three times with Krebs-Ringer bicarbonate buffer (KRB). After each rinse the KRB-cell mixture was recentrifuged and the supernatant was removed for counting. After the last centrifugation the cell fraction was counted.
plasma fractionation experiments. Radioactive IDMI was added to plasma, and the plasma proteins were separated by differential precipitation using (NH2)2SO4 (6). [131I]DMI was added to plastic microfuge tubes containing heparinized human plasma (at 24°C). After vortexing, the IDMI and plasma were allowed to equilibrate for 10 min before weighed amounts of ammonium sulfate were added to each tube. The samples were vortexed, allowed to equilibrate for 2 h, vortexed again, and the protein left to precipitate over a 2-day period. The samples were then centrifuged, and the supernatant and precipitated protein were counted separately. An aliquot of each supernatant was diluted (1:10) and the protein content measured by UV absorbance (280 and 254 nm using a Varian DS-100 spectrophotometer). Plasma without ammonium sulfate was also measured spectrophotometrically to determine the total amount of plasma protein. Protein in 500 μl of each of the remaining supernatants was precipitated with trichloroacetic acid (final concentration 15%). After centrifugation, the supernatant and precipitate for these samples were separated and counted. In a separate experiment, IDMI was added to plasma and the total plasma proteins were precipitated by the addition of trichloroacetic acid (15% final concentration). The IDMI activity in each fraction was counted using a NaI(Tl) well counter.
erythrocyte fraction experiments. RBCs from blood samples containing IDMI were separated from the plasma phase by differential centrifugation. Distilled water (4 ml) was added to 2 ml of RBCs to lyse the cells. The mixture was then either centrifuged through a 0.2-μm filter or vacuum filtered through a 0.2- or 0.45-μm filter. Counts remaining on the filters were assumed to be membrane bound.
MICROSPHERE PARTITION EXPERIMENTS
103Ru micro-spheres (New England Nuclear) were sonicated and vortexed, and then 0.7 μCi (50 μl) was added to 1.0 μCi (50 μl) of IDMI (pH 7 in 0.9% NaCl) and shaken in a glass test tube. After 3 min, the mixture was vortexed to disperse the microspheres throughout the solution, and 10 μl (~60,000 spheres) of this solution was added to either 0.75 ml of KRB, 1.0 ml of human blood, or 0.75 ml of rabbit blood in a plastic microfuge tube. After vortexing, the blood or KRB, microspheres, and IDMI were allowed to equilibrate for 1 min. The microspheres were separated by centrifugation and counted in a NaI(Tl) well counter (when blood was used, the blood was rapidly washed 6 times with heparinized 0.9% NaCl, and recentrifuged after each wash to remove the spheres).
[3H]DMI PARTITION COEFFICIENTS IN BLOOD
Rabbit blood: [3H]DMI (95% pure) and blood (100 μl total volume) were vortexed. After 1 min the mixture was centrifuged and the plasma and cellular phases separated. Twenty-microliter aliquots of each phase were solubilized and then counted in a liquid scintillation counter (LS 5800, Beckman Instruments). Human blood: 1 ml of heparinized blood and 20 μl of [3H]DMI were vortexed together. After 1 min, the mixture was centrifuged and the plasma and cellular phases separated. One-hundred microliters of each phase was solubilized and counted in a liquid scintillation counter.
RESULTS
IDMI Partition Experiments
The octanol:distilled H2O partition coefficient was 35.0 for IDMI compared with 4.7 for DMI.
The fractionation of IDMI in erythrocytes and plasma was measured in rabbit and human blood. The partition coefficient, the erythrocyte-to-plasma concentration ratio at equilibrium, was determined in eight humans to be 2.32 ± 0.30 for [125I]DMI and 2.38 ± 0.31 for [131I]DMI; the overall mean for the partition coefficient being 2.35 ± 0.31 on 66 samples of blood, each with the two labels in these eight people. Rabbits showed similar partition coefficients, 2.33 ± 0.62, using 18 samples with each containing the two isotopes. Rinsing the erythrocytes in KRB removed <4% of IDMI dissolved in RBC, indicating an erythrocyte-to-saline partition coefficient much higher than the erythrocyte-to-plasma partition coefficient. [3H]DMI RBC-to-plasma ratios (equal volume of each phase) were 3.70 (n = 1) for rabbit and 1.08 ± 0.45 (mean ± SD, n = 4) for human blood.
Most of the IDMI in the plasma is associated with proteins. As determined by trichloroacetic acid precipitation, in human blood 96.9% of the 131I activity was associated with protein. Fractional precipitation of human blood using (NH4)2SO4 and trichloroacetic acid showed that 82% of the IDMI coprecipitated with albumin (57% of the protein), while 16.5% of the IDMI coprecipitated with globulins (43% of the total protein) (Table 1).
TABLE 1.
Association of IDMI with plasma proteins
| Protein Fraction | % Protein Precipitated | %IDMI in Fraction |
|---|---|---|
| Albumin | 56.7 | 81.9 |
| α- and β-Globulins | 12.0 | 8.8 |
| α-, β-, and γ-Globulins | 7.7 | 1.3 |
| γ-Globulins | 23.6 | 6.4 |
| Supernatant after TCA addition | 1.6 |
Ammonium sulfate was used to precipitate the plasma proteins differentially (Fruton and Simmonds, 1958). Trichloroacetic acid (TCA, 15% final concentration) was used to ensure complete precipitation. Plasma was obtained from heparinized human blood (24°C). IDMI, 2-iododesmethylimipramine.
When RBCs were incubated with IDMI, lysed, and then the membranes separated from the other constituents, 90–95% of the IDMI activity in human RBCs was associated with the membrane fraction.
In the course of this investigation we became concerned because the comparison of the regional deposition of microspheres to the regional deposition of IDMI in isolated saline-perfused hearts (mixed bolus injection) had a suspiciously high correlation coefficient. The high correlation could have been partially due to the binding of IDMI to microspheres. When IDMI and microspheres were mixed together in KRB for several minutes and then the microspheres removed by centrifugation 43.4 ± 3.9% of the IDMI was associated with microspheres. When IDMI and microspheres were mixed together in blood 14.8 ± 2.2% of the IDMI was bound to the micro-spheres. Consequently in experiments reported herein, IDMI and microspheres were injected in separate syringes.
METHODS
Animal Experiments
The partition experiment data provide an indication of the association of IDMI with various elements of blood. To test whether IDMI could be used as a cardiac blood flow marker we determined the extraction and retention of IDMI in a variety of preparations designed to represent the effects of high flow, perfusate composition, and recirculation.
Isolated saline-perfused rabbit hearts
Male New Zealand rabbits (~3 kg) were anesthetized with pentobarbital sodium. The heart was removed and the aorta placed around a glass cannula. The heart was retrograde perfused with KRB as previously described (12). A nonrecirculating perfusion system was used to avoid obscuring the tail of the outflow curve. A mixed bolus of [131I]DMI (10 μCi), [14C] sucrose (5 μCi), and 125I-albumin (5 μCi) was injected into the aortic root, and right ventricular outflow was collected as a series of samples of 2- or 10-s duration each. Aliquots of the outflow samples were counted by liquid scintillation.
Isolated blood-perfused hearts
Two New Zealand white rabbits (~3 kg), that had been blood crossmatched for minimal reaction, were used for each experiment in this section. The support rabbit (the larger of the two) was anesthetized with pentobarbital sodium; the left jugular vein and carotid artery were cannulated, and an endotracheal tube was inserted. The other rabbit was anesthetized with pentobarbital sodium, and the heart was removed and suspended by attaching the aorta to a stainless steel cannula. Blood circulated from the carotid artery of the support rabbit through a constant flow pump (Minipuls II, Cilson Medical Electronics) to the isolated heart and then returned to the support rabbit via the jugular vein catheter. Heat exchangers were placed before the isolated heart and on the return line to the jugular vein. [131I]DMI (30 μCi) was injected before the first heat exchanger (exchanger volume was ~0.5 ml) and the residual content of the heart was measured with a scintillation probe [NaI(Tl), Harshaw Chemical]. The counts returning to the isolated heart from the carotid of the support animal were measured by a scintillation probe positioned over the isolated heart perfusion line (at no time did the counts in the blood returning to the heart increase to more than a few counts above background). Periodically, blood samples were withdrawn and counted in a scintillation well counter. A custom designed chamber encased separately the heart and inflow line monitoring systems within a minimum of 2 in. of lead shielding. At the end of each experiment the heart was counted in a NaI(Tl) well counter. The last point of the externally-detected residual contents agreed with the actual residual contents of the hearts within 2%.
In one experiment, [131I]DMI was injected while the heart was perfused with KRB (for 9 min), then the perfusate was changed to 3% bovine serum albumin in KRB (for 9 min), back to KRB (for 7 min), and then the perfusate was changed to blood from a second rabbit as described above (for 60 min). IDMI was detected externally. The flow was the same for all three perfusates.
In vivo studies
Male New Zealand rabbits (~3 kg) were anesthetized with pentobarbital sodium. Catheters were placed in the jugular vein (to vena cavae), carotid artery (to aortic arch), right ventricle, and left atrium. To determine the relative deposition of IDMI with time, a mixed bolus of IDMI and 103Ru and 46Sc microspheres (10.9 ± 0.3 and 11.0 ± 0.4 pm, respectively, mean ± SD) (New England Nuclear) was injected into the left atrium. Arterial (aortic) and venous (right ventricle) blood samples were obtained at 4- or 10-s intervals and were counted using a NaI(Tl) scintillation probe. KCl was injected into the left atrium to stop contraction and thus blood flow. The hearts were sectioned into 5 pieces and counted in a NaI(Tl) well counter. To determine the heterogeneity of deposition densities, a mixed bolus of [125I]DMI and [131I]DMI was injected into the left atrium; three-to-five heart beats later a mixed bolus of 103Ru and 141Ce-labeled microspheres (15.9 ± 0.2 and 15.5 ± 0.2 μm, respectively) was injected into the left atrium. The hearts were removed from the chest 1 min after injection of the IDMI and immediately immersed in liquid N2. The hearts were then sectioned by a predetermined scheme into rings, sections, and endothelial-toepithelial slices to yield ~100 pieces. These pieces were then counted in a NaI(Tl) well counter.
Data analysis
Raw counts per minute in each isotope window [determined by liquid scintillation or NaI(Tl) scintillation counting] were transferred to a computer (Perkin Elmer 8/32) and converted to disintegrations per minute by matrix inversion using crossover coefficients generated from pure isotopes (γ) or quench curves consisting of at least 20 points each for each pure isotope and backgrounds (β). The amount of each tracer injected (dose) was determined in disintegrations per minute (dpm) from at least 10 aliquots of the injected isotope mixture.
Using the concentration-time curves of tracer emerging from the heart, the transport function, h(t), (fraction of dose·s–1), was calculated from the dpm/ml sample/(dpm injected) × flow in milliliters per second. The residue function, R(t), was calculated from h(t) curves as
where t = time and λ is a variable of integration. The residue function was also calculated from γ-activity-time curves recorded by external detection over blood-per-fused hearts. , where C*(t) is the average detected activity corrected for background counts and spillover and is the peak average corrected activity. Because of noise caused by the beating of the heart and the short data-sampling times, ~4,000 counts/2 s at the peak, a 3- and then a 5-point moving-average smoother was passed through the data, starting about the peak, which occurred about 6-10 s after injection (the bolus took ~2-3 s to traverse the heat exchanger and enter the heart). The instantaneous extraction was calculated from the outflow curves {E(t) = [hR(t) – hD(t)]/hR(t)} where hR(t) is the transport function of the reference tracer and hD(t) is the transport function of the test substance. Emax, the maximal instantaneous extraction, was defined as the maximal value of E(t), usually obtained 5–10 s after injection. Net extraction was calculated from the outflow curves
The functional escape rate, η(t), was calculated from either the transport function and calculated residue function using η(t) = hD(t)/RD(t), or from the residue function, obtained from external detection, using η(t) = – (dRD/dt)/RD(t).
Deposition density profiles (the fractional mass as a function of the relative concentration) were constructed from the concentration of IDMI or microspheres in each small, weighed piece of heart. The relative deposition density, di, of a tracer in a given piece (i) can be described as follows: di = [Ci/mi]/[ΣCi/ΣCi/Σmi], where Ci is the activity of the tracer in a given piece (dpm) (ΣCi is the total activity of the tracer in the entire heart), and mi is the mass (g) of a given piece (Σmi is the total heart mass). The fractional mass of the heart with that relative concentration of deposited tracer, wi, = Σ[mi in the class with density di]/[(Σmi) (class width Δ(di)]. Assuming uniform labeling and deposition of the tracer in proportion to regional flow per gram, fi = di, where the relative flow, fi (dimensionless) is the actual flow (ml · g–1 min–1) in each piece relative to the average flow for the entire heart.
RESULTS
Animal Experiments
Isolated saline-perfused hearts
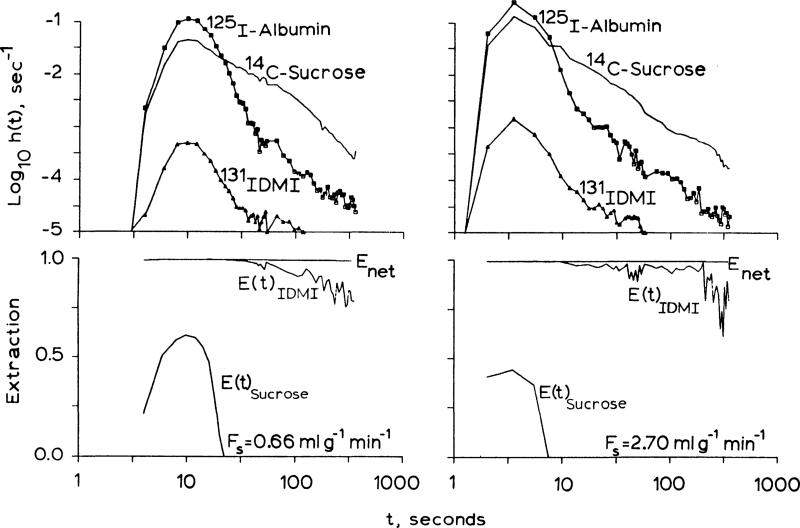
outflow dilution curves. h(t) for albumin, sucrose, and IDMI obtained from isolated hearts perfused with KRB are shown in Fig. 2. IDMI has an instantaneous extraction, E(t), of greater than 99% at times up to and past the mean transit time of the intravascular reference tracer, albumin. Emax ranged from 99.8% to 99.4% for perfusate flows from 0.66 up to 3.47 ml·g–1 · min–1. Extraction was incomplete because of contaminants (e.g., free I-) or permeability limitation. Sucrose, molecular weight 342, only enters the interstitial space through the clefts between the endothelial cells. Because the extraction of IDMI is greater than the extraction of sucrose, IDMI must either pass into or through endothelial cells or perhaps attach to their luminal surface. The mechanism of retention is not revealed by the extraction and may be governed by processes anywhere in the extravascular region. The high lipid solubility of IDMI aids in its passage through cell membranes, which would allow the high extraction, but carrier-mediated transport or binding at cell surfaces could also occur.
Fig. 2.
Upper panels: outflow indicator-diultion curves fore iododdesmethylimipramine (IDMI), sucrose (extracellular marker), and albumin (intravascular marker) from a Krebs-Ringer bicarbonate buffer-perfused isolated rabbit heart at two flows. Time scales are logarithmic (last point is at 7 min). Logarithmic ordinate covers four orders of magnitude. Lower panels: high instantaneous extractions for IDMI [E(t)] indicate rapid exit from vascular space. High IDMI net extraction [Enet (t)] values indicate long retention.
RESIDUE FUNCTIONS
R(t) is the fraction of tracer retained in the heart as a function of time. The retention of 131I-albumin after four injections spaced 15 min apart was, 5 min after the last injection, only 1.10% of one dose (or 0.28% of the 4 doses) in one heart, and was 1.05% of one dose in another heart treated similarly. This attests to the stability of endothelial barrier after an hour or more of perfusion. (These injectates contained ~1% free iodide, no iodinated amino acids or small peptides, and about 0.1% albumin aggregates that were retained by a 0.2-μm filter.)
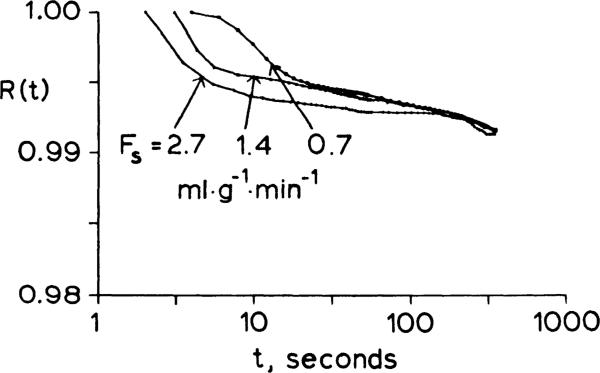
Three IDMI residue function curves obtained at different flows from one heart are shown in Fig. 3. Tracer loss was initially greater at higher flows. From 2 to 7 min, the fraction retained was similar at all flows and above 90%.
Fig. 3.
Residue functions for 2-iododesmethylimipramine at 3 different flows in one isolated Krebs-Ringer bicarbonate-perfused rabbit heart. Fs is perfusate flow; retention after 1 min is almost unaffected by flow.
NET EXTRACTIONS
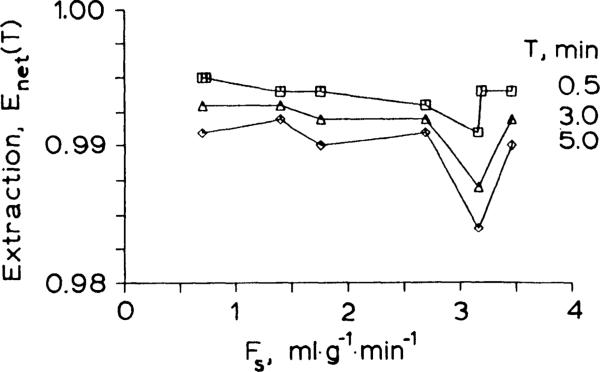
Enet(t) is the fraction of IDMI retained in the heart relative to the fraction of the albumin that has appeared in the outflow. Data from eight pulse injections of IDMI and albumin are shown in Fig. 4. Each set of vertically aligned points are from one heart (2 hearts were stopped after 30 s). In six hearts the retention was more than 98% after 5 min.
Fig. 4.
Net extractors of 2-idododesmethylimipramine in an isolated Krebs-Ringer bicarbonate-perfused heart at times (T) at various perfusate flows. Extraction (Enet) equals residue function at test times (RD(t) at times after the tracer albumin has washed out (about 1.5 min). Lines join points from different runs at the same time, T, after injection of the tracer at different flows.
FRACTIONAL ESCAPE RATES
η(t) Is an overall measure of the rate of tracer loss from the heart. The average fractional escape rates in six hearts were 12.9 × 10⁻⁴ ± 4.4 × 10⁻⁴ min–1 at 1 min, 5.2 × 10⁻⁴ ± 2.6 × 10⁻⁴ · min–1 at 2 min, and 5.3 × 10⁻⁴ ± 1.3 × 10⁻⁴ · min–1 at 5 min, respectively. These loss rates are low after the first minute and are almost independent of flow. Thus the rate of loss is presumably governed by the rate of release from binding sites, with perhaps minor additional impedance by diffusional resistance in the interstitial space and at endothelial membranes.
Isolated blood-perfused hearts
RESIDUE FUNCTIONS
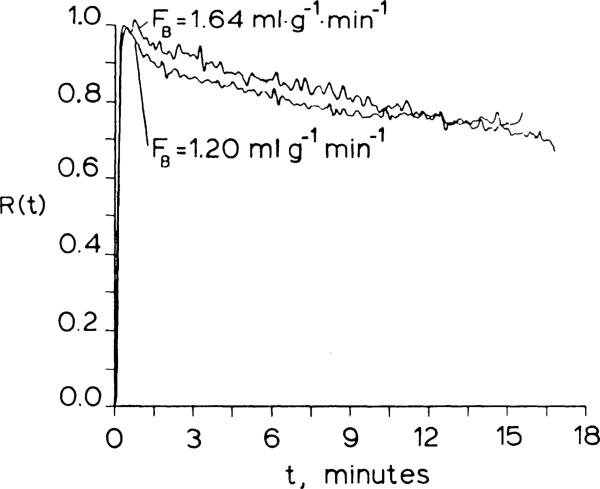
Curves of R(t) obtained following bolus injections of IDMI from two isolated blood-perfused rabbit hearts are shown in Fig. 5. The retention of IDMI was 98% at 1 min at a blood flow of 1.64 ml·g–1·min–1 (hematocrit = 30%) with a normal-pO2. In the second heart, perfused with blood from a hypoxic donor rabbit at a blood flow of 1.20 ml·min–1 (hematocrit = 32%). the retention was 95% at 1 min, possibly attributable to high circulating catecholamine levels that occur in hypoxic animals (1, 10, 15). The residual content in both hearts was 77% after 12 min.
Fig. 5.
Residue functions from two isolated blood-perfused rabbit hearts. Retention at 1 min was greater than 95% but washout was more rapid than in Krebs-Ringer bicarbonate-perfused hearts.
FRACTIONAL ESCAPE RATES
In one heart, IDMI was injected while the heart was being perfused with KRB. After 9 min, the perfusate was changed to KRB containing 3% bovine serum albumin for an additional 9 min. Then for 7 min it was perfused with KRB as a control. Finally it was perfused with blood for 1 h. The initial extraction was greater than 99.5% and η was low. Switching to KRB containing albumin did not appreciably alter the fractional escape rate, in spite of high affinity of albumin for IDMI (Table 1). Perfusion of the heart with blood increased the fractional escape rate to 1.67%. min–1, which was 32 times the fractional escape rate with KRB perfusion. The average fractional escape rate for all three isolated blood-perfused hearts was 1.85 ± 0.16%·min–1. Thus the cellular and globulin binding sites in blood, which were described in the in vitro partition experiments, diminish retention of IDMI in the tissue.
In uiuo studies
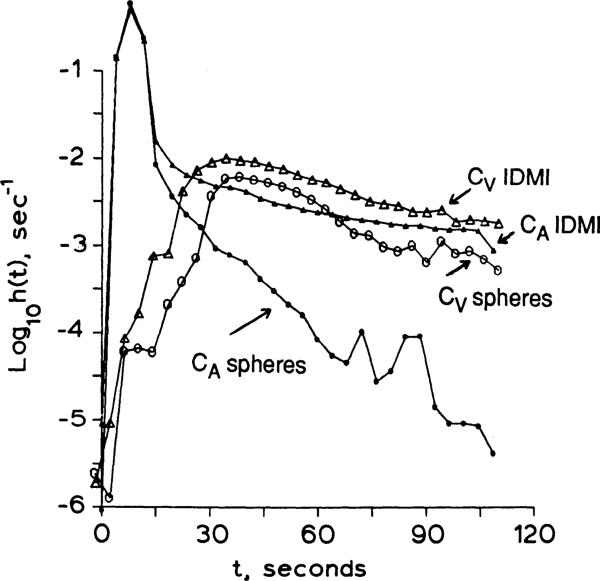
Indicator-dilution curves for IDMI and microspheres injected as a mixed bolus into the left atrium of an open-chested rabbit are shown in Fig. 6. The integrated A–V difference gives a measure of retention in the tissues of the body
where CA is the activity per milliliter of aortic blood and CV is the activity per milliliter of blood from the right ventricle. Body tissue retention was 92 ± 2% (n = 4) after 1 min, 89 ± 6% (n = 5) after 2 min and 90 ± 10% (n = 2) after 10 min. The extraction of IDMI by the systemic circulation would be less than the extraction obtained in the isolated blood-perfused heart if the other organs extract less IDMI than the heart. The tail of the arterial curve of Fig. 6 shows that the IDMI recirculation is ~0.2% of the peak arterial value at 15 s and ~2% at 30 s, indicating high extraction by most of the body. At 45 s the venous concentration of IDMI (Fig. 6) is more than twice the arterial, indicating that pulmonary extraction is more than 50% (56.2 ± 14.7% x̄ ± SD, n = 4). The tissue retention of microspheres, calculated in the same way, was 97 ± 1.3% (n = 6) after 2 min. This value is similar to 9-μm microsphere deposition in intact dog hearts, which ranged from 97 ± 2% to 94 ± 4% at 2 min for normal flows (5). Microsphere recirculation peaks were about 0.2 to 0.1% of the peak arterial value.
Fig. 6.
Dulution curves for 2-iododesmethylimipramine (IDMI) and microspheres in aortic arch and right ventricle (RV) following left atrial injection in an intact anesthetized rabbit. Small symbols, aorta; large symbols, RV; triangles, IDMI, circles, average of 10.9 ± 0.3 and 11.0 ± 0.4-μm-diameter spheres. Cardiac output was 167 ml/min.
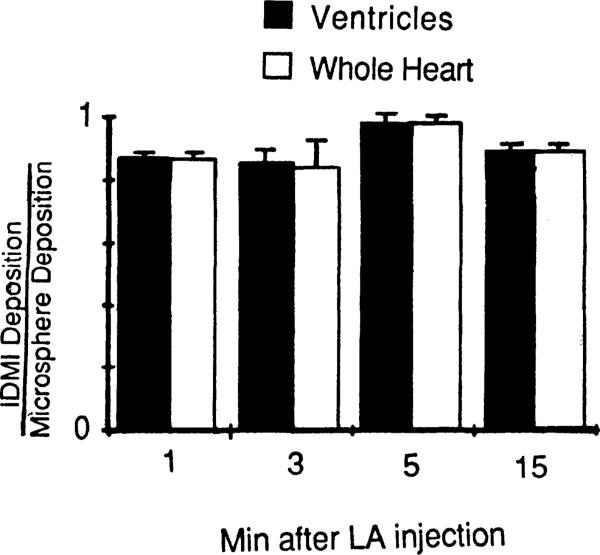
In four similar experiments, 11-μm microspheres, labeled with 103Ru or 141Ce, were injected simultaneously with IDMI into the left atrium. After cardiac arrest with KCl at 1, 3, 5, or 15 min, the tracer contents of the ventricles and the whole heart were determined as a fraction of the injected dose and are presented in Fig. 7. The residual contents of IDMI in whole heart and ventricle were less than those of microspheres, as would be expected from incomplete extraction of IDMI, but averaged only 11% less for the four hearts. The ratios of IDMI to mean microsphere deposition are the same for the ventricles alone, suggesting that extraction is the same in different regions of the heart. If the fraction of cardiac output going to the heart over the 15 min were stable, then recirculation of IDMI would tend to keep the IDMI-to-microsphere ratio more nearly constant, which appears to be the case. Likewise, if there is spatial stability of regional myocardial flows (11), then there will be little redistribution of IDMI within the heart, allowing time for imaging, which would be especially important if gating should be required for image acquisition.
Fig. 7.
Retention of 2-iododesmethylimipramine (IDMI) in 4 hearts compared with 11-μm diameter microspheres at 4 different times. Although IDMI washes out, the recirculation delivers more tracer IDMI, so that the underestimation of flows from IDMI deposition is only slightly different at 15 min than at 1 min. Each heart was sectioned into 4 ventricular piecesand 1 piece containing the atria and aortic stub. LA, left atrium.
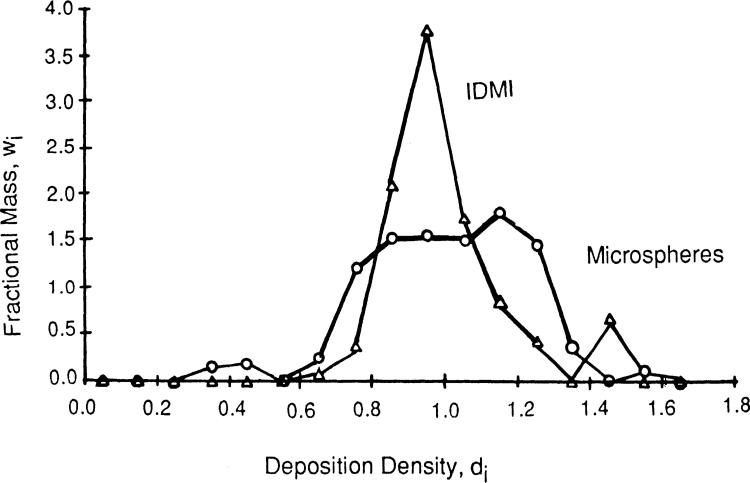
In a preliminary study, IDMI and 15-μm diameter microspheres were separately injected into the left atrium of an anesthetized open-chest rabbit. The probability density functions for IDMI and microspheres are shown in Fig. 8. The mean left ventricular flow, relative to the whole heart flow, was 1.17 ml·g–1·min–1 with a relative dispersion (the standard deviation divided by the mean) of 23% for IDMI deposition and 1.19 ml·g–1·min–1 (mean) and 35% (relative dispersion) for micro-sphere deposition.
Fig. 8.
Probability density functions for 2-iododesmethylimipramine (IDMI) (open triangles) and 11-μm spheres (open circles). IDMI and microspheres were simultaneously injected through different catheters into the left atrium of an open-chest rabbit. One minute after injection, flow was stopped, and the heart was frozen. Fractional mass, wi, of ventricles having a particular flow or deposition density, di, form a density function with area = 1.0 and mean flow = 1.0. Relative dispersion (standard deviation divided by mean) was 23.5% for IDMI and 34.4% for microspheres.
DISCUSSION
IDMI is a nearly ideal marker for regional blood flows. Its association with red cells and plasma proteins is weak enough to permit high extraction during transorgan passage. Its retention in heart tissue is great enough to allow for reasonable time between injection and removal of the heart for sectioning and counting to determine regional deposition densities (which are proportional to regional blood flow). It cannot be used for repeated observations (too few labels) over hours (washout is too fast). Micro-spheres presumably are better for such purposes, although rheological events at branch points may detract from their reliability (7, 14, 18, 19).
If IDMI in blood is partitioned preferentially into erythrocytes, does its deposition provide a measure of flow of blood, or only of erythrocyte flow? Within an organ, the regional flow estimated using IDMI is weighted according to the fraction delivered via plasma and erythrocytes as outlined in the APPENDIX. This differentiation is important only if there is separation of plasma and erythrocytes so that the collected effluent from a region has a hematocrit different from the inflow large vessel hematocrit. (The value of the intracapillary hematocrit or the presence of a Fahreus-Lindquist effect is of no consequence so long as the loss of IDMI from blood to tissue is nearly complete in a single passage.) For the purpose of estimating regional flows, our laboratory procedure is to section the tissue into ordered pieces of 0.1–0.2-g size. Such pieces contain 100–200 microcirculatory units or 300,000–600,000 capillaries (3). Thus a hematocrit shift at a branch point (plasma skimming) would have to occur in arterioles large enough to supply perhaps 100,000 or more capillaries. Such vessels are relatively large, probably a few hundred microns in diameter, and therefore too large to exert large effects on hematocrit changes at branches; hematocrit changes are more likely to occur in vessels of a size in which intravascular hematocrit is reduced; those less than 100-μm diameter.
A numerical example (detailed in the APPENDIX) shows that flow separation at a bifurcation, raising the hematocrit in one branch while lowering it in the other, results in depositions in the supplied regions which are closer to measuring the volume flow of whole blood than to measuring erythrocyte flow.
Freely diffusible tracers which distribute rapidly and more or less evenly between red cells and plasma, such as antipyrine, xenon, water, would presumably distribute more closely proportional to the flow of whole blood than would IDMI or microspheres if there were large differences in regional hematocrits amongst regions that contain so many exchange units (see APPENDIX). Their disadvantage compared with IDMI or thallium is the lack of a mechanism for prolonged retention in tissue. The fraction of tracer water retained in a rabbit heart at the end of 1 min, for example, was only 70% at a flow of 0.65 ml·g–1·min–1 and less than 0.1% at a flow of 6 ml·g–1·min–1 (12). Thus the use of freely diffusible tracers as flow markers requires model-based mathematical carrections.
Compounds such as K+, Rb+, and Tl+ are better retained than water, being sequestered in the cells. How- ever, they are only 40–80% extracted because of low permeability of the capillary barrier (2, 4). For example, after 3 min at flows of 1 and 2 ml·g–1·min–1, potassium and thallium have net extractions of 50 and 70% in the heart. The retention is poorer at higher flows.
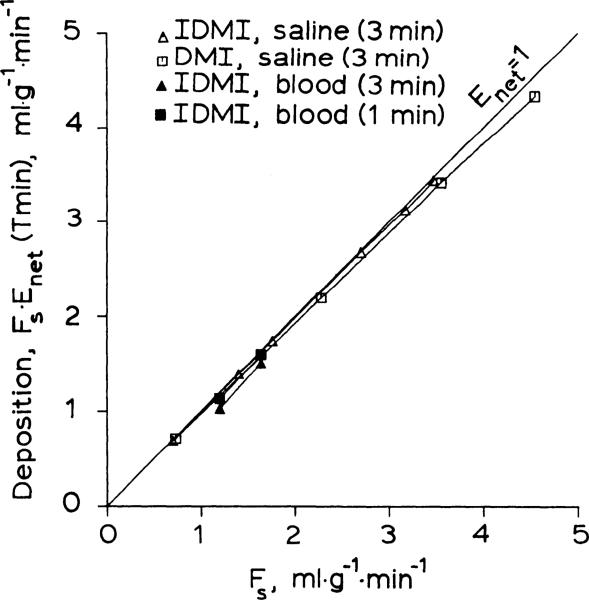
[3H]desmethylimipramine is well extracted and retained in isolated saline-perfused rabbit hearts and is a suitable flow marker under those conditions. IDMI has the advantage that it can be detected by its beta, gamma, or positron emissions, depending on which isotope of iodine is used. IDMI was about 7 times more lipid soluble than DMI as estimated from the octanol:H2O partition coefficient, which may explain its more complete extraction. The deposition of IDMI in the tissue [Enet(at time T) × flow] was less dependent on flow and, at the same flow, was greater than the deposition for DMI (Fig. 9).
Fig. 9.
Deposition of 2-iododesmethylimipramine (IDMI) and desmethylimipramine (DMI) in the heart plotted vs. perfusate (saline or blood) flow. Deposition, the product of net extraction and flow (Fs), is net clearance from perfusate into tissue during T minutes. Perfect deposited tracer would have Enet = 1.0 for all flows, for all times T. DMI data are from Ref. 12.
Radioiodination of DMI provided an externally detectable marker for measuring flow in blood-perfused organs. The erythrocyte-to-plasma ratio and the amount of IDMI bound to plasma proteins were high. These binding sites could decrease the extraction of IDMI in blood-perfused hearts relative to the extraction observed into isolated saline-perfused hearts. If the extraction of IDMI is sufficiently compromised, particularly if it is be in proportion to flow. IDMI retention curves in isolated blood-perfused rabbit showed that IDMI retention was reduced by blood perfusion, but that IDMI retention was still 98% at 1 min at a blood flow of 1.64 ml·g–1·min–1. Thus IDMI is useful for measuring regional flow in isolated blood-perfused hearts (Fig. 9).
The blood-partition data also suggest that the use of IDMI as a blood flow marker could be improved by the use of competitor for the blood binding sites. If the association of IDMI with blood could be reduced, then the retention of IDMI in blood perfused hearts should be similar to that in saline-perfused hearts. This might allow IDMI to be used for regional flow measurements in two or more experimental conditions in series. The blood partition data also suggest that IDMI may be useful as a flow marker in humans.
It is not actually known that IDMI deposits in the capillaries, although that seems very likely. There is very little DMI in the aorta and large coronaries of isolated hearts (12), despite the high concentration, because the surface area is so small. Arteriolar surface areas are smaller; since there are about 100 terminal arterioles per piece of tissue of the size we cut, we would not distinguish arteriolar deposition from capillary deposition. The clearest argument for capillary deposition dominating is that the capillary surface area is large (500 cm2/g) compared with arterioles (0.3 cm2/g) and venules (double the arteriole value), and that some of the injected IDMI passes all the way into the effluent (Fig. 2). With extraction approaching 100% one can expect IDMI to be deposited preferentially nearer the arterial end of the capillary (8, 9), although this should not affect the accuracy of estimation of flow unless the size of the divisions of the tissue were close to the size of a single capillary unit (approximately 2 × 10⁻⁶ g), about 1/100,000 of the size of pieces we normally use.
While the effects of recirculation, varying extraction, and loss of IDMI degrade the precision of the measurement of absolute flow, the effects on the relative heterogeneity of flow are minimal. We infer from the similarity of the rate of loss of IDMI from whole hearts at different flows that the loss from each region is independent of flow. The intact animal studies demonstrate that the amount of recirculating tracer is delivered in proportion to flow. In baboons (11) the regional flows change little with time; in this situation the deposition of recirculating tracer is proportional to the initial regional flow and offsets the loss of IDMI from each region. This rationale is dependent on the concentration of IDMI being below the level required to saturate the binding sites (i.e., the concentration is in the linear range). That IDMI is below the concentration required for saturation is shown by the experiments where there was no difference in expected extraction or retention between any of 5 successive bolus injections of IDMI in an isolated saline-perfused rabbit heart (each injection contained 10 μCi = 5 × 10⁻⁶ mg = 1.3 × 10⁻¹⁴ mol IDMI, e.g., see Fig. 3 where the results of injections 1, 3, and 5 are shown). Thus the measurement of relative flows with IDMI via tomographic imaging or tissue sectioning cannot be as sensitive to the time of sampling as are techniques using less well retained tracers.
The higher extraction and longer retention of IDMI in isolated saline-perfused rabbit hearts suggests that IDMI may have higher affinity for cardiac receptors than does DMI. When a heart was perfused with cold DMI (up to 10 μM) subsequent to the injection of [131I]DMI the fractional escape rate was still below 0.1%. Blood from a hypoxic donor animal (and thus high circulating catecholamine concentration) did not appreciably alter IDMI kinetics (extraction and the fractional rate of loss were only slightly lowered when compared with values obtained from a heart perfused with normoxic blood). Furthermore, the high percentage of IDMI binding to blood proteins and cell membranes suggests that there may be a significant amount of nonspecific binding contributing to the extraction and retention of IDMI by the heart. Receptor characteristics of IDMI remain to be tested.
The variety of iodine radioisotopes that can be used to radiolabel IDMI allows this compound to be a versatile flow marker for use in saline or blood-perfused hearts. The rapid radiochemical synthesis is consistent with the use of 122I, a short-lived generator-produced positron-emitting isotope. Further, the high systemic extraction indicates that IDMI may be useful to measure local flow in other organs besides the heart.
Acknowledgments
We are grateful for the technical assistance of Tyler Moffet, Susan Blair, Craig Althen, Dr. David Wemmer, and Erik Shaukland, and to Malcolm McKay, Barbara King, and Geraldine Crooker for assistance in preparation of the manuscript. Jana L. Miller assisted in the initial chemical characterization of IDMI.
DMI was a gift of USV Pharmaceuticals.
Portions of this work were supported by National Heart, Lung, and Blood Institute Grants HL-19139 and HL-19135.
APPENDIX
Effect of Hematocrit Variation on Local Deposition of a Completely Extracted Tracer
Two types of hematocrit variation can be considered, variation along the vascular pathway (differential velocities of erythrocytes and plasma), and variation among parallel pathways.
The first type has no influence on deposition whatsoever. The deposition, when complete, equals the delivery, which is governed by the entering flows, not the intracapillary hematocrit, which does not enter the expression
| (A1) |
In steady state FB entering = FB exiting. If extraction and retention are complete, then CB exiting = 0, so that when the same concentrations enter all regions, the local depositions are proportional directly to flow. The view of “flow” can now be refined
| (A2) |
where the subscript R refers to red blood cells, B to whole blood, P to plasma, and Hct is the large vessel hematocrit, λ the erythrocytzplasma partition coefficient, F is flow, C is the concentration of the marker. When vessel diameters are small so that steric hindrance diminishes the fraction of the vessel lumen accessible to erythrocytes, their velocity increases relative to plasma
| (A3) |
where v is the velocity and A is the vessel cross-sectional area. In large vessels Ap/AR = 1.0 for all practical purposes, but in small vessels the hematocrit Hctcap, is
which may be substantially lower than the large vessel hematocrit. Such steric effects produce the Fahreus-Lindquist effect: for erythrocytes there are higher velocities and shorter transit times than for plasma, as well as the lower intracapillary hematocrit. But since the outflow hematocrit is the same as the inflow hematocrit, the flows Fp and FR are not influenced, and neither are the regional depositions when extraction is 100%. However, in the smallest vessels with lowest AR/Ap, the highest uR/uP, and the shortest red cell transit time through the capillary, there is the greatest possibility for the failure of extraction to be complete.
The second type of hematocrit variation, differences among parallel vessels, is relevant to the question of whether or not it might cause error in estimates of regional flows in pieces of tissue of the size cut in most studies. The basis is exemplified by considering a simple bifurcation, one artery (denoted by subscript 0) giving rise to two branches (denoted by subscripts 1 and 2). The total flow must be conserved
| (A4) |
as must the quantity of tracer deposited over the period from 0 to T, ignoring possible differences in times that the material takes to be deposited
| (A5) |
The quantitative question to be examined is, how much does the ratio of deposited amounts in the two regions FB1·CB1/(FB2·CB2) differ from the ratio of the flows of whole blood FB1/FB2 when the hematocrits H1 and H2 in the two branches differ. From Eq. A2, for complete extraction during steady flows, the ratio of the deposited amounts, q1 and q2, is
| (A6) |
Given that there is no significant loss of tracer into the vessel walls before the branch producing a disequilibrium between erythrocytes and plasma, or that equilibrium is very rapid, then the plasma concentrations entering and within each branch are the same. Since Cp1 = Cp2, because they both derive from the inflow Cp0, the ratio of deposition densities to the ratio of local flows is
| (A7) |
where α1 is the faction of flow going to path 1, FB1/FB. For example, with α1 = 0.5, equal flows in the two branches, a partition coefficient, λ, of 2.5, and a hematocrit of 0.40 in the parent channel giving rise to differing effluent hematocrits H1 = 0.44 and H2 = 0.36, a 20% difference, then (q1/q2)/(FB1/FB2) = 1.08. The ratio of local depositions is only 8% higher than the ratio of local blood flows, whereas the ratio of red cell flows, FR1/FB2, is 0.44/0.36 or 1.22. If the hematocrit change were twice as large, going from 0.40 to 0.48 in branch 1 and 0.32 in branch 2, a 40% difference, then the ratios of depositions to flows errs by 16%, i.e., (q1/q2)/(FB1/FB2) = 1.16, whereas FR1/FR2 = 1.5.
REFERENCES
- 1.Ando H. Simultaneous observation on adrenal cortical and medullary secretion to acute hyboxia in anesthetized dogs (Abstract). Jpn. Circ. J. 1972;36:391. [Google Scholar]
- 2.Bassingthwaighte JB, Winkler B. Kinetics of blood to cell uptake of radiotracers. In: Columbetti LG, editor. Biological Transport of Radiotracers. CRC Press; Boca Raton, FL: 1982. pp. 97–146. [Google Scholar]
- 3.Bassingthwaighte JB, Yipintsoi T, Harvey RB. Microvasculature of the dog left ventricular myocardium. Microvasc. Res. 1974;7:229–249. doi: 10.1016/0026-2862(74)90008-9. [DOI] [PMC free article] [PubMed] [Google Scholar]
- 4.Budinger TF, Yano Y, Huesman RH, Derenzo SE, Moyer BR, Mathis CA, Ganz E, Knittel B. Positron emission tomography of the heart. Physiologist. 1983;26:31–34. [PubMed] [Google Scholar]
- 5.Consigny PM, Verrier ED, Payne BD, Edelist G, Jester J, Baer RW, Vlahakes GJ, Hoffman JIE. Acute and chronic microsphere loss from canine left ventricular myocardium. Am. J. Physiol. 1982;242:H392–H404. doi: 10.1152/ajpheart.1982.242.3.H392. Heart Circ. Physiol. 11. [DOI] [PubMed] [Google Scholar]
- 6.Fruton JS, Simmonds S. General Biochemistry. John Wiley; New York: 1958. p. 19. [Google Scholar]
- 7.Fung YC. Stochastic flow in capillary blood vessels. Microvasc. Res. 1973;5:34–48. doi: 10.1016/s0026-2862(73)80005-6. [DOI] [PubMed] [Google Scholar]
- 8.Goresky CA, Bach GG, Nadeau BE. On the uptake of materials by the intact liver—the transport and net removal of galactose. J. Clin. Invest. 1973;52:991–1009. doi: 10.1172/JCI107300. [DOI] [PMC free article] [PubMed] [Google Scholar]
- 9.Goresky CA, Bach GG, Rose CP. Effects of saturating metabolic uptake on space profiles and tracer kinetics. Am. J. Physiol. 1983;244:G215–G232. doi: 10.1152/ajpgi.1983.244.2.G215. Gastrointest. Liver Physiol. 7. [DOI] [PubMed] [Google Scholar]
- 10.Houssay BA, Molinelli EA. Adrenal secretion produced by asphyxia. Am. J. Physiol. 1926;76:538–550. [Google Scholar]
- 11.King RB, Bassingthwaighte JB, Hales JS, Rowell LB. Stability of heterogeneity of myocardial blood flow in normal and awake baboons. Circ. Res. 1985;57:285–295. doi: 10.1161/01.res.57.2.285. [DOI] [PMC free article] [PubMed] [Google Scholar]
- 12.Little SE, Bassingthwaighte JB. Plasma-soluble marker for intraorgan regional flows. Am. J. Physiol. 1983;245:H707–H712. doi: 10.1152/ajpheart.1983.245.4.H707. Heart Circ. Physiol. 14. [DOI] [PMC free article] [PubMed] [Google Scholar]
- 13.McKillop A, Fowler JS, Zelesko MJ, Hunt JD, Taylor EC, McGillivray G. Thallium in organic synthesis. IX. Facile thallation of aromatic compounds with thallium(III) trifluoroacetate. Tetrahedron Letters. 1969;29:2423–2426. [Google Scholar]
- 14.Phibbs RH, Dong L. Nonuniform distribution of microspheres in blood flowing through a medium-size artery. Can. J. Physiol. Pharmacol. 1970;48:415–421. doi: 10.1139/y70-064. [DOI] [PubMed] [Google Scholar]
- 15.Steinsland OS, Passo SS, Nahas GG. Biphasic effect of hypoxia on adrenal catecholamine content. Am. J. Physiol. 1970;218:995–998. doi: 10.1152/ajplegacy.1970.218.4.995. [DOI] [PubMed] [Google Scholar]
- 16.Taylor EC, Kienzle F, Robey RL, McKillop A, Hunt JD. Thallium in inorganic synthesis. XXIII. Electrophihc aromatic thallation. Kinetics and applications to orientation control in the synthesis of aromatic iodides. J. Am. Chem. Soc. 1971;93:4845–4850. [Google Scholar]
- 17.Taylor EC, McKillop A. Thallium in organic synthesis. Accounts Chem. Res. 1970;3:338–346. [Google Scholar]
- 18.Utley J, Carlson EL, Hoffman JIE, Martinez HM, Buckberg GD. Total and regional myocardial blood flow measurements with 25 μ, 15 μ, 9 μ, and filtered 1-10μ diameter microspheres and antipyrine in dogs and sheep. Circ. Res. 1974;34:391–405. doi: 10.1161/01.res.34.3.391. [DOI] [PubMed] [Google Scholar]
- 19.Yipintsoi T, Dobbs WA, Jr., Scanlon PD, Knoop TJ, Bassingthwaighte JB. Regional distribution of diffusible tracers and carbonized microspheres in the left ventricle of isolated dog hearts. Circ. Res. 1973;33:573–587. doi: 10.1161/01.res.33.5.573. [DOI] [PMC free article] [PubMed] [Google Scholar]


