

Abstract
Understanding the factors that contribute to population genetic divergence across a species' range is a long-standing goal in evolutionary biology and ecological genetics. We examined the relative importance of historical and ecological features in shaping the present-day spatial patterns of genetic structure in two related plant species, Beta vulgaris subsp. maritima and Beta macrocarpa. Using nuclear and mitochondrial markers, we surveyed 93 populations from Brittany (France) to Morocco – the southern limit of their species' range distribution. Whereas B. macrocarpa showed a genotypic structure and a high level of genetic differentiation indicative of selfing, the population genetic structure of B. vulgaris subsp. maritima was consistent with an outcrossing mating system. We further showed (1) a strong geographic clustering in coastal B. vulgaris subsp. maritima populations that highlighted the influence of marine currents in shaping different lineages and (2) a peculiar genetic structure of inland B. vulgaris subsp. maritima populations that could indicate the admixture of distinct evolutionary lineages and recent expansions associated with anthropogenic disturbances. Spatial patterns of nuclear diversity and differentiation also supported a stepwise recolonization of Europe from Atlantic-Mediterranean refugia after the last glacial period, with leading-edge expansions. However, cytoplasmic diversity was not impacted by postglacial recolonization: stochastic long-distance seed dispersal mediated by major oceanic currents may mitigate the common patterns of reduced cytoplasmic diversity observed for edge populations. Overall, the patterns we documented here challenge the general view of reduced genetic diversity at the edge of a species' range distribution and provide clues for understanding how life-history and major geographic features interact to shape the distribution of genetic diversity.
Keywords: Cytonuclear genetic diversity, glacial refugia, marine currents, postglacial expansion, spatial genetics
Introduction
Plant populations are often composed of distinct breeding units, and patterns of genetic variation within and among populations are determined primarily by mating system and the neutral microevolutionary process of gene flow (Hamrick and Godt 1996; Duminil et al. 2009). Historical events such as Pleistocene climatic changes have also played a fundamental role in generating phylogeographic structure within species' ranges (e.g., Hewitt 2004). In the northern hemisphere, the alternation of Quaternary glacial and interglacial episodes resulted in substantial changes in species' distribution. These events have left footprints in their genetic structure and may explain the common poleward decrease in genetic diversity exhibited by terrestrial taxa (Hewitt 1999).
From the extensive body of phylogeographic work on European temperate species, it is acknowledged that the Mediterranean Basin acted as a major refugium during these glacial cycles. In particular, the Iberian, Italian, and Balkan Peninsulas have been considered as differentiation centers and origins of postglacial northward expansion (Hewitt 2000). However, the literature remains largely biased with respect to geographic coverage and the type of organism studied. In contrast to Western Europe, North Africa is largely underrepresented. This imbalance is unfortunate, because North Africa harbors hot spots of plant biodiversity and endemism (Médail and Quézel 1997). Furthermore, most of the studies conducted in North Africa have focused on inland woody species (e.g., Lumaret et al. 2002; Migliore et al. 2012) rather than on coastal plants (Ortiz et al. 2007). Coastal plant species offer, however, ideal case studies for interpreting phylogeographic patterns. They have a very wide latitudinal and longitudinal range, but are restricted to a narrow belt along the shoreline, suggesting limited migration routes and/or postglacial recolonization pathways. In addition to climatic oscillations, the regional distribution of coastal plant species may also be influenced by marine currents via seed drift (dispersal), leading to sharp genetic discontinuities or nonintuitive genetic affinities among populations (Kadereit et al. 2005).
Beyond the influence of historical events, patterns of genetic structure across a species range are also informative about contemporary processes. Current spatiotemporal dynamics of plant species' distribution may indeed be influenced by anthropogenic disturbance, acting as dispersal agents through exchanges or interfering with natural recolonization by modifying the landscape (D'Hondt et al. 2012). Human impact on the environment is a long-standing feature of the Mediterranean Basin (Blondel 2006). For example, the long history of agriculture and other ancient and recent human activities have resulted in an evolving landscape mosaic, with land uses changing in space and time. Therefore, population-level processes are highly complex, and spatial genetic structure is thus tightly coupled to ongoing processes that superimpose new signatures on existing natural phylogeographic patterns. The interplay between mating system, geographic distribution, oceanographic features/sea circulation, past climatic changes, and anthropogenic pressures is likely responsible for the current genetic diversity and species distribution of coastal plants along the southern Atlantic coast and the Mediterranean Basin (Rodríguez-Sánchez et al. 2008).
The present study set out to depict large-scale patterns of cytoplasmic and nuclear genetic structure in two related species thought to have contrasting mating systems: the wild sea beet (Beta vulgaris subsp. maritima) and its close relative, Beta macrocarpa. Sea beet is a typical coastal taxon, mainly outcrossing, with a wide distribution from the Canary Islands in the west, northward along Europe's Atlantic coast and Baltic Seas (Biancardi et al. 2012). Sea beet also extends eastward through the Mediterranean Basin along the coastline but also in inland man-made habitats (Desplanque et al. 1999; Arnaud et al. 2009). B. macrocarpa, a self-compatible species, has a more restricted geographic distribution located in inland or coastal habitats in western and eastern Mediterranean areas (Buttler 1977; Letschert 1993; Castro et al. 2013). Elucidating the underlying mechanisms of range shifts and the determinants of population establishment are fundamental questions, especially in the context of climate change. Based on a comprehensive sampling in Western Europe and in North Africa and using nuclear and cytoplasmic data, we thus applied classical F-statistics, Bayesian clustering, and spatial multivariate methods to depict the phylogeographic and genetic structure of both species. Specifically, we asked the following questions:
Do B. vulgaris subsp. maritima and B. macrocarpa show significant genetic differentiation and different genotypic structure indicative of contrasting mating system, as suggested by previous studies based on greenhouse experiments and allozyme survey?
What are the roles of alternative evolutionary processes in shaping different lineages along the southern European/northern African distribution of these two species? We hypothesized that range shift driven by last Quaternary glaciation, ocean circulation patterns, and anthropogenic disturbances could be fundamental processes explaining large-scale patterns of genetic diversity and divergence we observed.
Materials and Methods
The species
The genus Beta is divided into two sections, that is, the Beta section and the Corollinae section (Biancardi et al. 2012). The Beta section includes five taxa: (1) the sea beet (Beta vulgaris subsp. maritima, see Fig. 1), which is considered as the wild ancestor of all cultivated beets; (2) the different forms of cultivated beets (Beta vulgaris subsp. vulgaris), including fodder, leaf, or sugar beets; (3) Beta macrocarpa, which is an annual self-compatible plant thought to reproduce predominantly by autogamy; (4) Beta patula, which is endemic to an islet of the Madeira Archipelago; and (5) Beta vulgaris subsp. adanensis, a self-compatible species that is only found in Eastern Mediterranean areas, Greece and Turkey (Frese et al. 1990; Kadereit et al. 2006; Biancardi et al. 2012). Therefore, in our extensive sampling area in the western Mediterranean, only two species of the Beta section can be found in coastal and inland ruderal habitats: Beta vulgaris subsp. maritima and Beta macrocarpa.
Figure 1.
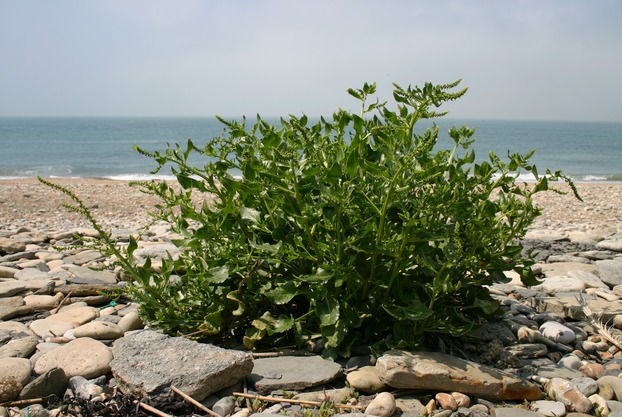
Wild sea beet (Beta vulgaris subsp. maritima), the wild ancestor of all cultivated beets. Sea beet is a typical coastal taxon growing in the supralittoral fringe, typically on beaches of sand or pebbles or associated with rocky substrates.
Sea beet is a short-lived perennial species growing in the supralittoral fringe (Fig. 1), typically on beaches of sand or pebbles, or associated with rocky substrates such as cliffs overhanging the sea (De Cauwer et al. 2010). These ecosystems are characterized by linear physical boundaries, increased salinity, periodic strong winds, and soil instability due to water movements during the highest tides. In addition, a particular wild form of B. vulgaris subsp. maritima has colonized human-disturbed inland habitats in the western part of the Mediterranean area (Desplanque et al. 1999). These inland ruderal beets have founded populations associated with past and present road works (roadsides, car parks), wastelands, rubble deposits, or gardens (Arnaud et al. 2009). Sea beet is a diploid (2n = 18) gynodioecious species, has an outcrossing mating system – enforced by a gametophytic self-incompatibility system with up to four gametophytic S loci – and relies on wind pollination (Owen 1942). No vegetative reproduction occurs, and dispersal is only mediated by seed and/or pollen movements. Seeds are clustered in an irregular dry fruit, forming a multigerm seedball composed of one to eight seeds (De Cauwer et al. 2011). Although this seedball is mainly dispersed by gravity with a large proportion of seeds falling in the vicinity of the mother plant (Arnaud et al. 2011; De Cauwer et al. 2012), it has a corklike layer around the seeds, which may confer buoyancy and make it amenable to dispersal in seawater (see Fievet et al. 2007).
Only flowering characteristics such as tepal morphology allow distinguishing between B. v. subsp. maritima and B. macrocarpa. B. macrocarpa is a self-compatible species thought to be predominantly self-fertilizing (Jung et al. 1993; Bruun et al. 1995). Nonmorphologically distinguishable diploid (2n = 18) and tetraploid (2n = 36) cytotypes occur in B. macrocarpa (Castro et al. 2013). Using diverse accessions of western Mediterranean areas, both cytotypes were found to be annual and fully self-compatible (Buttler 1977; Lange and Debock 1989). Letschert (1993), Bartsch and Ellstrand (1999), and Villain (2007) provided some evidence suggesting nearly complete autogamy in both diploid and tetraploid accessions of B. macrocarpa.
Study area and sampling
We sampled 93 localities distributed along the eastern Atlantic coast, from Brittany, France, to southern Morocco, but also in the Mediterranean region on both sides of the Strait of Gibraltar (Fig. 2A). In Western Europe, samples were collected at 36 sites and labelled from 1 to 36. In Morocco, 52 coastal and inland localities were sampled, among which 32 sites were representative of typical coastal populations collected along the shoreline (labelled from 37 to 68, Fig. 2A) and 20 were from inland ruderal sites (labelled from a to t, Fig. 2A). Five sites in the Madeira archipelago were also sampled and numbered from 69 to 73. In total, 1816 individuals were collected with an average sample size per site of 19.53 (SE ± 6.07). The population labelled 67 was made up of only four individuals and was not included in analyses dealing with mean levels of genetic diversity, such as the estimation of allelic richness. Sampling was carried out during five successive surveys between 2007 and 2011. Fresh leaves from the collected individuals were dried and stored in silica gel at room temperature until DNA extraction. Appendix 1 provides full details on the sampling localities.
Figure 2.

(A) Map of the geographic location of the 93 sampled stations for Beta vulgaris subsp. maritima and Beta macrocarpa. Each B. vulgaris subsp. maritima station is represented by a black diamond. B. macrocarpa stations are symbolized by blue diamonds and stations composed of a mixture of both species by red diamonds. (B) Bayesian clustering following Pritchard et al. (2000). Assignment probabilities of individual memberships of B. vulgaris subsp. maritima and B. macrocarpa into three inferred clusters for the first modal value (K = 3). Each individual is represented by a thin horizontal line (y axis) partitioned into three colored segments that represent the individual's estimated membership fractions to the K = 3 clusters (x-axis). (C) Map of mean population membership probabilities for the three clusters.
Genetic data collection
Extraction and purification of total DNA were performed using a DNeasy 96 Plant Kit following the standard protocol for isolation of DNA from plant leaf tissue outlined in the DNeasy 96 Plant protocol handbook (QIAGEN Inc., Courtaboeuf, France).
Nuclear microsatellites
All individuals were examined for nuclear genetic variation using eight microsatellite loci, named Bvm3 (Mörchen et al. 1996), Gtt1, Caa1 (Viard et al. 2002), Sb04, Sb06, Sb07, Sb15 (Richards et al. 2004), and FDSB1027 (McGrath et al. 2007). Polymerase chain reaction (PCR) conditions and allele-sizing procedures can be found in Fénart et al. (2007). Electrophoresis and genotyping were performed on an ABI automated sequencer model 3110 (Applied Biosystems Inc.) as described in De Cauwer et al. (2010). To minimize the rate of genotyping errors, a second round of PCR and electrophoresis were performed for individuals with dubious multilocus genotypes, that is, with missing data or displaying rare alleles.
Mitochondrial minisatellites
To gain information on cytoplasmic genetic diversity, mitochondrial polymorphism was characterized by genotyping all individuals at four mitochondrial minisatellite loci: TR1, TR2, TR3, and TR4 (Nishizawa et al. 2000). PCR amplifications, cycling conditions, and genotyping were performed according to protocols previously described in Fénart et al. (2008). As the mitochondrial genome is maternally inherited as a single linkage unit, each genotype combination for these four minisatellite loci was analyzed as a single haplotype for the levels of cytoplasmic diversity and population differentiation, as in De Cauwer et al. (2012).
Statistical analyses of cytoplasmic and nuclear genetic variation
Distinguishing between B. vulgaris subsp. maritima and B. macrocarpa
As pointed out by Buttler (1977), only tepal characters are relevant criteria to distinguish between B. v. subsp. maritima and B. macrocarpa. However, sampling was carried out at the beginning of the flowering season, when B. vulgaris subsp. maritima shows large phenotypic plasticity and is morphologically similar to B. macrocarpa. However, as B. macrocarpa is a self-fertilizing species, the detection of multilocus fixed-homozygote genotypes can help to determine a posteriori which individuals belong to B. macrocarpa. Because (1) the two species may possibly hybridize (Kishima et al. 1987; Lange and Debock 1989; Bartsch and Ellstrand 1999) and (2) B. macrocarpa tetraploid forms with fixed heterozygosity can occur (Letschert 1993), we also discriminated individuals on the basis of their probability of belonging to one or the other species due to allele frequency differences in multilocus genotypes. To do so, we used the model-based Bayesian algorithm implemented in STRUCTURE and described in Pritchard et al. (2000). Bayesian clustering assumes that each individual has admixed ancestral origins in gene pools that have correlated allele frequencies because of migration or shared ancestry (Falush et al. 2003). Using the whole data set, we assessed the number of potential clusters (K) from 30 runs along a range of K varying from 1 to 50 with 2.106 Markov chain Monte Carlo replications following a burn-in period of 100,000 iterations without any prior information on the putative population affiliation of individuals. Among the 30 replicates, 15 with the highest likelihood were retained for subsequent analyses. The ad hoc statistic ΔK was then calculated to determine the most accurate number of K clusters (Evanno et al. 2005).
The Bayesian clustering described in Pritchard et al. (2000) assigns individuals by creating groups within which Hardy–Weinberg (HW) disequilibrium and linkage disequilibrium (LD) are minimized. Nonetheless, inbreeding may induce departures from HW expectations and LD among loci, which can lead to bias or erroneous inferences. To circumvent this, we ran two parallel extensive runs by keeping or removing B. macrocarpa individuals to verify the consistency of clustering results.
Additional analyses were conducted using spatially explicit Bayesian clustering, that is, incorporating spatial trends and autocorrelation in the prior distribution on individual admixture coefficients, as described in Chen et al. (2007) and Durand et al. (2009). Using TESS version 2.3 (Grenoble INP -TIMC-IMAG, Faculty of Medicine, La Tronche, France), we ran 1.106 (100,000 burn-in) MCMC iterations from K = 1 to K = 20 (25 replicates per K value) using the BYM admixture model described in Durand et al. (2009) and the geographic distances between individuals. Of the 25 replicates per K tested, 20 with the lowest deviance information criterion (DIC) were retained. We set the Dirichlet parameter of the allele frequency model, the trend degree to 1.0, and the admixture and spatial interaction parameters to default values. To reveal which K may provide the best fit to the genetic data, average DIC values were plotted against K.
Similarity coefficients between runs and the average matrices of individual membership proportions were estimated using CLUMPP version 1.1.2 (Jakobsson and Rosenberg 2007). Clusters were displayed using DISTRUCT version 1.1 (Rosenberg 2004).
Basic parameters of genetic diversity
Genetic variation was examined per locus and per population with descriptive statistics: the total and mean number of alleles (At and An, respectively), allelic richness (Ar), and level of gene diversity (HE), all using FSTAT version 2.9.3.2 (Goudet 1995). Allelic richness was estimated using the rarefaction approach proposed by El Mousadik and Petit (1996) and based on a minimal population size of eight diploid individuals. For additional information on population genetic uniqueness, estimates of private allelic richness (ArP) were computed following a rarefaction procedure (n = 8) using ADZE software (Szpiech et al. 2008).
Genotypic linkage disequilibrium among all locus-pair combinations was assessed prior to other analyses using a Markov chain approximation of the Fisher's exact test, based on the contingency tables for all pairs of loci in each population, as implemented in GENEPOP version 4.0.1.1 (Raymond and Rousset 1995). Departures from HW equilibrium for each microsatellite locus and overall loci were quantified using the intrapopulation fixation index (FIS). Statistical significance of FIS values was subsequently assessed using the randomization procedure provided by FSTAT. Sequential Bonferroni corrections for multiple comparisons were applied following Rice (1989).
Levels of genetic variation (Ar, ArP, and HE) were compared between the genetically distinct groups depicted through Bayesian clustering and multivariate analyses described later. Statistical significance of differences was tested using a one-way analysis of variance followed by Tukey's multiple-comparisons test. To assess whether a northward-declining diversity gradient occurred in B. vulgaris subsp. maritima, linear regressions were applied on multilocus genetic diversity estimates and spatial attributes of populations: latitude and geographic distance measured along the coastline from the most southern sampling site. Linear regressions were performed on separate population data sets to take into account the presence of genetic discontinuities. A potential bias could arise because levels of allelic diversity often varied among the loci. Therefore, we also performed linear mixed models in analyzing genetic diversity as a function of geographic locations, with loci as random intercepts.
Extent of genetic differentiation
We investigated population structure using classical F-statistics according to Weir and Cockerham (1984) to test for population differentiation across all populations, using FSTAT. Similarly to FIS values, we used a permutation test to determine whether observed values of FST were significantly different from 0 for each locus and overall loci (10,000 randomizations of multilocus genotypes among populations). Furthermore, we compared the mean pairwise genetic differentiation between genetic clusters following the statistical procedure accounting for nonindependent data described in Coulon et al. (2006). The population grouping corresponded to the genetic clusters depicted through Bayesian clustering and multivariate analyses described later. The apportionment of genetic variation was also assessed following the hierarchical procedure proposed by Yang (1998). Hierarchical F-statistics were carried out within and among genetically distinct groups depicted by clustering and multivariate analyses described later. Using the R package HIERFSTAT (Goudet 2005), the significance of genetic differentiation among populations was assessed by randomly permuting individuals (10,000 permutations) among populations within groups. Genetic differentiation among genetic groups was tested by carrying out 10,000 permutations of populations among genetic groups.
Spatial multivariate analysis
We also analyzed our data set using a spatially explicit multivariate method: the spatial principal component analysis (sPCA) described in Jombart et al. (2008). The advantage of sPCA is that it imposes no genetic assumptions on mating system, population structure, or allele frequency models (Jombart et al. 2009). Basically, the method aims to find independent synthetic variables that maximize the product of the spatial autocorrelation calculated on a set of allelic frequencies using Moran's index and the genetic variance among individuals or populations. Spatial information used for the computation of Moran's I is stored in a spatial weighting binary matrix determined through a neighborhood graph. The Gabriel graph was selected to perform the sPCA because it showed the best fit with our genetic data (see Table S1). To evaluate the consistency of spatial patterns observed, the significance of global and local spatial structures was assessed using permutation tests as described in Jombart et al. (2008). Main results provide a geographic map of entity scores allowing a visual assessment of spatial genetic structure. To draw a comprehensive synthetic representation, each of the first three principal component scores was simultaneously represented into a channel of colors as in Menozzi et al. (1978). All the analyses were performed using the ADEGENET package implemented in R (Jombart 2008; R Development Core Team 2011).
Analysis of isolation-by-distance patterns
We studied the relationships between genetic divergence and spatial isolation of populations using unidirectional Mantel correlograms (Oden and Sokal 1986; Arnaud et al. 2009). Genetic divergence was quantitated using the DCE chord distance (Cavalli-Sforza and Edwards 1967). These analyses were used to compare the strength of spatial structuring as depicted by nuclear and cytoplasmic data. Mantel correlograms were designed using the normalized Mantel statistics (rz, Smouse et al. 1986) following the procedure described in Oden and Sokal (1986). For each distance class, designed with a minimum of 15 pairwise comparisons, the significance of rz values was tested with a Mantel test (10,000 permutations). All analyses were performed using PASSAGE version 1.1.2.3 (Rosenberg and Anderson 2011).
Results
Distinguishing between B. vulgaris subsp. maritima and B. macrocarpa
The ΔK statistic showed a strong mode at K = 3: Bayesian clustering analysis separated the whole data set into three genetically distinct groups (Figs. 2B,C, S1). The depicted clusters corresponded to (1) European sea beet populations also including some Moroccan populations located near Gibraltar; (2) the remaining Moroccan sea beet populations; and (3) all B. macrocarpa populations. We are very confident that the three depicted genetic clusters match B. vulgaris subsp. maritima and B. macrocarpa delimitations. Indeed, along with particular multilocus genotypes found in the third cluster for which we hypothesize to be exclusively composed of B. macrocarpa individuals, the hierarchical nuclear genetic differentiation between the two species based on this clustering pattern was the strongest and highly significant (FCT = 0.288, P < 0.001). Among the two groups of sea beets, a significant hierarchical differentiation supported this clustering: Genetic differentiation among populations within these two clusters accounted for most of the genetic variability (FPR = 0.131; P < 0.001), and the differentiation between the two clusters, although weaker, was highly significant (FRT = 0.039; P < 0.001). The K versus ΔK distribution was multimodal with another mode at K = 6 suggesting further hierarchical structure within the sampled area (Figs. S1, S2). The similarity coefficients across independent runs were all larger than 0.998, which suggests the absence of genuine multimodality across runs. Inbreeding did not induce any bias because an identical clustering pattern was found when only analyzing B. vulgaris subsp. maritima populations (Fig. S2). Assisting the Bayesian clustering using spatial distribution of individuals yielded identical results but with lower statistical support: five B. vulgaris subsp. maritima genetic clusters were also inferred in TESS analyses, but similarity coefficients among runs were considerably low, indicating genuine multimodality (H′ = 0.599, from 0.457 to 0.737; see Fig. S3).
Overall, based on genotypic structure and on the extensive runs of Bayesian clustering analyses, eight Moroccan sites and two localities on Santo Porto island were composed of B. macrocarpa individuals and of an admixture of B. macrocarpa and B. vulgaris subsp. maritima individuals (sites labelled 41, 65, 66, b, h, j, 69, and 70, see Fig. 2 and Appendix). Although in sympatry, no admixture indicative of hybridization was observed between the two species.
Genotypic linkage, Hardy–Weinberg disequilibrium, and levels of nuclear and cytoplasmic polymorphism
Within each B. vulgaris subsp. maritima population, exact tests for LD between microsatellite loci showed only 31 significant P-values of 2380 comparisons (1.30%) after Bonferroni correction (119 expected from type I error at α = 0.05). LD was only found in 13 of the 85 B. vulgaris subsp. maritima populations and involved different pairs of loci. This suggests spurious LD due to genetic drift and/or population substructuring effects (De Cauwer et al. 2012).
Using multilocus probability tests, we detected significant departures from HW equilibrium in 32 of the 85 populations of B. vulgaris subsp. maritima. However, only a few of these populations displayed consistent FIS values across loci, suggesting departures from panmixia (Appendix). Over all B. vulgaris subsp. maritima populations, five of eight loci showed significant deviation from HW genotypic proportions, although these FIS estimates were very low, ranging from 0.007 to 0.087 (Table 1). Combined probability tests over all loci and across all populations resulted in an overall departure from HW due to only few significant single-locus departures within populations or significant multilocus departures in only a few populations. In contrast, all but two populations of the third cluster defined as corresponding to B. macrocarpa exhibited very high, significantly positive, single- and multilocus FIS values (Table 1 and Appendix). The only exceptions were the B. macrocarpa populations located on Santo Porto Island in Madeira archipelago, one of which (population labelled 70) had a highly negative mean FIS value due to fixed heterozygosity at multilocus genotypes (Appendix). The other one was composed of individuals characterized by either fixed homozygosity or fixed heterozygosity.
Table 1.
Genetic diversity measures and F-statistics following Weir and Cockerham (1984) estimated over all Beta vulgaris subsp. maritima (n = 85) and B. macrocarpa (n = 8) populations for eight nuclear microsatellite and four cytoplasmic minisatellite loci
| Locus | At | Ar | HE | Allelic size range (bp) | FIT | FST | FIS |
|---|---|---|---|---|---|---|---|
| B. maritima | |||||||
| Nuclear | |||||||
| FDBS1027 | 32 | 6.426 | 0.614 | 170–228 | 0.184* | 0.170* | 0.018 |
| Bvm3 | 56 | 12.043 | 0.831 | 093–157 | 0.195* | 0.134* | 0.070* |
| Caa1 | 52 | 10.059 | 0.809 | 128–230 | 0.205* | 0.130* | 0.087* |
| Gtt1 | 10 | 3.650 | 0.418 | 104–127 | 0.200* | 0.177* | 0.028 |
| Sb04 | 22 | 5.320 | 0.608 | 167–205 | 0.223* | 0.172* | 0.062* |
| Sb06 | 14 | 6.675 | 0.699 | 145–183 | 0.198* | 0.168* | 0.037* |
| Sb07 | 44 | 11.505 | 0.827 | 240–286 | 0.181* | 0.127* | 0.062* |
| Sb15 | 28 | 6.622 | 0.624 | 131–189 | 0.132* | 0.126* | 0.007 |
| Average | 32.250 | 7.788 | 0.679 | – | 0.190* | 0.148* | 0.050* |
| Cytoplasmic | |||||||
| TR1 | 15 | 7.167 | – | 396–780 | – | 0.361* | – |
| TR2 | 3 | 1.109 | – | 359–456 | – | 0.175* | – |
| TR3 | 4 | 2.589 | – | 309–440 | – | 0.389* | – |
| TR4 | 7 | 2.648 | – | 304–485 | – | 0.392* | – |
| Average | 7.250 | 3.37825 | – | – | – | – | – |
| Haplotypes | 45 | 3.573 | – | – | – | 0.350* | – |
| B. macrocarpa | |||||||
| Nuclear | |||||||
| 1027 | 8 | 3.511 | 0.264 | 171–201 | 1.000* | 0.688* | 1.000* |
| Bvm3 | 10 | 3.374 | 0.219 | 096–117 | 0.949* | 0.759* | 0.786* |
| Caa1 | 9 | 3.069 | 0.180 | 128–179 | 0.901* | 0.714* | 0.655* |
| Gtt1 | 5 | 2.794 | 0.199 | 107–121 | 0.601* | 0.051 | 0.580* |
| Sb04 | 6 | 2.826 | 0.192 | 167–183 | 0.858* | 0.676* | 0.561* |
| Sb06 | 5 | 2.279 | 0.167 | 146–168 | 0.886* | 0.841* | 0.279 |
| Sb07 | 13 | 4.063 | 0.360 | 245–269 | 0.910* | 0.300* | 0.870* |
| Sb15 | 6 | 2.469 | 0.174 | 131–169 | 0.886* | 0.842* | 0.279 |
| Average | 7.750 | 3.048 | 0.219 | – | 0.905* | 0.588* | 0.769* |
| Cytoplasmic | |||||||
| TR1 | 3 | 2.207 | – | 494–527 | – | 0.748* | – |
| TR2 | 1 | 1.000 | – | 359 | – | – | – |
| TR3 | 3 | 1.210 | – | 374–440 | – | 0.873* | – |
| TR4 | 1 | 1.000 | – | 364 | – | – | – |
| Average | 2 | 1.354 | – | – | – | – | – |
| Haplotypes | 5 | 2.073 | – | – | – | 0.743* | – |
At, total number of alleles; Ar, allelic richness; HE, gene diversity; FIT, FST, FIS: fixation indices following Weir and Cockerham (1984); –, not applicable (haploid data).
Significance of departure from Hardy–Weinberg equilibrium within (FIS), over all populations (FIT), and genetic differentiation (FST) was tested by 10,000 randomizations (*P < 0.0001). Bonferroni corrections were applied to the mean nuclear FST estimates and cytoplasmic loci. Allelic size ranges in base pairs (bp) are also indicated for each locus.
Nuclear microsatellite loci for B. vulgaris subsp. maritima populations displayed moderate to high numbers of alleles, ranging from 10 (Gtt1) to 56 (Bvm3), with an average of 32.25 alleles and a mean gene diversity (HE) of 0.679 (Table 1). Mitochondrial genetic diversity was much lower, with a number of alleles varying from 3 (TR2) to 15 (TR1). Based on a single haplotype determined by combining the alleles at four loci, we found a total of 45 haplotypes, of which four represented 77.31% of the total number of haplotypes. In sharp contrast, B. macrocarpa displayed much lower levels of genetic diversity, with an average of 7.750 alleles for nuclear variation and a total number of 5 haplotypes for cytoplasmic polymorphism (see Table 1). The geographic distribution of mtDNA haplotypes within populations can be visualized in Fig. S4.
Geographic trends in the levels of genetic diversity
Estimates of genetic diversity (Ar, ArP, and HE) varied greatly among B. vulgaris subsp. maritima populations (Appendix). A striking northward decrease in private nuclear alleles within populations was observed over the sampled area, with the highest private allelic richness being found on both sides of the Strait of Gibraltar and in Moroccan inland ruderal populations (Fig. 3A). Nuclear gene diversity and allelic richness significantly decreased with latitude from the Gibraltar region (HE: r2 = 0.283, P < 10−4; Ar: r2 = 0.323, P < 10−4; Fig. 3B). Similar trends were described using the geographic distance calculated along the coastline (HE: r2 = 0.211, P < 0.003; Ar: r2 = 0.242, P < 0.001). In contrast, no significant trends were observed for Moroccan B. vulgaris subsp. maritima populations at lower latitudes (Fig. 3B). Finally, regarding cytoplasmic polymorphism, no significant relationships with latitude or coastline distance were observed for any parameter of genetic diversity based on multilocus data (data not shown). Very similar trends of decreasing nuclear gene diversity with latitude were depicted using linear mixed models with loci as random intercept (see Table S2 and Fig. S5).
Figure 3.
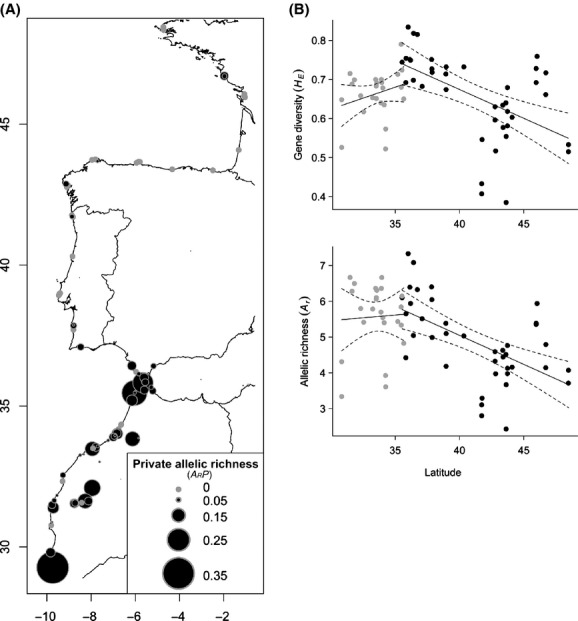
Spatial patterns of genetic diversity. (A) Nuclear private allelic richness (ArP) of B. vulgaris subsp. maritima populations is proportional to the size of the dot mapped onto the population location. (B) Linear regressions of gene diversity (HE) and allelic richness (Ar) based on nuclear polymorphism with respect to latitude. Black dots represent genetic diversity values for northern populations, from Brittany to northern Moroccan populations at the Strait of Gibraltar (populations labelled 1–40 in Fig. 1). Gray dots represent values for Moroccan populations at lower latitudes (populations labelled 43 to t). Dashed lines indicate the 95% confidence intervals.
We then focused on Morocco, a region considered as a hot spot of genetic diversity, to compare coastal (C) and inland ruderal (R) populations. Inland ruderal populations exhibited higher levels of gene diversity (HE, C: 0.675, R: 0.734; P < 10−3), allelic richness (Ar, C: 5.538, R: 6.400; P < 10−3), and mean number of alleles (An, C: 7.569, R: 8.835; P < 10−2) for nuclear data. Inland ruderal populations also showed a higher level of allelic richness for cytoplasmic data (Ar, C: 1.830, R: 2.209; P < 10−3; Ar Haplo, C: 3.349, R: 4.532; P < 10−2). However, no significant differences were observed for private allelic richness (ArP, C: 0.066, R: 0.093; P = 0.255). Regarding genotypic structure, mean multilocus FIS values marginally differed between inland ruderal populations and coastal populations (C: 0.030, R: 0.073; P = 0.057), and no difference was observed for nuclear multilocus FST (C: 0.115, R: 0.074; P = 0.112).
Mean levels of genetic differentiation
A strong genetic differentiation among B. vulgaris subsp. maritima populations was found using mitochondrial minisatellite markers: The mean FST estimate, based on haplotypes, was 0.350 (P < 0.01, Table 1). Highly significant spatial genetic differentiation also occurred for nuclear polymorphism, with consistent single-locus FST estimates ranging from 0.126 to 0.177 (all at P < 0.0001) with a mean multilocus FST of 0.148 (P < 0.01, see Table 1). Among the 3570 comparisons, mean pairwise FST between populations ranged from 0 to 0.461 (94.64% at P < 0.05) and from 0 to 0.973 (44.14% at P < 0.05) for nuclear and cytoplasmic data, respectively (Fig. S6). Altogether, these results clearly indicated genetically structured populations for both kinds of markers over the whole sampled area. Among the eight sampled populations of B. macrocarpa, nuclear and cytoplasmic differentiation among populations was extremely high, with a mean significant FST value of 0.588 and of 0.743 for nuclear and cytoplasmic variation, respectively (Table 1 and Fig. S6).
Population genetic structure of B. vulgaris subsp. maritima inferred from spatial multivariate ordination method
The sPCA performed on the cytoplasmic data revealed no significant structure, either global (P = 0.681) or local (P = 0.184). When performing sPCA on nuclear data, a significant global structure was observed (P < 0.001), indicating that neighboring entities are genetically more similar than would be expected at random. The three first axes in the sPCA unambiguously captured all global spatial patterns (see Fig. S7). The resulting synthetic map defined four clearly different geographic entities: (1) the Bay of Biscay; (2) the Portuguese Atlantic coast, with a genetic cline between northern and southern populations; (3) the Strait of Gibraltar region on the Spanish and Moroccan sides; and (4) Moroccan southern Atlantic coast (Fig. 4A). Moreover, Moroccan inland ruderal populations clustered strongly with the group of populations located on the Moroccan side of the Strait of Gibraltar and southern Spain. Interestingly, populations located across the Strait of Gibraltar showed high autocorrelation values, suggesting no major genetic discontinuities in this area (Figs. 4A, S7). This analysis further traced back the evolutionary history of populations sampled on Madeira Island, which appear to originate from southern Portugal and Spain or northern Morocco near Gibraltar. Strongly concordant results were obtained with Bayesian clustering for the second modal value at K = 6 (see Fig. S2). Levels of genetic diversity for these genetically distinct groups of populations are depicted by both sPCA and Bayesian clustering in Figure 4B. Significant differences were found among groups for all variables (all at P < 10−2). Overall, the general trend was that populations located in Morocco and along the Strait of Gibraltar displayed the highest levels of cytoplasmic and nuclear genetic diversity. Figure 5 illustrates how pairwise genetic differentiation among populations differed between genetic clusters and shows a general increase in nuclear differentiation northward along the Atlantic coastline. Interestingly, cytoplasmic and nuclear data showed similar patterns with higher pairwise FST values observed along the Portuguese coastline (Fig. 5).
Figure 4.
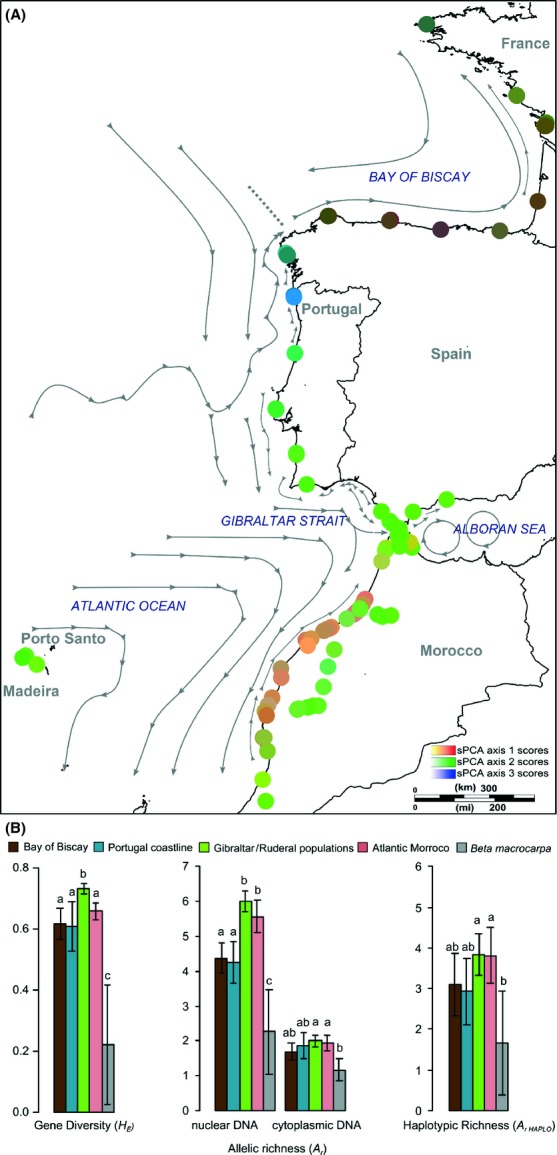
Genetic distinctiveness and mean levels of genetic diversity estimates for B. vulgaris subsp. maritima populations. (A) Genetic structure of B. vulgaris subsp. maritima populations revealed by a multivariate ordination method (sPCA) as described in Jombart et al. (2008). Color plot synthesizes the three first sPCA principal components at their respective spatial population coordinates. Each of the three axes was plotted on a red, green, and blue color scale, and the intensity of the color is proportional to the spatial principal component scores. Arrows indicate major surface currents redrawn from Koutsikopoulos and LeCann (1996), Millot (1999), Pelegrí et al. (2005), and Peliz et al. (2005). (B) Bar graph of the mean genetic diversity estimates (HE, Ar, and Ar Haplo) for each genetically distinct group of populations revealed by sPCA and for B. macrocarpa populations. Bars with different letters are significantly different at P < 0.05.
Figure 5.
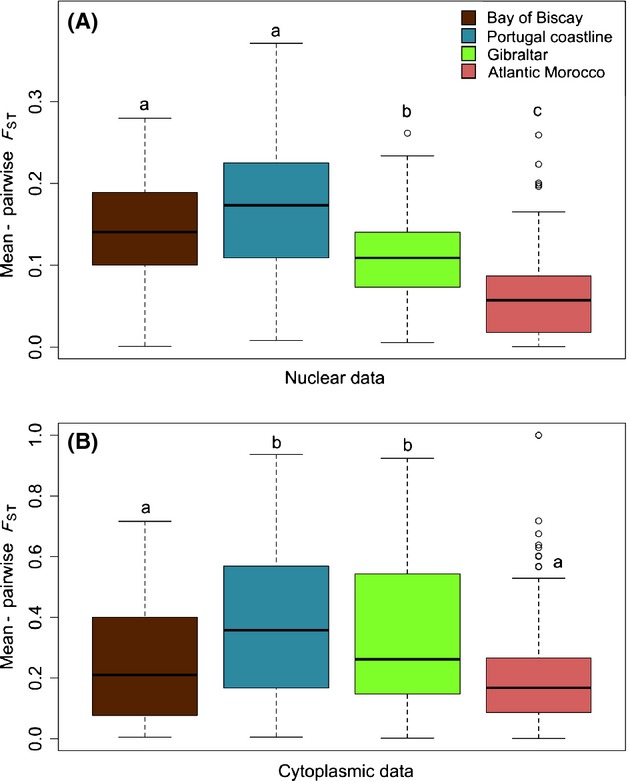
Box-plots of nuclear (A) and cytoplasmic (B) pairwise differentiation of populations (FST) within genetic clusters depicted by sPCA. Box-plots indicate the median (horizontal line), the 25th and 75th percentiles (bottom and the top of the box), and the minimum/maximum values (vertical dashed lines). Plots with different letters are significantly different at P < 0.05.
Lastly, including B. macrocarpa individuals in the sPCA clearly supported the high genetic distinctiveness between the two species observed with Bayesian analyses (see Fig. S8).
Isolation-by-distance patterns
To design Mantel correlograms based on (1) previous results on population memberships and (2) a sufficient number of pairwise comparisons within distance classes to ensure robust statistical support, we only focused on three groups of B. vulgaris subsp. maritima populations that can be visualized in Figure 6. Using nuclear data, Mantel correlograms for northern populations up (north of the Strait of Gibraltar) revealed a clear continuous decrease in genetic similarity with increasing geographic distance (Fig. 6A). Focusing on Moroccan Atlantic populations, we observed moderately positive rz values stabilizing up to 280 km. From this distance, rz values substantially decreased (Fig. 6C). Regarding inland ruderal populations for nuclear data, only a positive short-distance autocorrelation and a long-distance genetic differentiation were observed (Fig. 6E). Finally, for cytoplasmic data, no significant spatial trends were observed: The correlograms showed fluctuations indicative of random genetic drift effects (Fig. 6B, D and F).
Figure 6.

Mantel correlograms based on nuclear microsatellite (A, C, E) and mitochondrial minisatellite (B, D, F) data. Three groupings were investigated: northern populations (north of the Strait of Gibraltar) (A, B), Moroccan Atlantic populations (C, D), and inland ruderal populations (E, F). Black circles indicate a significant rz value at P < 0.05.
Discussion
Nuclear and cytoplasmic polymorphisms in B. vulgaris subsp. maritima and B. macrocarpa
One aim of this study was to elucidate spatial patterns of population genetic structure and draw indirect inferences on mating system based on genotypic structure, in two related species, B. vulgaris subsp. maritima and B. macrocarpa. One may wonder whether the modal K depicting three genetically distinct clusters clearly discriminated the two species. Nonetheless, we are very confident of the species assignation for the following reasons: (1) Concordant patterns of genetic distinctiveness were obtained using both sPCA and Bayesian clustering, (2) the hierarchical genetic differentiation was the highest between the two clusters of sea beets and the putative cluster composed of Beta macrocarpa individuals, and (3) contrasting patterns of genetic differentiation among populations and genotypic structure within populations were found between the two clusters of sea beets and the cluster composed of Beta macrocarpa individuals, the observed patterns being concordant with what is known about the mating system in these two species (Letschert 1993; Bruun et al. 1995) and more generally in plant species displaying different reproductive traits (Hamrick and Godt 1996). Therefore, the third cluster we depicted is clearly unlikely to correspond to an additional cluster of sea beets that would be characterized by complete autogamy. Overall, significant cytoplasmic and nuclear genetic differentiation was found among 85 B. vulgaris subsp. maritima and 8 B. macrocarpa populations. Mitochondrial DNA diversity revealed considerably more population structuring than that found for nuclear DNA, as shown by the strong asymmetry in FST values. This finding can be explained by (1) the larger effective population size for nuclear genes as compared to organellar genes, indicating a stronger effect of genetic drift on cytoplasmic DNA, and (2) higher gene flow for nuclear DNA, which occurs via seed and pollen dispersal, than for cytoplasmic DNA, which takes place via seed movements only (Ennos 1994). In B. vulgaris subsp. maritima, the amount of genetic differentiation was fairly high compared with those found in previous studies involving a metapopulation structure at microgeographic scale less than a few hundred meters (De Cauwer et al. 2010) or involving a regional structure (Fievet et al. 2007). This is in accordance with the fact that genetic differentiation generally increases with geographic distance (reviewed in Petit et al. 2005). However, the contrast between nuclear and cytoplasmic differentiation observed over a wide species-range scale appeared reduced compared with those found in studies performed at finer geographic scales. The large differences between seed and pollen dispersal may indeed be more difficult to detect due to the greater action of genetic drift and mutation, with differentiation being random at large geographic scales (Hutchison and Templeton 1999; Fievet et al. 2007). Furthermore, founder events involving rare propagules can undergo strong genetic drift, as suggested by the lack of large-scale structuring for cytoplasmic diversity (Whitlock and McCauley 1990). This type of metapopulation dynamics is plausible given that sea beets occur in coastal environments where frequent disturbance may lead to extinctions and recolonizations (De Cauwer et al. 2012). This explanation is consistent with hierarchical F-statistics analyses, revealing that most differentiation occurs among populations within geographic groups.
Beta macrocarpa populations exhibited very low genetic variation, large heterozygote deficiency, and a high degree of genetic differentiation compared with B. vulgaris subsp. maritima populations. Herbaceous annuals with seed dispersal by gravity and mixed-mating or pure selfing mating systems usually exhibit higher FIS values and stronger genetic differentiation than outcrossing species (Hamrick and Godt 1996; Duminil et al. 2009). Accordingly, this suggested that selfing could be the main reproductive mode of B. macrocarpa. This is therefore consistent with a self-compatible mating system documented by Buttler (1977), Lange and Debock (1989), Letschert (1993), and Bruun et al. (1995). Interestingly, two populations located in Santo Porto showed mean single-locus FIS values and multilocus genotypes indicative of individual fixed heterozygosity, as also documented by Letschert (1993) on tetraploid (2n = 36) accessions from Canary Islands. Along with the recent discovery of diploid and tetraploid forms occurring in sympatry in south Portugal (Castro et al. 2013), our findings also suggest the mixing of diploid and tetraploid variants in B. macrocarpa located in Madeira Islands. Inbreeding depression is weaker in tetraploids, which may be a determining factor in the evolution of polyploidy (Husband and Schemske 1997). Indeed, polyploidy appears to be especially prevalent in self-fertilizing annual colonizing plants, and it is often argued that heterozygosity is a key element in their colonizing ability (reviewed in Soltis and Soltis 2000). In B. macrocarpa, tetraploidy may thus be adaptively significant because this species often occurs in disturbed environments. Nonetheless, further experiments involving chromosome counting and flow cytometry are necessary to accurately document the occurrence of diploid and tetraploid variants in sympatry.
B. vulgaris subsp. maritima: do inland populations have peculiar evolutionary histories?
To date, there are only few examples of typical coastal species that also occur inland – albeit sparsely – especially halophytic species. Comes and Abbott (1998) observed lower genetic diversity in inland populations of Senecio gallicus and suggested that they originated from coastal populations. However, lower genetic diversity for inland populations is not a common feature (e.g., Krüger et al. 2002; Prinz et al. 2009). In our study, Moroccan inland ruderal populations exhibited higher levels of genetic diversity than coastal populations. In addition, no clear isolation-by-distance (IBD) pattern was detected, contrary to spatial genetic structure commonly observed in coastal populations (Fievet et al. 2007). Only positive autocorrelation of short-distance classes was observed, likely reflecting genetic clustering and family structuring caused by limited short-range dispersal of the multigerm seedball (De Cauwer et al. 2012). The lack of IBD patterns at larger spatial scales can be attributed – at least partially – by recent spreads along with human-caused habitat disturbances, which blurs the spatial patterns of genetic relatedness by modifying the movement of dispersal vectors and significantly changing the number and distribution of recruitment sites (González-Martínez et al. 2010). Pollen flow may also be very localized and constrained by inland topography, as opposed to the propitious pollen dispersal in open habitats such as shorelines (Arnaud et al. 2009; De Cauwer et al. 2010).
Finally, Moroccan inland ruderal populations clustered with coastal populations in the Gibraltar region, a result consistent with both sPCA and Bayesian analyses (Figs. 3, S2). Again, these results could highlight a recent expansion of B. vulgaris subsp. maritima from the Mediterranean coast, possibly mediated by human-induced long-dispersal events as suggested by Desplanque et al. (1999) and Arnaud et al. (2009) for southern European inland wild beet populations. Ruderal habitats are common elements in the Mediterranean landscape due to land-use changes (Naveh and Vernet 1991). Therefore, opportunistic growth and rapid reproduction in unstable habitats appear to have played an important role in the inland expansion of weedy beet relatives (Arnaud et al. 2011). Inland ruderal Moroccan populations further appeared to have admixed origin from coastal European and Moroccan lineages. The admixture of different lineages and subsequent multiple introductions in a new habitat can provide large amounts of genetic diversity, novel sources of genetic combinations in plant species complexes, and may thus offer opportunities to intensify the adaptability of populations to a new niche on microevolutionary timescales (Ellstrand and Schierenbeck 2000; Barrett et al. 2008). A striking example of recurring pattern of adaptive evolution in B. vulgaris is the evolution of invasive weed beets from crop–wild hybrids that entails numerous changes in life history, morphology, and ecology. It has indeed been shown that the invasiveness of weedy lineages arises through the introgression of a wild genetic background into the crop gene pool (Arnaud et al. 2010). This wild genetic background comes from inland ruderal beets found in disturbed habitats in southern France, which have very similar ecology as inland Moroccan beets (Desplanque et al. 1999; Arnaud et al. 2009). Indeed, in southern France, these noncoastal wild beet populations have colonized disturbed, human-influenced habitats, thanks to specific life-history traits that enhance colonizing abilities: the timing of flowering, the seed dormancy associated with a long-lived seed bank, and the breakdown of self-incompatibility (Desplanque et al. 1999; Hautekèete et al. 2002; Arnaud et al. 2011). These traits may also be crucial in inland Moroccan populations sharing very similar ecological conditions, that is, unpredictable and man-made environments at low latitude. Overall, in such disturbed-like environments, the combination of reproductive traits and life-history traits due to admixture of different lineages may facilitate the adaptive evolution of inland beet lineages and could facilitate their colonization capabilities, as they do for weedy invasive lineages found in cultivated fields (Arnaud et al. 2010). In the future, this could be of particular concern in the major areas of cultivation of sugar beets in central west Morocco.
Lastly, founder effects during colonization are likely to involve ample mixing of seeds due to pastoralism and grazing activities along field edges (Pereira et al. 2009). Multiple sources of introduction and/or different successive independent colonization events from the Mediterranean coast may therefore explain the admixture, the lack of IBD, and the higher levels of genetic diversity found in inland populations. Newly developed ABC methods could be useful to elucidate the origins of inland populations (e.g., Lombaert et al. 2011). However, our data set does not conform to current ABC computations in two aspects. First, we dealt with a very large number of populations not amenable to current ABC analyses without size reduction. Second, the among-population genetic structure observed in each compartment (coastal and ruderal) is high, which can lead to the inference of erroneous scenarios. Potential solutions exist to circumvent these difficulties, by modeling unsampled populations and/or using different sets of sampled populations (E. Lombaert, pers. comm.). Testing the appropriateness of these different solutions is, however, beyond the scope of this paper. As such, we acknowledge that concluding on a particular evolutionary history of inland populations remains speculative as long as these scenarios have not been thoroughly tested.
Phylogeographic patterns in B. vulgaris subsp. maritima
Understanding the underlying mechanisms of range shifts and the determinants of population establishment are fundamental questions in evolutionary biology and ecological genetics and more importantly in the context of changing climate. The patterns we document in B. vulgaris subsp. maritima provide clues for understanding how life-history and major geographic features interact to shape the distribution of genetic diversity.
Does the Strait of Gibraltar impede gene flow?
The Mediterranean-Atlantic transition has been reported to be an efficient barrier to the expansion of many coastal plants and marine species along the coast (Kadereit et al. 2005; Westberg and Kadereit 2009). Nonetheless, this barrier effect remains uncertain in B. vulgaris subsp. maritima because we found a clear genetic similarity among populations located on both sides of the Strait of Gibraltar. This lack of genetic structuring suggested that there is no major biogeographic barrier in this area, which can be explained by: i) colonization before barrier formation and/or ii) effective dispersal after barrier formation. During the last glacial maxima, the relative sea level dropped 120 m relative to its present level and the distance between the two continents was thereby reduced to 10 km (Yokoyama et al. 2000). In addition to the proximity between shores, small islands and islets emerged and may have provided pathways of migration through a stepping-stone-like network between the two continents (Collina-Girard 2001). Alternatively, it may involve long-distance seed dispersal events favored by sea currents and efficient pollen flow. As found in B. vulgaris subsp. maritima, genetic continuities on both sides of the strait have been reported for several herbaceous plant species characterized by ruderal life-history traits (e.g., Caujapé-Castells and Jansen 2003; Ortiz et al. 2007). These findings are in sharp contrast with other studies that examined long-lived plants such as trees, which tend to show genetic breaks associated with the strait (e.g., Lumaret et al. 2002). Overall, it appears that the Strait of Gibraltar filtered plant migration according to their dispersal and life-history traits (Lavergne et al. 2013).
Influence of marine currents
Seed dispersal is a major determinant of the spatial genetic structure of populations (Ennos 1994). In most cases, B. vulgaris subsp. maritima seeds are dispersed by gravity in the vicinity of the mother plant (De Cauwer et al. 2012). However, secondary seed dispersal through water transport has been suggested because buoyant seeds can be carried away during the highest tides and subsequently drifted in marine waters (Fievet et al. 2007). Interestingly, the main phylogeographic breaks depicted by both sPCA and Bayesian clustering analysis matched the main surface current discontinuities (see Fig. 3). The sharp genetic change observed in Galicia, at the western tip of the Iberian Peninsula, coincides with a water-mass front located off Cape Finisterre and has been reported as a major dispersal barrier for several marine organisms such as algae and marine snails with planktonic larvae being released in seawater (Perez et al. 1993; Alberto et al. 1999; Piñeira et al. 2008). Furthermore, an additional biogeographic barrier has been identified in Portugal at 41°N where the eastern North Atlantic surface currents bifurcate (e.g., Diekmann et al. 2005; Coyer et al. 2011). The resulting south-flowing Portuguese current and the northeast-flowing Portuguese counter-current may thus account for the genetic cline and increased levels of pairwise genetic differentiation observed in B. vulgaris subsp. maritima populations along the Portuguese Atlantic coast (see Martins et al. 2002). Finally, the substantial genetic distinctiveness between southern Moroccan Atlantic populations and populations found in the Strait of Gibraltar region on the Spanish and Moroccan sides corresponds to a physical discontinuity of marine currents, as shown in Figure 3. Thus, large-scale oceanographic features along the coastline may affect seed dispersal and population connectivity in wild sea beet, leading to genetically differentiated lineages similar to what can be observed in marine organisms (e.g., Alberto et al. 1999; Coyer et al. 2011). Lastly, drifting through seawater can facilitate seed dispersal, which is very limited along the terrestrial shoreline. Indeed, sea beet seeds have no particular dispersal mechanism except a gravity-driven pattern of dispersal. As a consequence, most seeds are dispersed at short distances near the mother plants in terrestrial areas (Arnaud et al. 2011; De Cauwer et al. 2012). A high genetic differentiation among a mosaic of genetically distinct demes is thus found within populations, with striking genetic discontinuities taking place within a few tens of meters (De Cauwer et al. 2012). Moreover, although being a wind-pollinated species, pollen flow is spatially localized and constrained by landscape topography (Fievet et al. 2007; De Cauwer et al. 2010, 2012). This explains the strong IBD pattern found for coastal populations at nuclear microsatellite loci.
Geographic trends in the levels of genetic diversity and structure: footprints of postglacial recolonization?
It seems unlikely that B. vulgaris subsp. maritima survived the Würm glaciation: Due to ice and permafrost, it would not have been able to maintain a continuous distribution along large parts of the Atlantic coast of Europe. Today, the northern range limit of B. vulgaris subsp. maritima is situated at approximately 58°N near the 8°C January and 14°C July isotherms. Therefore, populations probably had to retreat to at least northern Portugal, where the 14°C July isotherm would have been located during the last glacial maximum (see Fig. S9). In accordance, Eryngium maritimum, a coastal species that shares the same habitats, temperature requirements, and distribution range as B. vulgaris subsp. maritima, was estimated to have retreated to as far south as North Africa (Clausing et al. 2000). Because rare alleles are expected to be lost with bottlenecks occurring during subsequent recolonization and range expansion, patterns of central-marginal and latitudinal gradients in genetic diversity can point to refuge sources (Austerlitz et al. 1997). Consistently, a clear and significant decrease in allelic richness and gene diversity with increasing latitude was observed from the Gibraltar region, which exhibited a high level of genetic diversity and many private alleles at nuclear loci. This pattern of “southern richness” is characteristic of temperate terrestrial taxa that persisted through past glacial conditions in southern refugia (Hampe and Petit 2005). This is also indicative of a central-marginal trend in decreasing diversity (see Guo 2012) and may corroborate the Gibraltar region as a historical refuge for B. vulgaris subsp. maritima. Indeed, the Gibraltar region is considered as a buffer zone that was climatically stable during geological times due to its latitude and the influence of the Atlantic Ocean and the Mediterranean Sea (Rodríguez-Sánchez et al. 2008). However, we cannot rule out secondary contacts between two divergent lineages originating from the eastern Mediterranean and southern Moroccan coast. The high levels of admixture found in northern Moroccan coastal populations are consistent with the occurrence of genetically diverse suture zones similar to glacial refugia (Sakaguchi et al. 2011). The high genetic diversity observed in this area may also suggest past abrupt increase in migration among populations. Indeed, such transient dynamics has been shown to leave genetic diversity peaks that can be conserved over thousands of generations, as theoretically demonstrated by Alcala et al. (2013).
Subsequently, the significant decrease in nuclear gene diversity and allelic richness northward from the Strait of Gibraltar region can be attributed to a series of founder effects during range expansion along the shoreline. In this type of narrow expanding population front, drift effects may be accentuated by growth of genetically uniform populations ahead of the main colonization front that would inhibit subsequent gene flow (Waters et al. 2013). The strong IBD pattern observed for nuclear diversity also points to a scenario analogous to the propagule-pool model developed for landscapes with extinctions-recolonization dynamics, that is, founders are drawn from a limited number of source populations consequently reducing population genetic diversity and increasing the genetic differentiation among populations (Wade and McCauley 1988; Whitlock and McCauley 1990; Giles and Goudet 1997; Haag et al. 2005). Indeed, in Europe, sea beets are generally patchily located along the sea shore, where high tides, seasonal storms, and anthropogenic disturbances cause frequent extinctions of populations.
In contrast, we did not find any IBD patterns for cytoplasmic variation, nor any evidence for decreasing levels of cytoplasmic diversity or increase in differentiation among newly established northern Atlantic populations following the postglacial recolonization. A migrant-pool model – where colonization occurs from multiple source populations (Slatkin 1977) – would be more likely to fit the spatial patterns of cytoplasmic variation. At first glance, these results appear puzzling as several sea beet seeds are aggregated in a single fruit, which provides the opportunity for kin-structured founder effects (Whitlock and McCauley 1990; De Cauwer et al. 2012). Similar contrasting results between nuclear and cytoplasmic diversity have been observed in plants (e.g., García-Verdugo et al. 2010) and could be interpreted by the occurrence of multiple stochastic long-distance seed migration mediated by major marine currents, as suggested in our study by the depicted phylogeographic breaks that matched some major marine current discontinuities. Seed dispersal by marine currents may indeed possibly compensate the founder effects by gene mixing despite a narrow coastline habitat (Fayard et al. 2009).
Conclusion
Nearly complete autogamy was verified in B. macrocarpa. Gradients in allelic richness and gene diversity in B. v. subsp. maritima suggested a scenario of postglacial recolonization from the Mediterranean-Atlantic region and supported the status of southern Iberia and Morocco as a long-term refuge as documented for a wide range of organisms. Further, specific life-history traits along with the admixture from genetically differentiated lineages are likely to increase invasiveness for ruderal lineages in anthropogenically disturbed habitats. Our results also indicate that environmental factors, such as marine currents, may play a role in shaping genetic diversity in coastal plant species concordantly of what can be observed in marine organisms releasing larvae in water flows. Range expansions do not always have straightforward consequences: in our case study, long-distance seed dispersal through marine currents may drive to a mixing of cytoplasmic diversity and buffer the northward decrease in nuclear allelic richness observed for edge populations recently established. This challenges the usual view that populations located at the edge of a species' geographic distribution are genetically depauperate.
Acknowledgments
We wish to express our gratitude to C. Godé for technical assistance in molecular analyses; S. Gallina for computing assistance with Bayesian clustering; C. Roux for graphical help in R; and S. Villain, F. Roux, N. Saidi, and J. Cuguen for help in sampling. Numerical results presented in this paper were carried out using the European Grid Infrastructure (http://www.egi.eu) with the Biomed virtual organization (http://lsgc.org/en/Biomed:home) via DIRAC portal (http://diracgrid.org) supported by France Grille (http://www.france-grilles.fr/). We thank the technical staff of the European Grid Infrastructure and the supporting National Grid Initiatives for providing technical support and infrastructure. We are also grateful to C.R. Engel, the associate editor, and three anonymous referees for very helpful comments on the manuscript. This work was funded by a grant from the “PRAD-PHC Maroc (09-01),” the “FRB/Région Nord-Pas de Calais” (GENEFRAG project), and a grant from “INRA SPE.”
Appendix
Population localities, label, geographic coordinates, sample sizes, and summary of genetic diversity for nuclear polymorphism at eight microsatellite loci and for cytoplasmic polymorphism at four minisatellite loci among 93 wild Beta vulgaris subsp. maritima (Mari) and Beta macrocarpa (Macro) populations. B. macrocarpa populations are shaded in gray. HE, gene diversity within populations; Ar, allelic richness; ArP, private allelic richness; An, mean number of alleles; FIS, the intrapopulation fixation index (*P < 0.0001); Nb Haplo, number of haplotypes; Ar Haplo, haplotypic richness. Ar is the allelic richness corrected to n = 8 using the rarefaction method of El Mousadik and Petit (1996) implemented in FSTAT version 2.9.3.2.
| Nuclear | Cytoplasmic | |||||||||||||
|---|---|---|---|---|---|---|---|---|---|---|---|---|---|---|
| Region | Label | Sampling locality | Latitude | Longitude | n | Species | HE | Ar | ArP | An | FIS | Nb Haplo | Ar Haplo | Ar |
| France | 1 | Bretagne Aber Ildut | 48.46672 | −4.75677 | 15 | Mari | 0.537 | 4.072 | 0.001 | 5.000 | 0.158 | 2 | 2.000 | 1.500 |
| 2 | Bretagne Pors Gored | 48.46492 | −4.76597 | 20 | Mari | 0.516 | 3.711 | 0.000 | 4.500 | 0.079 | 3 | 2.870 | 1.913 | |
| 3 | St Gilles-Croix-de-Vie | 46.70918 | −1.98033 | 11 | Mari | 0.715 | 4.790 | 0.091 | 5.125 | −0.048 | 5 | 4.803 | 2.244 | |
| 4 | St Gilles-Croix-de-Vie | 46.69930 | −1.97313 | 11 | Mari | 0.660 | 4.142 | 0.053 | 4.375 | −0.034 | 1 | 1.000 | 1.000 | |
| 5 | Yves | 46.03008 | −1.05638 | 20 | Mari | 0.761 | 5.938 | 0.009 | 8.000 | 0.085 | 6 | 4.813 | 2.008 | |
| 6 | Fouras | 45.95538 | −1.06833 | 20 | Mari | 0.692 | 5.350 | 0.003 | 7.875 | −0.011 | 9 | 6.882 | 2.805 | |
| 7 | Île Madame | 45.95347 | −1.11120 | 20 | Mari | 0.729 | 5.384 | 0.010 | 7.250 | 0.045 | 5 | 3.929 | 1.954 | |
| 8 | Aquitaine Contis plage | 44.08869 | −1.32183 | 14 | Mari | 0.604 | 4.158 | 0.004 | 4.750 | 0.069 | 3 | 2.976 | 1.498 | |
| Iberian peninsula | 9 | Lekeitio | 43.36063 | −2.49835 | 24 | Mari | 0.637 | 4.629 | 0.006 | 6.375 | 0.149 | 4 | 3.375 | 1.619 |
| 10 | Oyembre | 43.38925 | −4.32932 | 39 | Mari | 0.578 | 4.444 | 0.001 | 8.250 | 0.148 | 4 | 2.892 | 1.609 | |
| 11 | Verdicio | 43.62828 | −5.87637 | 26 | Mari | 0.556 | 3.668 | 0.001 | 5.250 | 0.082 | 2 | 1.994 | 1.249 | |
| 12 | Verdicio | 43.62478 | −5.87912 | 15 | Mari | 0.386 | 2.430 | 0.003 | 2.750 | 0.118 | 2 | 1.963 | 1.246 | |
| 13 | Xago | 43.60868 | −5.91265 | 15 | Mari | 0.643 | 4.512 | 0.002 | 5.500 | 0.129 | 2 | 2.000 | 1.250 | |
| 14 | Celtigos | 43.72675 | −7.79440 | 16 | Mari | 0.619 | 4.126 | 0.001 | 4.750 | 0.056 | 3 | 2.516 | 1.613 | |
| 15 | Celtigos | 43.72542 | −7.79452 | 15 | Mari | 0.583 | 3.979 | 0.033 | 4.750 | 0.139 | 3 | 2.790 | 1.674 | |
| 16 | Espasante | 43.72255 | −7.81105 | 20 | Mari | 0.678 | 4.763 | 0.006 | 6.625 | −0.033 | 3 | 2.646 | 1.926 | |
| 17 | Texueiro | 42.80988 | −9.11333 | 18 | Mari | 0.517 | 3.974 | 0.067 | 5.000 | 0.015 | 2 | 1.698 | 1.189 | |
| 18 | San Francisco | 42.75742 | −9.07678 | 14 | Mari | 0.598 | 4.327 | 0.008 | 6.125 | 0.111* | 3 | 2.853 | 2.198 | |
| 19 | San Francisco | 42.76038 | −9.06135 | 21 | Mari | 0.628 | 4.591 | 0.000 | 5.500 | −0.081 | 4 | 3.861 | 2.250 | |
| 20 | Paço | 41.75697 | −8.87668 | 18 | Mari | 0.543 | 3.290 | 0.003 | 3.750 | −0.137* | 2 | 1.996 | 1.250 | |
| 21 | Areosa | 41.72123 | −8.87067 | 17 | Mari | 0.432 | 3.104 | 0.003 | 3.750 | −0.072 | 3 | 2.758 | 2.347 | |
| 22 | Areosa | 41.72217 | −8.86568 | 17 | Mari | 0.407 | 2.800 | 0.050 | 3.500 | −0.04 | 2 | 2.000 | 1.500 | |
| 23 | Praia da Tocha | 40.33647 | −8.83982 | 13 | Mari | 0.734 | 5.030 | 0.000 | 6.000 | 0.069 | 4 | 3.723 | 2.186 | |
| 24 | Ericeira | 38.96197 | −9.41917 | 10 | Mari | 0.675 | 4.184 | 0.000 | 4.750 | 0.053 | 5 | 4.833 | 2.676 | |
| 25 | Ericeira | 38.96460 | −9.43267 | 15 | Mari | 0.735 | 5.097 | 0.000 | 5.375 | 0.064 | 3 | 2.968 | 1.499 | |
| 26 | Lizandro | 38.94468 | −9.41478 | 15 | Mari | 0.713 | 5.382 | 0.000 | 7.000 | −0.028 | 5 | 4.509 | 2.415 | |
| 27 | Samoqueira | 37.86950 | −8.79295 | 15 | Mari | 0.715 | 4.988 | 0.025 | 6.125 | −0.095* | 1 | 1.000 | 1.212 | |
| 28 | Porto Covo | 37.84960 | −8.79315 | 15 | Mari | 0.728 | 6.045 | 0.067 | 7.875 | 0.01 | 6 | 5.450 | 2.815 | |
| 29 | Pessegueiro | 37.82962 | −8.79122 | 10 | Mari | 0.756 | 6.400 | 0.009 | 6.875 | 0.103* | 5 | 5.000 | 2.995 | |
| 30 | Carvoeiro | 37.09582 | −8.47155 | 26 | Mari | 0.684 | 5.511 | 0.074 | 8.500 | 0.161* | 4 | 3.919 | 1.988 | |
| 31 | Chiclana de la Frontera | 36.42903 | −6.15942 | 15 | Mari | 0.821 | 7.081 | 0.099 | 9.250 | 0.107* | 5 | 4.576 | 2.348 | |
| 32 | Barbate | 36.19350 | −5.90813 | 21 | Mari | 0.748 | 5.940 | 0.010 | 8.750 | −0.02 | 2 | 1.646 | 1.510 | |
| 33 | Zahara | 36.13983 | −5.85178 | 15 | Mari | 0.752 | 6.394 | 0.046 | 8.250 | 0.047 | 5 | 4.713 | 1.953 | |
| 34 | Tarifa | 36.0095 | −5.60633 | 22 | Mari | 0.833 | 7.329 | 0.097 | 11.500 | −0.03 | 6 | 5.298 | 2.844 | |
| 35 | Estepona | 36.41867 | −5.17850 | 32 | Mari | 0.699 | 5.042 | 0.061 | 7.625 | 0.071* | 2 | 2.000 | 1.250 | |
| 36 | Almayate | 36.72283 | −4.14383 | 32 | Mari | 0.816 | 6.325 | 0.005 | 9.625 | 0.071* | 4 | 3.775 | 1.961 | |
| Morocco | 37 | Cap Mazari | 35.53830 | −5.21467 | 24 | Mari | 0.744 | 6.099 | 0.076 | 9.500 | 0.019 | 4 | 3.120 | 1.864 |
| 38 | Cabo Negro | 35.66600 | −5.28470 | 24 | Mari | 0.653 | 4.824 | 0.049 | 6.875 | 0.198* | 3 | 2.866 | 1.476 | |
| 39 | Ksar-as-Seghir | 35.84418 | −5.55490 | 24 | Mari | 0.753 | 5.651 | 0.077 | 7.750 | −0.016 | 2 | 2.000 | 1.250 | |
| 40 | Ksar-as-Seghir | 35.82791 | −5.65704 | 33 | Mari | 0.692 | 4.421 | 0.226 | 6.500 | −0.033 | 3 | 1.858 | 1.602 | |
| 41 | Cap Malabata | 35.79852 | −5.75094 | 26 | Macro | 0.045 | 1.234 | 0.000 | 1.250 | 1.000* | 1 | 1.000 | 1.000 | |
| 42 | North of Asilah | 35.53147 | −6.00637 | 25 | Mari | 0.724 | 6.146 | 0.017 | 9.000 | 0.012 | 3 | 2.786 | 1.460 | |
| 43 | Asilah | 35.47471 | −6.02639 | 15 | Mari | 0.683 | 5.332 | 0.037 | 6.875 | 0.127* | 4 | 3.801 | 2.158 | |
| 44 | Asilah | 35.46424 | −6.04214 | 19 | Mari | 0.790 | 5.841 | 0.279 | 7.375 | 0.01 | 1 | 1.000 | 1.000 | |
| 45 | Larache | 35.19856 | −6.15395 | 34 | Mari | 0.713 | 5.431 | 0.120 | 8.750 | 0.006 | 4 | 3.254 | 1.585 | |
| 46 | Mehdiya harbor | 34.26198 | −6.66486 | 10 | Mari | 0.573 | 3.609 | 0.004 | 3.625 | −0.025 | 1 | 1.000 | 1.000 | |
| 47 | Mehdiya beach | 34.24847 | −6.68020 | 15 | Mari | 0.522 | 3.925 | 0.000 | 4.750 | 0.043 | 3 | 2.963 | 1.741 | |
| 48 | Bouknadel | 34.14674 | −6.73757 | 31 | Mari | 0.636 | 5.399 | 0.008 | 8.125 | 0.096 | 5 | 3.652 | 1.699 | |
| 49 | Rabat | 34.03328 | −6.83532 | 24 | Mari | 0.679 | 5.541 | 0.090 | 8.500 | 0.041 | 4 | 3.914 | 2.234 | |
| 50 | Rabat | 33.95541 | −6.92240 | 14 | Mari | 0.692 | 6.664 | 0.027 | 8.625 | −0.021 | 7 | 6.425 | 3.153 | |
| 51 | Temara | 33.92765 | −6.96061 | 17 | Mari | 0.701 | 6.361 | 0.069 | 8.750 | 0.082* | 5 | 4.168 | 2.035 | |
| 52 | Skhirat beach | 33.89583 | −7.00148 | 12 | Mari | 0.643 | 5.697 | 0.091 | 6.500 | 0.087 | 3 | 2.933 | 1.737 | |
| 53 | Casablanca | 33.57103 | −7.70927 | 15 | Mari | 0.692 | 6.305 | 0.032 | 8.125 | 0.036 | 5 | 4.372 | 1.920 | |
| 54 | Casablanca | 33.53502 | −7.78873 | 16 | Mari | 0.654 | 6.102 | 0.090 | 8.250 | 0.104* | 4 | 3.515 | 1.863 | |
| 55 | Tamaris Beach | 33.52242 | −7.84612 | 17 | Mari | 0.684 | 6.064 | 0.010 | 8.625 | 0.054 | 3 | 2.991 | 1.499 | |
| 56 | Rit Reima | 33.47979 | −7.94681 | 13 | Mari | 0.702 | 6.361 | 0.159 | 7.750 | 0.083* | 4 | 3.723 | 1.956 | |
| 57 | El Jadida | 33.25606 | −8.50058 | 23 | Mari | 0.653 | 5.782 | 0.032 | 8.750 | 0.019 | 5 | 4.096 | 2.055 | |
| 58 | Sidi Moussa | 32.54697 | −9.27294 | 15 | Mari | 0.617 | 5.413 | 0.060 | 6.875 | −0.013 | 3 | 2.952 | 1.992 | |
| 59 | Safi | 32.32353 | −9.26135 | 25 | Mari | 0.660 | 5.797 | 0.003 | 8.250 | 0.09 | 6 | 5.590 | 2.413 | |
| 60 | El Mehattat | 31.82972 | −9.54357 | 24 | Mari | 0.700 | 6.497 | 0.030 | 9.500 | 0.018 | 4 | 3.802 | 1.996 | |
| 61 | Moulay-Bouzerktoun | 31.64687 | −9.66897 | 21 | Mari | 0.689 | 6.279 | 0.053 | 9.500 | 0.069* | 7 | 5.951 | 2.462 | |
| 62 | Essaouira | 31.49162 | −9.76452 | 26 | Mari | 0.716 | 6.665 | 0.081 | 11.250 | 0.122* | 6 | 5.396 | 2.126 | |
| 63 | Immesouanne Beach | 30.84024 | −9.82156 | 20 | Mari | 0.524 | 3.337 | 0.021 | 4.250 | −0.113 | 1 | 1.000 | 1.000 | |
| 64 | Immesouanne Beach | 30.83945 | −9.82058 | 20 | Mari | 0.647 | 4.310 | 0.004 | 5.125 | −0.067* | 4 | 3.993 | 2.150 | |
| 65 | Tarhazoute | 30.56927 | −9.74449 | 18 | Macro | 0.100 | 1.735 | 0.000 | 1.750 | 0.926* | 1 | 1.000 | 1.000 | |
| 66 | North of Tarhazoute | 30.56915 | −9.74450 | 30 | Macro | 0.062 | 1.470 | 0.235 | 1.750 | 0.723* | 1 | 1.000 | 1.000 | |
| 67 | Imourane Beach | 30.50862 | −9.68645 | 4 | Mari | 0.766 | – | – | 4.375 | −0.184* | – | – | – | |
| 68 | Aglou Beach | 29.80457 | −9.83363 | 20 | Mari | 0.687 | 5.217 | 0.101 | 7.375 | −0.146 | – | – | – | |
| A | Tétouan | 35.56475 | −5.59577 | 24 | Mari | 0.766 | 5.808 | 0.090 | 8.375 | 0.109* | 4 | 3.374 | 1.772 | |
| B | Khemisset | 33.86032 | −5.86353 | 20 | Mari | 0.727 | 5.998 | 0.019 | 8.375 | −0.049 | 7 | 5.586 | 2.792 | |
| B | Khemisset | 33.86032 | −5.86353 | 4 | Macro | – | – | – | 2.875 | 0.657* | 1 | – | – | |
| C | Tiflét | 33.83300 | −6.13092 | 24 | Mari | 0.762 | 6.843 | 0.163 | 11.500 | 0.071* | 5 | 4.458 | 2.136 | |
| D | Tiflét | 33.88387 | −6.2798 | 24 | Mari | 0.673 | 5.289 | 0.000 | 7.250 | 0.080* | 3 | 2.245 | 1.547 | |
| E | Rabat Center | 34.01871 | −6.82016 | 13 | Mari | 0.726 | 6.351 | 0.120 | 7.750 | 0.192* | 6 | 5.570 | 2.455 | |
| F | Bouznika | 33.77795 | −7.23266 | 21 | Mari | 0.729 | 6.489 | 0.031 | 9.750 | 0.118* | 2 | 1.998 | 1.476 | |
| G | Azemmour | 33.28874 | −8.33113 | 19 | Mari | 0.691 | 5.734 | 0.021 | 8.000 | 0.076* | 5 | 4.316 | 1.864 | |
| H | Sebt-des-Oulad-Hassine | 33.11637 | −8.44159 | 2 | Mari | – | – | – | – | – | – | – | – | |
| H | Sebt-des-Oulad-Hassine | 33.11637 | −8.44159 | 6 | Macro | 0 | – | – | 1.000 | – | 1 | – | – | |
| I | Settat | 33.01755 | −7.62048 | 33 | Mari | 0.787 | 6.826 | 0.021 | 11.750 | 0.151* | 9 | 6.15 | 2.880 | |
| J | El Guelb | 32.59028 | −7.81497 | 4 | Mari | 0.620 | – | – | 3.375 | −0.109 | 1 | – | – | |
| J | El Guelb | 32.59028 | −7.81497 | 37 | Macro | 0.073 | 1.770 | 0.062 | 2.375 | 0.716* | 1 | 1.000 | 1.000 | |
| K | Benguerir | 32.09525 | −7.95204 | 15 | Mari | 0.722 | 6.887 | 0.182 | 9.250 | −0.022 | 7 | 6.466 | 2.452 | |
| L | Marrakech | 31.62862 | −8.11320 | 18 | Mari | 0.806 | 7.253 | 0.087 | 10.375 | 0.070* | 5 | 4.954 | 2.187 | |
| M | Zoudia | 31.62891 | −8.26613 | 19 | Mari | 0.744 | 6.629 | 0.164 | 9.750 | 0.115* | 7 | 6.051 | 2.611 | |
| N | Oudaya | 31.59095 | −8.43793 | 11 | Mari | 0.764 | 6.294 | 0.010 | 6.625 | 0.091 | 4 | 3.993 | 2.250 | |
| O | Chichaoua East | 31.55745 | −8.72626 | 14 | Mari | 0.767 | 6.654 | 0.072 | 8.625 | −0.013 | 4 | 3.933 | 2.213 | |
| P | Chichaoua Center | 31.54526 | −8.75929 | 18 | Mari | 0.779 | 7.559 | 0.100 | 11.500 | 0.101* | 8 | 6.890 | 2.671 | |
| Q | Chichaoua | 31.53588 | −8.76460 | 29 | Mari | 0.748 | 7.170 | 0.090 | 12.625 | 0.081* | 6 | 4.696 | 2.231 | |
| R | South of Essaouira | 31.39083 | −9.71322 | 14 | Mari | 0.634 | 4.357 | 0.125 | 5.000 | −0.029 | 3 | 2.823 | 1.470 | |
| S | Immesouanne | 30.84051 | −9.78695 | 19 | Mari | 0.754 | 6.664 | 0.021 | 9.250 | 0.048 | 5 | 4.559 | 2.597 | |
| T | North of Guelmin | 29.26903 | −9.73838 | 16 | Mari | 0.739 | 6.406 | 0.355 | 8.750 | 0.006 | 4 | 3.516 | 2.159 | |
| Santo Porto Island | 69 | Serra de Dentra | 33.08833 | −16.3102 | 16 | Macro | 0.535 | 3.375 | 0.001 | 3.375 | −0.461* | 2 | 2.000 | 1.250 |
| 70 | Adega das Levadas | 33.03647 | −16.37742 | 17 | Macro | 0.528 | 4.051 | 0.000 | 4.125 | 0.234* | 4 | 3.996 | 1.749 | |
| Madeira Island | 71 | Porto Moniz | 32.86643 | −17.1663 | 21 | Mari | 0.605 | 3.656 | 0.017 | 4.375 | 0.115* | 1 | 1.000 | 1.000 |
| 72 | Ponta do Pargo | 32.81427 | −17.26288 | 24 | Mari | 0.702 | 4.121 | 0.000 | 4.750 | −0.01 | 2 | 1.815 | 1.215 | |
| 73 | Caniço de Baixa | 32.64597 | −16.82443 | 18 | Mari | 0.745 | 5.242 | 0.006 | 7.000 | 0.194* | 5 | 4.596 | 1.924 | |
| Mean multilocus estimates | Mari | 0.678 | 5.367 | 0.052 | 7.239 | 0.050* | 3.965 | 3.573 | 1.915 | |||||
| Macro | 0.223 | 2.272 | 0.050 | 2.313 | 0.769* | 1.500 | 1.666 | 1.167 | ||||||
Data Accessibility
Coordinates of sample locations, cytoplasmic, and nuclear genetic data are available in DRYAD: doi: 10.5061/dryad.m1n38.
Conflict of Interest
None declared.
Supporting Information
Additional Supporting Information may be found in the online version of this article:
Figure S1. Assignment results from Bayesian clustering following Pritchard et al. (2000) performed on (A) B. vulgaris subsp. maritima and B. macrocarpa individuals (B) B. vulgaris subsp. maritima individuals only; and, (C) following Durand et al. (2009) on both species. STRUCTURE analyses (A,B): mean (±SD) probabilities of the data Ln Pr(X|K) over 15 replicated runs plotted as a function of the putative number of clusters K (blue dots) and the standardized second-order rate of change of Ln Pr(X|K), ΔK, as a function of K (red dots). TESS analyses (C): average Deviation Index Criterion (DIC) over 20 replicated runs plotted against K.
Figure S2. Assignment probabilities of membership of (A) B. vulgaris subsp. maritima individuals into the five inferred clusters for the second modal value, and (B) B. vulgaris subsp. maritima and B. macrocarpa individuals into the six inferred clusters for the second modal value. Each individual is represented by a thin horizontal line (y axis) partitioned into coloured segments that represented the individual's estimated membership coefficients (x axis) (C) Map of mean population membership probabilities for the six clusters.
Figure S3. Population genetic structure of B. vulgaris subsp. maritima inferred from TESS analyses assuming K = 5. The individual estimates membership coefficients for each cluster are shown for 20 independent runs.
Figure S4. Geographical distribution of minisatellites haplotypes within populations.
Figure S5. Linear regressions of genetic diversity indices based on nuclear (Ar, HE, ArP) and based on cytoplasmic (Ar) polymorphism with respect to latitude and coastline distance for each locus. Regressions were performed on (A) northern populations (labelled 1 to 40 in Fig. 1), and (B) Moroccan populations at lower latitudes (labelled 43 to t).
Figure S6. Matrices of population-pairwise differentiation values (FST) of B. vulgaris subsp. maritima and B. macrocarpa individuals represented for (A) nuclear and (B) cytoplasmic data.
Figure S7. Individual representation of the three first global axes of the spatial principal component analysis (sPCA) performed on B. vulgaris subsp. maritima populations. According to the first three global eigenvalues, First (A), second (B), and third (C) sPCA scores, are represented on each plot as squares whose size is proportional to the value of the score, so that the maximum differentiation is between large white squares and large black squares.
Figure S8. Individual representation of the three first global axes of the spatial principal component analysis (sPCA) performed on B. vulgaris subsp. maritima and Beta macrocarpa populations.
Figure S9. Modern (12°C, 14°C and 16°C mean July, northern Europe) and reconstructed (June/July/August isotherms, southern Europe) Last Glacial Maximum (LGM) isotherms from Kadereit et al. 2005;. Bold lines indicate the ice shield during the LGM and dotted lines indicate the coastline during the LGM.
Table S1. Mantel tests carried out on genetic distance matrices based on nuclear and cytoplasmic data for B. vulgaris subsp. maritima populations and either (1) Euclidian geographical distance matrices, (2) matrices of geographical distance measured along the coastline or (3) geographical distance matrices determined through a neighbourhood graph.
Table S2. Linear mixed models with loci as random intercept testing the relationship between genetic diversity parameters (based on nuclear and cytoplasmic polymorphism) and explanatory variables (latitude and coastline distance). Models were performed on two datasets to take into account the genetic discontinuities indicated as G1 for northern populations (labelled 1 to 40 in Fig. 1), and G2 for Moroccan populations at lower latitudes (labelled 43 to t).
References
- Alberto F, Santos R, Leitão JM. Assessing patterns of geographic dispersal of Gelidium sesquipedale (Rhodophyta) through RAPD differentiation of populations. Mar. Ecol. Prog. Ser. 1999;191:101–108. [Google Scholar]
- Alcala N, Streit D, Goudet J, Vuilleumier S. Peak and persistent excess of genetic diversity following an abrupt migration increase. Genetics. 2013;193:953–971. doi: 10.1534/genetics.112.147785. [DOI] [PMC free article] [PubMed] [Google Scholar]
- Arnaud J-F, Fénart S, Godé C, Deledicque S, Touzet P, Cuguen J. Fine-scale geographical structure of genetic diversity in inland wild beet populations. Mol. Ecol. 2009;18:3201–3215. doi: 10.1111/j.1365-294X.2009.04279.x. [DOI] [PubMed] [Google Scholar]
- Arnaud J-F, Fénart S, Cordellier M, Cuguen J. Populations of weedy crop-wild hybrid beets show contrasting variation in mating system and population genetic structure. Evol. Appl. 2010;3:305–318. doi: 10.1111/j.1752-4571.2010.00121.x. [DOI] [PMC free article] [PubMed] [Google Scholar]
- Arnaud J-F, Cuguen J, Fénart S. Metapopulation structure and fine-scaled genetic structuring in crop-wild hybrid weed beets. Heredity. 2011;107:395–404. doi: 10.1038/hdy.2011.23. [DOI] [PMC free article] [PubMed] [Google Scholar]
- Austerlitz F, Jung-Muller B, Godelle B, Gouyon P-H. Evolution of coalescence times, genetic diversity and structure during colonization. Theor. Popul. Biol. 1997;51:148–164. [Google Scholar]
- Barrett SCH, Colautti RI, Eckert CG. Plant reproductive systems and evolution during biological invasion. Mol. Ecol. 2008;17:373–383. doi: 10.1111/j.1365-294X.2007.03503.x. [DOI] [PubMed] [Google Scholar]
- Bartsch D, Ellstrand NC. Genetic evidence for the origin of Californian wild beets (genus Beta. Theor. Appl. Genet. 1999;99:1120–1130. [Google Scholar]
- Biancardi E, Panella LW, Lewellen RT. Beta maritima: the origin of beets. New York, NY: Springer; 2012. [Google Scholar]
- Blondel J. The ‘design’ of Mediterranean landscapes: a millennial story of humans and ecological systems during the historic period. Hum. Ecol. 2006;34:713–729. [Google Scholar]
- Bruun L, Haldrup A, Petersen SG, Frese L, de Bock TSM, Lange W. Self-incompatibility reactions in wild species of the genus Beta and their relation to taxonomical classification and geographical origin. Genet. Resour. Crop Evol. 1995;42:293–301. [Google Scholar]
- Buttler KP. Variation in wild populations of annual beet (Beta, Chenopodiaceae) Plant Syst. Evol. 1977;128:123–136. [Google Scholar]
- Castro S, Romeiras MM, Castro M, Duarte MC, Loureiro J. Hidden diversity in wild Beta taxa from Portugal: insights from genome size and ploidy level estimations using flow cytometry. Plant Sci. 2013;207:72–78. doi: 10.1016/j.plantsci.2013.02.012. [DOI] [PubMed] [Google Scholar]
- Caujapé-Castells J, Jansen RK. The influence of the Miocene Mediterranean desiccation on the geographical expansion and genetic variation of Androcymbium gramineum (Cav.) McBride (Colchicaceae) Mol. Ecol. 2003;12:1515–1525. doi: 10.1046/j.1365-294x.2003.01839.x. [DOI] [PubMed] [Google Scholar]
- Cavalli-Sforza LL, Edwards AWF. Phylogenetic analysis: models and estimation procedures. Evolution. 1967;21:550–570. doi: 10.1111/j.1558-5646.1967.tb03411.x. [DOI] [PubMed] [Google Scholar]
- Chen C, Durand E, Forbes F, François O. Bayesian clustering algorithms ascertaining spatial population structure: a new computer program and a comparison study. Mol. Ecol. Notes. 2007;7:747–756. [Google Scholar]
- Clausing G, Vickers K, Kadereit JW. Historical biogeography in a linear system: genetic variation of Sea Rocket (Cakile maritima) and Sea Holly (Eryngium maritimum) along European coasts. Mol. Ecol. 2000;9:1823–1833. doi: 10.1046/j.1365-294x.2000.01083.x. [DOI] [PubMed] [Google Scholar]
- Collina-Girard J. L'Atlantide devant le détroit de Gibraltar ? Mythe et géologie. Earth Planet. Sci. 2001;333:233–240. [Google Scholar]
- Comes HP, Abbott RJ. The relative importance of historical events and gene flow on the population structure of a Mediterranean ragwort, Senecio gallicus (Asteraceae) Evolution. 1998;52:355–367. doi: 10.1111/j.1558-5646.1998.tb01637.x. [DOI] [PubMed] [Google Scholar]
- Coulon A, Cosson JF, Morellet N, Angibault J-M, Cargnelutti B, Galan M, et al. Dispersal is not female biased in a resource-defence mating ungulate, the European roe deer. Proc. R. Soc. B Biol. Sci. 2006;273:341–348. doi: 10.1098/rspb.2005.3329. [DOI] [PMC free article] [PubMed] [Google Scholar]
- Coyer JA, Hoarau G, Costa JF, Hogerdijk B, Serrão EA, Billard E, et al. Evolution and diversification within the intertidal brown macroalgae Fucus spiralisF. vesiculosus species complex in the North Atlantic. Mol. Phylogenet. Evol. 2011;58:283–296. doi: 10.1016/j.ympev.2010.11.015. [DOI] [PubMed] [Google Scholar]
- De Cauwer I, Dufay M, Cuguen J, Arnaud J-F. Effects of fine-scale genetic structure on male mating success in gynodioecious Beta vulgaris ssp. maritima. Mol. Ecol. 2010;19:1540–1558. doi: 10.1111/j.1365-294X.2010.04586.x. [DOI] [PubMed] [Google Scholar]
- De Cauwer I, Arnaud J-F, Courseaux A, Dufay M. Sex-specific fitness variation in gynodioecious Beta vulgaris ssp. maritima: do empirical observations fit theoretical predictions? J. Evol. Biol. 2011;24:2456–2472. doi: 10.1111/j.1420-9101.2011.02380.x. [DOI] [PubMed] [Google Scholar]
- De Cauwer I, Dufay M, Hornoy B, Courseaux A, Arnaud J-F. Gynodioecy in structured populations: understanding fine-scale sex ratio variation in Beta vulgaris ssp. maritima. Mol. Ecol. 2012;21:834–850. doi: 10.1111/j.1365-294X.2011.05414.x. [DOI] [PubMed] [Google Scholar]
- Desplanque B, Boudry P, Broomberg K, Saumitou-Laprade P, Cuguen J, Van Dijk H. Genetic diversity and gene flow between wild, cultivated and weedy forms of Beta vulgaris L (Chenopodiaceae), assessed by RFLP and microsatellite markers. Theor. Appl. Genet. 1999;98:1194–1201. [Google Scholar]
- D'Hondt B, Breyne P, Van Landuyt W, Hoffmann M. Genetic analysis reveals human-mediated long-distance dispersal among war cemeteries in Trifolium micranthum. Plant Ecol. 2012;213:1241–1250. [Google Scholar]
- Diekmann OE, Coyer JA, Ferreira J, Olsen JL, Stam WT, Pearson GA, et al. Population genetics of Zostera noltii along the west Iberian coast: consequences of small population size, habitat discontinuity and near-shore currents. Mar. Ecol. Prog. Ser. 2005;290:89–96. [Google Scholar]
- Duminil J, Hardy OJ, Petit RJ. Plant traits correlated with generation time directly affect inbreeding depression and mating system and indirectly genetic structure. BMC Evol. Biol. 2009;9:177. doi: 10.1186/1471-2148-9-177. [DOI] [PMC free article] [PubMed] [Google Scholar]
- Durand E, Jay F, Gaggiotti O, François O. Spatial inference of admixture proportions and secondary contact zones. Mol. Biol. Evol. 2009;26:1963–1973. doi: 10.1093/molbev/msp106. [DOI] [PubMed] [Google Scholar]
- El Mousadik A, Petit RJ. High level of genetic differentiation for allelic richness among populations of the argan tree Argania spinosa (L) Skeels endemic to Morocco. Theor. Appl. Genet. 1996;92:832–839. doi: 10.1007/BF00221895. [DOI] [PubMed] [Google Scholar]
- Ellstrand NC, Schierenbeck KA. Hybridization as a stimulus for the evolution of invasiveness in plants? Proc. Natl Acad. Sci. USA. 2000;97:7043–7050. doi: 10.1073/pnas.97.13.7043. [DOI] [PMC free article] [PubMed] [Google Scholar]
- Ennos RA. Estimating the relative rates of pollen and seed migration among plant-populations. Heredity. 1994;72:250–259. [Google Scholar]
- Evanno G, Regnaut S, Goudet J. Detecting the number of clusters of individuals using the software STRUCTURE: a simulation study. Mol. Ecol. 2005;14:2611–2620. doi: 10.1111/j.1365-294X.2005.02553.x. [DOI] [PubMed] [Google Scholar]
- Falush D, Stephens M, Pritchard JK. Inference of population structure using multilocus genotype data: linked loci and correlated allele frequencies. Genetics. 2003;164:1567–1587. doi: 10.1093/genetics/164.4.1567. [DOI] [PMC free article] [PubMed] [Google Scholar]
- Fayard J, Klein EK, Lefèvre F. Long distance dispersal and the fate of a gene from the colonization front. J. Evol. Biol. 2009;22:2171–2182. doi: 10.1111/j.1420-9101.2009.01832.x. [DOI] [PubMed] [Google Scholar]
- Fénart S, Austerlitz F, Cuguen J, Arnaud J-F. Long distance pollen-mediated gene flow at a landscape level: the weed beet as a case study. Mol. Ecol. 2007;16:3801–3813. doi: 10.1111/j.1365-294X.2007.03448.x. [DOI] [PubMed] [Google Scholar]
- Fénart S, Arnaud J-F, De Cauwer I, Cuguen J. Nuclear and cytoplasmic genetic diversity in weed beet and sugar beet accessions compared to wild relatives: new insights into the genetic relationships within the Beta vulgaris complex species. Theor. Appl. Genet. 2008;116:1063–1077. doi: 10.1007/s00122-008-0735-1. [DOI] [PubMed] [Google Scholar]
- Fievet V, Touzet P, Arnaud J-F, Cuguen J. Spatial analysis of nuclear and cytoplasmic DNA diversity in wild sea beet (Beta vulgaris ssp. maritima) populations: do marine currents shape the genetic structure? Mol. Ecol. 2007;16:1847–1864. doi: 10.1111/j.1365-294X.2006.03208.x. [DOI] [PubMed] [Google Scholar]
- Frese L, Demeijer E, Letschert J. New wild beet genetic resources from Portugal and Spain. Zuckerindustrie. 1990;115:950–955. [Google Scholar]
- García-Verdugo C, Forrest AD, Fay MF, Vargas P. The relevance of gene flow in metapopulation dynamics of an oceanic island endemic, Olea europaea subsp. guanchica. Evolution. 2010;64:3525–3536. doi: 10.1111/j.1558-5646.2010.01091.x. [DOI] [PubMed] [Google Scholar]
- Giles BE, Goudet J. A case study of genetic structure in a plant metapopulation. In: Hanski I, Gilpin ME, editors. Metapopulation biology: ecology, genetics, and evolution. San Diego, CA: Academic Press; 1997. pp. 429–454. [Google Scholar]
- González-Martínez SC, Dubreuil M, Riba M, Vendramin GG, Sebastiani F, Mayol M. Spatial genetic structure of Taxus baccata L. in the western Mediterranean Basin: past and present limits to gene movement over a broad geographic scale. Mol. Phylogenet. Evol. 2010;55:805–815. doi: 10.1016/j.ympev.2010.03.001. [DOI] [PubMed] [Google Scholar]
- Goudet J. FSTAT (Version 1.2): a computer program to calculate F-statistics. J. Hered. 1995;86:485–486. [Google Scholar]
- Goudet J. HIERFSTAT, a package for R to compute and test hierarchical F-statistics. Mol. Ecol. Notes. 2005;5:184–186. [Google Scholar]
- Guo Q. Incorporating latitudinal and central-marginal trends in assessing genetic variation across species ranges. Mol. Ecol. 2012;21:5396–5403. doi: 10.1111/mec.12012. [DOI] [PubMed] [Google Scholar]
- Haag CR, Riek M, Hottinger JW, Pajunen VI, Ebert D. Genetic diversity and genetic differentiation in Daphnia metapopulations with subpopulations of known age. Genetics. 2005;170:1809–1820. doi: 10.1534/genetics.104.036814. [DOI] [PMC free article] [PubMed] [Google Scholar]
- Hampe A, Petit RJ. Conserving biodiversity under climate change: the rear edge matters. Ecol. Lett. 2005;8:461–467. doi: 10.1111/j.1461-0248.2005.00739.x. [DOI] [PubMed] [Google Scholar]
- Hamrick JL, Godt MJW. Effects of life history traits on genetic diversity in plant species. Philos. Trans. R. Soc. Lond. B Biol. Sci. 1996;351:1291–1298. [Google Scholar]
- Hautekèete NC, Piquot Y, Van Dijk H. Life span in Beta vulgaris ssp. maritima: the effects of age at first reproduction and disturbance. J. Ecol. 2002;90:508–516. [Google Scholar]
- Hewitt GM. Post-glacial recolonization of European biota. Biol. J. Linn. Soc. 1999;68:87–112. [Google Scholar]
- Hewitt GM. The genetic legacy of the Quaternary ice ages. Nature. 2000;405:907–913. doi: 10.1038/35016000. [DOI] [PubMed] [Google Scholar]
- Hewitt GM. Genetic consequences of climatic oscillations in the Quaternary. Philos. Trans. R. Soc. Lond. B Biol. Sci. 2004;359:183–195. doi: 10.1098/rstb.2003.1388. [DOI] [PMC free article] [PubMed] [Google Scholar]
- Husband BC, Schemske DW. The effect of inbreeding in diploid and tetraploid populations of Epilobium angustifolium (Onagraceae): implications for the genetic basis of inbreeding depression. Evolution. 1997;51:737–746. doi: 10.1111/j.1558-5646.1997.tb03657.x. [DOI] [PubMed] [Google Scholar]
- Hutchison DW, Templeton AR. Correlation of pairwise genetic and geographic distance measures: inferring the relative influences of gene flow and drift on the distribution of genetic variability. Evolution. 1999;53:1898–1914. doi: 10.1111/j.1558-5646.1999.tb04571.x. [DOI] [PubMed] [Google Scholar]
- Jakobsson M, Rosenberg NA. CLUMPP: a cluster matching and permutation program for dealing with label switching and multimodality in analysis of population structure. Bioinformatics. 2007;23:1801–1806. doi: 10.1093/bioinformatics/btm233. [DOI] [PubMed] [Google Scholar]
- Jombart T. ADEGENET: a R package for the multivariate analysis of genetic markers. Bioinformatics. 2008;24:1403–1405. doi: 10.1093/bioinformatics/btn129. [DOI] [PubMed] [Google Scholar]
- Jombart T, Devillard S, Dufour AB, Pontier D. Revealing cryptic spatial patterns in genetic variability by a new multivariate method. Heredity. 2008;101:92–103. doi: 10.1038/hdy.2008.34. [DOI] [PubMed] [Google Scholar]
- Jombart T, Pontier D, Dufour AB. Genetic markers in the playground of multivariate analysis. Heredity. 2009;102:330–341. doi: 10.1038/hdy.2008.130. [DOI] [PubMed] [Google Scholar]
- Jung C, Pillen K, Frese L, Fahr S, Melchinger AE. Phylogenetic relationships between cultivated and wild species of the genus Beta revealed by DNA fingerprinting. Theor. Appl. Genet. 1993;86:449–457. doi: 10.1007/BF00838560. [DOI] [PubMed] [Google Scholar]
- Kadereit JW, Arafeh R, Somogyi G, Westberg E. Terrestrial growth and marine dispersal? Comparative phylogeography of five coastal plant species at a European scale. Taxon. 2005;54:861–876. [Google Scholar]
- Kadereit G, Hohmann S, Kadereit JW. A synopsis of Chenopodiaceae subfam. Betoideae and notes on the taxonomy of Beta. Willdenowia. 2006;36:9–19. [Google Scholar]
- Kishima Y, Mikami T, Hirai A, Sugiura M, Kinoshita T. Beta chloroplast genomes: analysis of fraction I protein and chloroplast DNA variation. Theor. Appl. Genet. 1987;73:330–336. doi: 10.1007/BF00262497. [DOI] [PubMed] [Google Scholar]
- Koutsikopoulos C, LeCann B. Physical processes and hydrological structures related to the Bay of Biscay anchovy. Scientia Marina. 1996;60:9–19. [Google Scholar]
- Krüger AM, Hellwig FH, Oberprieler C. Genetic diversity in natural and anthropogenic inland populations of salt-tolerant plants: random amplified polymorphic DNA analyses of Aster tripolium L. (Compositae) and Salicornia ramosissima Woods (Chenopodiaceae) Mol. Ecol. 2002;11:1647–1655. doi: 10.1046/j.1365-294x.2002.01562.x. [DOI] [PubMed] [Google Scholar]
- Lange W, Debock TSM. The diploidised meiosis of tetraploid Beta macrocarpa and its possible application in breeding sugar-beet. Plant Breeding. 1989;103:196–206. [Google Scholar]
- Lavergne S, Hampe A, Arroyo J. In and out of Africa: how did the Strait of Gibraltar affect plant species migration and local diversification? J. Biogeogr. 2013;40:24–36. [Google Scholar]
- Letschert JPW. Beta section Beta: biogeographical patterns of variation and taxonomy. Wageningen Agricultural University papers. 1993;93:1–137. [Google Scholar]
- Lombaert E, Guillemaud T, Thomas CE, Handley LJL, Li J, Wang S, et al. Inferring the origin of populations introduced from a genetically structured native range by approximate Bayesian computation: case study of the invasive ladybird Harmonia axyridis. Mol. Ecol. 2011;20:4654–4670. doi: 10.1111/j.1365-294X.2011.05322.x. [DOI] [PubMed] [Google Scholar]
- Lumaret R, Mir C, Michaud H, Raynal V. Phylogeographical variation of chloroplast DNA in holm oak (Quercus ilex L.) Mol. Ecol. 2002;11:2327–2336. doi: 10.1046/j.1365-294x.2002.01611.x. [DOI] [PubMed] [Google Scholar]
- Martins CS, Hamann M, Fiúza AFG. Surface circulation in the eastern North Atlantic, from drifters and altimetry. J. Geophys. Res. 2002;107:1–22. [Google Scholar]
- McGrath JM, Trebbi D, Fenwick A, Panella L, Schulz B, Laurent V, et al. An open-source first-generation molecular genetic map from a sugarbeet x table beet cross and its extension to physical mapping. Crop Sci. 2007;47:S27–S44. [Google Scholar]
- Médail F, Quézel P. Hot-spots analysis for conservation of plant biodiversity in the Mediterranean basin. Ann. Mo. Bot. Gard. 1997;84:112–127. [Google Scholar]
- Menozzi P, Piazza A, Cavallisforza L. Synthetic maps of human gene-frequencies in Europeans. Science. 1978;201:786–792. doi: 10.1126/science.356262. [DOI] [PubMed] [Google Scholar]
- Migliore J, Baumel A, Juin M, Médail F. From Mediterranean shores to central Saharan mountains: key phylogeographical insights from the genus Myrtus. J. Biogeogr. 2012;39:942–956. [Google Scholar]
- Millot C. Circulation in the Western Mediterranean Sea. J. Mar. Syst. 1999;20:423–442. [Google Scholar]
- Mörchen M, Cuguen J, Michaelis G, Hanni C, Saumitou-Laprade P. Abundance and length polymorphism of microsatellite repeats in Beta vulgaris L. Theor. Appl. Genet. 1996;92:326–333. doi: 10.1007/BF00223675. [DOI] [PubMed] [Google Scholar]
- Naveh Z, Vernet JL. The palaeohistory of the Mediterranean biota. In: Groves RH, Di Castri F, editors. Biogeography of Mediterranean invasions. Cambridge, U.K: Cambridge University Press; 1991. pp. 19–32. [Google Scholar]
- Nishizawa S, Kubo T, Mikami T. Variable number of tandem repeat loci in the mitochondrial genomes of beets. Curr. Genet. 2000;37:34–38. doi: 10.1007/s002940050005. [DOI] [PubMed] [Google Scholar]
- Oden NL, Sokal RR. Directional autocorrelation – an extension of spatial correlograms to two dimensions. Syst. Zool. 1986;35:608–617. [Google Scholar]
- Ortiz MÁ, Tremetsberger K, Talavera S, Stuessy T, García-Castaño JL. Population structure of Hypochaeris salzmanniana DC. (Asteraceae), an endemic species to the Atlantic coast on both sides of the Strait of Gibraltar, in relation to Quaternary sea level changes. Mol. Ecol. 2007;16:541–552. doi: 10.1111/j.1365-294X.2006.03157.x. [DOI] [PubMed] [Google Scholar]
- Owen FV. Inheritance of cross- and self-sterility and self-fertility in Beta vulgaris. J. Agric. Res. 1942;64:0679–0698. [Google Scholar]
- Pelegrí JL, Arístegui J, Cana L, González-Dávila M, Hernández-Guerra A, Hernández-León S, et al. Coupling between the open ocean and the coastal upwelling region off northwest Africa: water recirculation and offshore pumping of organic matter. J. Mar. Syst. 2005;54:3–37. [Google Scholar]
- Peliz Á, Dubert J, Santos AMP, Oliveira PB, Le Cann B. Winter upper ocean circulation in the Western Iberian basin - fronts, eddies and poleward flows: an overview. Deep Sea Res. I. 2005;52:621–646. [Google Scholar]
- Pereira F, Queirós S, Gusmão L, Nijman IJ, Cuppen E, Lenstra JA, et al. Tracing the History of Goat Pastoralism: new clues from Mitochondrial and Y chromosome DNA in North Africa. Mol. Biol. Evol. 2009;26:2765–2773. doi: 10.1093/molbev/msp200. [DOI] [PubMed] [Google Scholar]
- Perez FF, Mouriño C, Fraga F, Rios AF. Displacement of water masses and remineralization rates off the Iberian peninsula by nutrients anomalies. J. Mar. Res. 1993;51:869–892. [Google Scholar]
- Petit RJ, Duminil J, Fineschi S, Hampe A, Salvini D, Vendramin GG. Comparative organization of chloroplast, mitochondrial and nuclear diversity in plant populations. Mol. Ecol. 2005;14:689–701. doi: 10.1111/j.1365-294X.2004.02410.x. [DOI] [PubMed] [Google Scholar]
- Piñeira J, Quesada H, Rolán-Alvarez E, Caballero A. Genetic discontinuity associated with an environmentally induced barrier to gene exchange in the marine snail Littorina saxatilis. Mar. Ecol. Prog. Ser. 2008;357:175–184. [Google Scholar]
- Prinz K, Weising K, Hensen I. Genetic structure of coastal and inland populations of the annual halophyte Suaeda maritima (L.) dumort. in Central Europe, inferred from amplified fragment length polymorphism markers. Plant Biol. 2009;11:812–820. doi: 10.1111/j.1438-8677.2008.00178.x. [DOI] [PubMed] [Google Scholar]
- Pritchard JK, Stephens M, Donnelly P. Inference of population structure using multilocus genotype data. Genetics. 2000;155:945–959. doi: 10.1093/genetics/155.2.945. [DOI] [PMC free article] [PubMed] [Google Scholar]
- R Development Core Team. R: a language and environment for statistical computing. Vienna, Austria: R Foundation for Statistical Computing; 2011. http://www.R-project.org; ISBN: 3-900051-07-0. [Google Scholar]
- Raymond M, Rousset F. GENEPOP (Version-1.2) - Population-genetics software for exact tests and ecumenicism. J. Hered. 1995;86:248–249. [Google Scholar]
- Rice WR. Analyzing tables of statistical tests. Evolution. 1989;43:223–225. doi: 10.1111/j.1558-5646.1989.tb04220.x. [DOI] [PubMed] [Google Scholar]
- Richards CM, Brownson M, Mitchell SE, Kresovich S, Panella L. Polymorphic microsatellite markers for inferring diversity in wild and domesticated sugar beet (Beta vulgaris. Mol. Ecol. Notes. 2004;4:243–245. [Google Scholar]
- Rodríguez-Sánchez F, Pérez-Barrales R, Ojeda F, Vargas P, Arroyo J. The Strait of Gibraltar as a melting pot for plant biodiversity. Quatern. Sci. Rev. 2008;27:2100–2117. [Google Scholar]
- Rosenberg NA. DISTRUCT: a program for the graphical display of population structure. Mol. Ecol. Notes. 2004;4:137–138. [Google Scholar]
- Rosenberg MS, Anderson CD. PASSaGE: pattern analysis, spatial statistics and geographic exegesis. version 2. Methods Ecol. Evol. 2011;2:229–232. [Google Scholar]
- Sakaguchi S, Takeuchi Y, Yamasaki M, Sakurai S, Isagi Y. Lineage admixture during postglacial range expansion is responsible for the increased gene diversity of Kalopanax septemlobus in a recently colonised territory. Heredity. 2011;107:338–348. doi: 10.1038/hdy.2011.20. [DOI] [PMC free article] [PubMed] [Google Scholar]
- Slatkin M. Gene flow and genetic drift in a species subject to frequent local extinctions. Theor. Popul. Biol. 1977;12:253–262. doi: 10.1016/0040-5809(77)90045-4. [DOI] [PubMed] [Google Scholar]
- Smouse PE, Long JC, Sokal RR. Multiple regressions and correlation extensions of the Mantel test of matrix correspondence. Syst. Zool. 1986;35:627–632. [Google Scholar]
- Soltis PS, Soltis DE. The role of genetic and genomic attributes in the success of polyploids. Proc. Natl Acad. Sci. USA. 2000;97:7051–7057. doi: 10.1073/pnas.97.13.7051. [DOI] [PMC free article] [PubMed] [Google Scholar]
- Szpiech ZA, Jakobsson M, Rosenberg NA. ADZE: a rarefaction approach for counting alleles private to combinations of populations. Bioinformatics. 2008;24:2498–2504. doi: 10.1093/bioinformatics/btn478. [DOI] [PMC free article] [PubMed] [Google Scholar]
- Viard F, Bernard J, Desplanque B. Crop-weed interactions in the Beta vulgaris complex at a local scale: allelic diversity and gene flow within sugar beet fields. Theor. Appl. Genet. 2002;104:688–697. doi: 10.1007/s001220100737. [DOI] [PubMed] [Google Scholar]
- Villain S. Université Lille 1-Sciences et Technologies; 2007. Histoire évolutive de la section Beta: mise en évidence des phénomènes d'hybridation et de spéciation au sein de la Section dans le bassin Méditerranéen PhD Thesis. [Google Scholar]
- Wade MJ, McCauley DE. Extinction and recolonization: their effects on the genetic differentiation of local populations. Evolution. 1988;42:995–1005. doi: 10.1111/j.1558-5646.1988.tb02518.x. [DOI] [PubMed] [Google Scholar]
- Waters JM, Fraser CI, Hewitt GM. Founder takes all: density-dependent processes structure biodiversity. TREE. 2013;28:78–85. doi: 10.1016/j.tree.2012.08.024. [DOI] [PubMed] [Google Scholar]
- Weir BS, Cockerham CC. Estimating F-statistics for the analysis of population structure. Evolution. 1984;38:1358–1370. doi: 10.1111/j.1558-5646.1984.tb05657.x. [DOI] [PubMed] [Google Scholar]
- Westberg E, Kadereit JW. The influence of sea currents, past disruption of gene flow and species biology on the phylogeographical structure of coastal flowering plants. J. Biogeogr. 2009;36:1398–1410. [Google Scholar]
- Whitlock MC, McCauley DE. Some population genetic consequences of colony formation and extinction - genetic correlations within founding groups. Evolution. 1990;44:1717–1724. doi: 10.1111/j.1558-5646.1990.tb05243.x. [DOI] [PubMed] [Google Scholar]
- Yang RC. Estimating hierarchical F-statistics. Evolution. 1998;52:950–956. doi: 10.1111/j.1558-5646.1998.tb01824.x. [DOI] [PubMed] [Google Scholar]
- Yokoyama Y, Lambeck K, De Deckker P, Johnston P, Fifield IK. Timing of the Last Glacial Maximum from observed sea-level minima. Nature. 2000;406:713–716. doi: 10.1038/35021035. [DOI] [PubMed] [Google Scholar]
Associated Data
This section collects any data citations, data availability statements, or supplementary materials included in this article.
Supplementary Materials
Data Availability Statement
Coordinates of sample locations, cytoplasmic, and nuclear genetic data are available in DRYAD: doi: 10.5061/dryad.m1n38.