

Abstract
A statistical analysis of data from the Interagency Monitoring of Protected Visual Environments (IMPROVE) network of aerosol samplers has been used to study the spatial and temporal concentration trends in airborne particulate metals and metalloids for southern Arizona. The study region is a rapidly growing area in southwestern North America characterized by high fine soil concentrations (among the highest in the United States), anthropogenic emissions from an area within the fastest growing region in the United States, and a high density of active and abandoned mining sites. Crustal tracers in the region are most abundant in the summer (April – June) followed by fall (October – November) as a result of dry meteorological conditions which favor dust emissions from natural and anthropogenic activity. A distinct day-of-week cycle is evident for crustal tracer mass concentrations, with the greatest amplitude evident in urban areas. There have been significant reductions since 1988 in the concentrations of toxic species that are typically associated with smelting and mining. Periods with high fine soil concentrations coincide with higher concentrations of metals and metalloids in the atmosphere, with the enhancement being higher at urban sites.
Keywords: Desert, Aerosol, Arizona, Arsenic, Lead, Dust
1. Introduction
Atmospheric aerosol particles impact the planet’s radiation balance, the hydrologic cycle, public health and welfare, and biogeochemical cycling of nutrients. Aerosol particles act as carriers for potentially harmful contaminants and beneficial nutrients to ecosystems. Potential health effects of aerosol particles are linked to their physicochemical properties that govern their transport patterns, method of deposition, and ultimate health impact upon deposition. Of most concern for health effects are fine particles (mean aerodynamic diameter < 2.5 µm), as they are most effective at penetrating the extrathoracic, conducting, and pulmonary airways of the human body upon inhalation (Park and Wexler, 2008). While the size and hygroscopicity of particles will largely govern where particles deposit upon inhalation, knowledge of their composition is critical for predicting their ultimate health effect upon deposition.
Metals and metalloids, of which many are considered by the Environmental Protection Agency (EPA) to be air toxins (e.g., arsenic (As), lead (Pb), nickel (Ni), chromium (Cr), manganese (Mn)), are commonly found in ambient particles. They are natural components of crustal materials (e.g., wind-blown dust) and are also generated from high-temperature processes (smelting and fossil fuel combustion) (Thornton, 1991; Alloway, 1995; Reheis et al., 2009; Schauer et al., 2006; Navarro et al., 2008; Ettler et al., 2014). The transport of contaminants via particles is spatially more extensive than by other means such as waterways (e.g., surface and ground water) (Csavina et al., 2012). Metal and metalloid contaminants can also be found in rain and snow (e.g., Barbaris and Betterton, 1996; Cheng et al., 2011), indicating that sources of particles enriched with metals and metalloids can influence distant regions via the role of particles in serving as cloud condensation nuclei (CCN) and ice nuclei (IN) and depositing via precipitation. Concentrations of crustal-derived species (calcium, magnesium, potassium, sodium) peak between March and June in both PM2.5 and precipitation in the southwestern United States (Southwest), indicative of the role of dust as both CCN and IN (Sorooshian et al., 2013). If toxic species, or even fungi, allergens, and pathogens, are associated with such dust particles that can deposit as precipitation, they have the potential to adversely impact downwind ecosystems and biota inhabiting those areas.
The potential link between atmospheric aerosol particles, especially soil dust, and harmful metals and metalloids is a concern for arid and semi-arid regions that cover approximately one-third of the global land area. The long lifetime of metals in soils (Alloway, 1995; Kelly et al., 1996) provides a significant residence time frame for these contaminants to be transported to downwind sites via soil erosion and atmospheric transport, followed by subsequent deposition (Galloway et al., 1982; Johnson et al., 1994). In North America, the region most impacted by soil dust is the Southwest (Malm et al., 2004), which includes the focus region of this study (Figure 1). Naturally unvegetated or anthropogenically disturbed soil surfaces, such as dry lakes (“playas”), dry washes, gravel pits, large construction sites and fields (after harvest) can be major sources of wind-blown dust. Mine tailings in particular can provide large uncovered surfaces for dust emissions and contain higher concentrations of metals and metalloids than other soil surfaces (Boulet and Larocque, 1998). While regulations and initiatives for dust emission suppression (e.g., revegetation, surface moistening) are in place for active mines, mine tailings in abandoned mining sites are allowed to dry and can stay unvegetated for decades (Mendez and Maier, 2008), thus becoming sources of contaminated dust (Moreno et al., 2007).
FIG 1.

Geographic location of southern Arizona IMPROVE stations (orange markers), with altitudes above sea level reported in parentheses. Locations of selected mines, prospects, quarries, and processing mills and plants (including abandoned mines) are shown as black dots (State of Arizona Department of Mines and Mineral Resources, http://mi nes.az.gov/Publications/AzmilsMap.pdf); the emissions strength of metals and metalloids from these sites is uncertain. Also shown are the location of major active copper mining and smelting operations (blue markers) (http://www.admmr.state.az. us/), and meteorological stations close to the IMPROVE sites (purple markers).
Southern Arizona is an ideal setting to study the pervasiveness of metals and metalloids in the atmosphere, especially in relation to transported fine soil, because of significant anthropogenic emissions from a rapidly growing population and high density of inactive and active mines and smelters (Figure 1). Numerous mines are close to the metropolitan areas of Tucson and Phoenix with populations of over one and four million (U.S. Census Bureau, 2009), respectively. Measurements in the vicinity of an active copper smelter and mine tailing near the town of Hayden, Arizona (85 km north of Tucson) have shown that soil dust particles acquire contaminants such as Pb and As by deposition of fine particles from the smelting operations (Csavina et al., 2011; Sorooshian et al., 2012). Anderson et al. (1988) conducted single particle measurements near the town of Chandler, Arizona (~30 km southeast of Phoenix) and also suggested that smelter particles can settle and contaminate local soil dust. Similar reasoning can explain enhanced levels of Pb, Cu, Zn and Cd (cadmium) in soils in Australia (Mount Isa, Queensland) near mining and smelting operations (Taylor et al., 2010; Mackay et al., 2013). Toxic levels of metals have also been observed near smelters in desert grassland (Dawson and Nash, 1980) and in waterways next to mine tailings (Gomez-Alvarez et al., 2009).
The goal of this study is to examine the spatiotemporal variations in particulate concentrations of metal and metalloid species across southern Arizona, with an emphasis on evaluating the potential role of fine soil in carrying harmful toxins stemming from anthropogenic activity. In a companion paper, Sorooshian et al. (2011) presented a decade-long (2000 – 2009) analysis of aerosol composition across southern Arizona focusing on major components (inorganics, carbonaceous components and fine soil). In the context of that work, metals and metalloids, including silicon (Si), aluminum (Al), iron (Fe), titanium (Ti), zinc (Zn), Pb, Cr, vanadium (V), selenium (Se), Ni, rubidium (Rb), Mn, strontium (Sr), copper (Cu) and As, accounted for approximately 5–20% of the PM2.5 mass concentration, which constitutes a sizeable component of the regional particles that warrants attention in the current study. This work aims to address the following questions: (i) which metal and metalloid contaminants have common sources in the region?; (ii) which sites have the highest airborne metal and metalloid concentrations in southern Arizona?; (iii) how have concentrations of these species changed in southern Arizona between 1988 and 2009?; and (iv) are metal and metalloid concentrations enhanced in the atmosphere during periods of high fine soil concentrations?
2. Materials and Methods
2.1 EPA IMPROVE
This study utilizes aerosol composition data from the Interagency Monitoring of Protected Visual Environments (IMPROVE) network (Malm et al., 1994; http://views.cira.colostate.edu/web/). IMPROVE aerosol monitoring stations are located primarily in National Parks and Wilderness Areas and collect ambient aerosol on filters over a period of 24 h every third day. Prior to 2000, sampling was conducted semiweekly, on Wednesday and Saturday. The change in sampling frequency in 2000 was argued to not have influenced trend analysis in previous work with the condition that Wednesday and Saturday are near the mass concentration mean of the weekly cycle of a particular aerosol constituent being examined (Murphy et. al., 2008, 2011); the same condition is leveraged in the current study for the specific species and sites examined in Section 3.3 (“Long-term Trend Analysis”). Samples are analyzed for ions, metals, organic carbon (OC) and elemental carbon (EC). Among the elemental measurements, x-ray fluorescence (XRF) is used for Fe and heavier elements while particle-induced x-ray emission (PIXE) is used for elements Na to Mn. Fine soil concentrations reported in this study are calculated using the following equation (Malm et al., 2004):
| (1) |
Species mass concentrations discussed in this study are from the fine fraction of aerosols (PM2.5). Sampling protocols and additional details are provided elsewhere (http://vista.cira.colostate.edu/improve/Publications/SOPs/UCDavis_SOPs/IMPROVE_SOPs.htm). This study uses data between 1988 and 2009 for seven ground stations in southern Arizona (Figure 1); data for Queen Valley/Phoenix, Saguaro West and Organ Pipe are only available since 2001, 2002 and 2003, respectively.
2.2 Meteorology
Meteorological data were obtained from three selected ground-based stations in the Arizona Meteorological Network (http://ag.arizona.edu/azmet /): Willcox, Tucson and Maricopa Figure 1). Monthly averages of ambient temperature, soil temperature (4.8 cm below surface), relative humidity (RH), maximum wind speed and precipitation are calculated for the period 2000 – 2009 (Figure S1 in Supplement).
2.3 Geographical Background, Site Descriptions, and Meteorology
Characteristic landscapes of southern Arizona are the Sonoran Desert in the west, and basin and range terrain (including the Chiricahua Mountains) in the east (Figure 1). The Phoenix IMPROVE site (33.5038° N, −112.0958° W; 338 m ASL) is located within the metropolitan area and is the most influenced by urban pollution. The two next-closest IMPROVE sites to Phoenix are the Tonto National Monument (33.6494° N, −111.1088° W; 786 m ASL), which is separated by a mountain range and approximately 90 km to the east/northeast, and Queen Valley (33.2939° N, −111.2857° W; 658 m ASL), which is ~60 km to the east (and ~45 km south of the Tonto site). The Saguaro National Monument (32.1742° N, −110.7372° W; 933 m ASL) and the Saguaro West sites (32.2486° N, −111.2178° W; 718 m ASL) are located in the eastern and western sections of Saguaro National Park, respectively, and are separated by the Tucson metropolitan area. The two sites are 50 km apart and influenced by the Tucson urban plume (Sorooshian et al., 2011). The Organ Pipe site (31.9506° N, −112.8016° W; 505 m ASL) is located in Organ Pipe Cactus National Monument just north of the U.S.-Mexico border. The distance to any urban center with more than 50,000 inhabitants is > 170 km. Similarly, Chiricahua National Monument 32.0089° N, −109.3891° W; 1570 m ASL) is a relatively remote site located in the Chiricahua Mountains. The nearest urban center is Tucson, approximately 150 km to the west. The nearest major potential aerosol sources are the Willcox Playa and the Apache Power Plant, which are ~45 km to the west.
Major active copper mining districts within the study area are located in and around Miami (~35 km southeast of Tonto), the Silverbell Mountains (~30 km west of Saguaro West), Ray (~32 km southeast of Queen Valley) and near Sahuarita and Green Valley (~35 km south of Saguaro West and the same distance southwest of Saguaro National Monument) (Figure 1). Farther away, major open pit mines are also located near Clifton/Morenci (120 km north of Chiricahua) and the Mexican towns of Cananea and Nacozari (140 km and 180 km south of Chiricahua, respectively). Tailings from inactive mines (underground mines and small open pit mines, with the last activity beyond a decade ago) are ubiquitous in the region (Figure 1). Active copper smelters are located in Hayden (~60 km to the southeast of Queen Valley), Miami, Nacozari and Cananea.
The climate in this region is arid with hot summers and mild winters (data shown in Supplement Figure S1). Temperatures reach their maximum and minimum values usually in July and December, respectively. The average wind speed is highest between April and July, with speeds during this time often exceeding the threshold (> 5 – 15 m s−1) needed for dust emissions from a variety of surface types (Leinen and Sarnthein, 1989). The seasonal cycle of precipitation is characterized by two modes: the first between November and March and the second during the summertime monsoon rainfall that typically occurs between July and September. Precipitation data reveal the overwhelming importance of these summer storms relative to all other months. Relative humidity similarly exhibits two modes: one in winter and another due to the arrival of monsoon moisture between July and September. Monthly trends in mixing layer heights for the three sites indicate that, on average, the mixing layer is highest between July and August (~1500 m AGL) and lowest in January (~300 – 400 m AGL). The boundary layer is deeper by a factor of three to five in the summer months as compared to winter months, which results in substantial dilution of aerosol species concentrations in the summer (Sorooshian et al., 2011).
3. Results and Discussion
3.1 Species Correlations
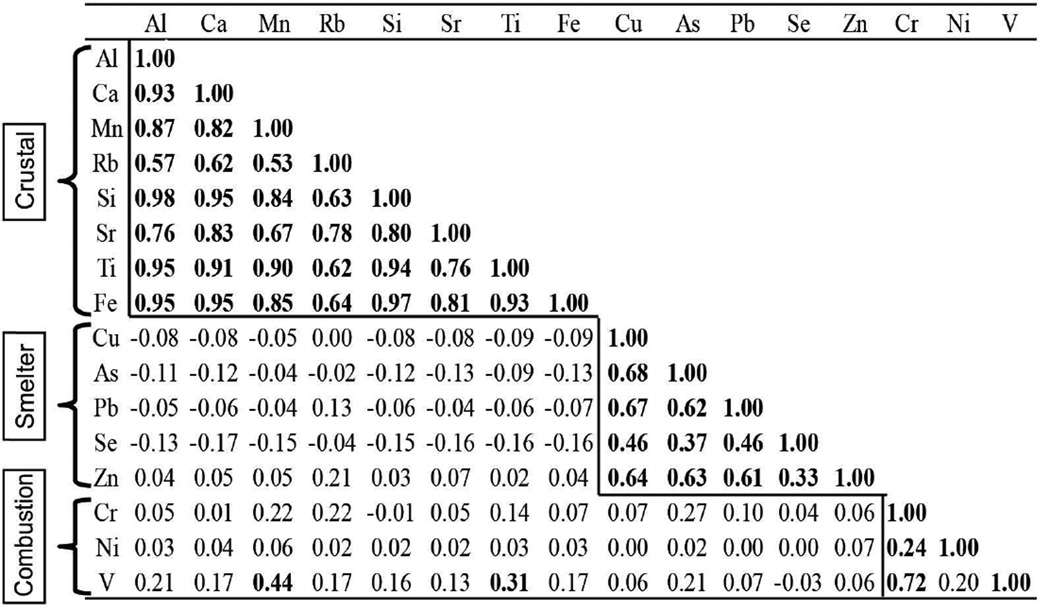
Pair-wise correlations between metals and metalloids were examined to identify their sources. Since most sites except Phoenix had similar correlation patterns, Table 1 reports a representative correlation matrix for one of these other sites, specifically Tonto (others in Tables S1–S5 in Supplement). In Tonto, three sub-groups of aerosol constituents emerge with statistical significance at the 95% confidence using a two-tailed Student’s t-Test. Aluminum, Ca, Fe, Mn, Rb, Si, Sr and Ti were found to be positively correlated suggesting a common source, specifically fine soil. Correlations among Al, Ca, Fe, Mn, Rb, Si, Sr and Ti have previously been attributed to crustal and soil origins in the Southwest (Moyers et al., 1977). Henceforth, these chemical species, which compose the major elements in soil and crustal rock (Seinfeld and Pandis, 2006), are referred to as ‘crustal’ tracers. Arsenic, Cu, Pb, Se and Zn comprise another major group of species suggestive of a common source. Moyers et al. (1977) showed previously that atmospheric Cu, Pb and Zn particles were correlated with each other in Tucson. These species are known to be associated with smelter emissions (Nriagu, 1989), which is likely to be a source in the study region due to the presence of smelting activity (Figure 1). Chromium, V and Ni compose another group that can be categorized as ‘combustion’ tracers as they are typically associated with fossil fuel combustion and oil industrial practices (Nriagu, 1989), which results in higher concentrations near urban centers (Malm and Sisler, 2000).
Table 1.
Mass concentration correlation matrix for Tonto National Monument, which is representative of all other southern Arizona IMPROVE sites except for Phoenix. The text box labels represent at least one major common source for sub-groups of metal and metalloid contaminants in the atmosphere. Correlation coefficients in bold are statistically significant at 95% confidence with a two-tailed Student’s t-Test.
 |
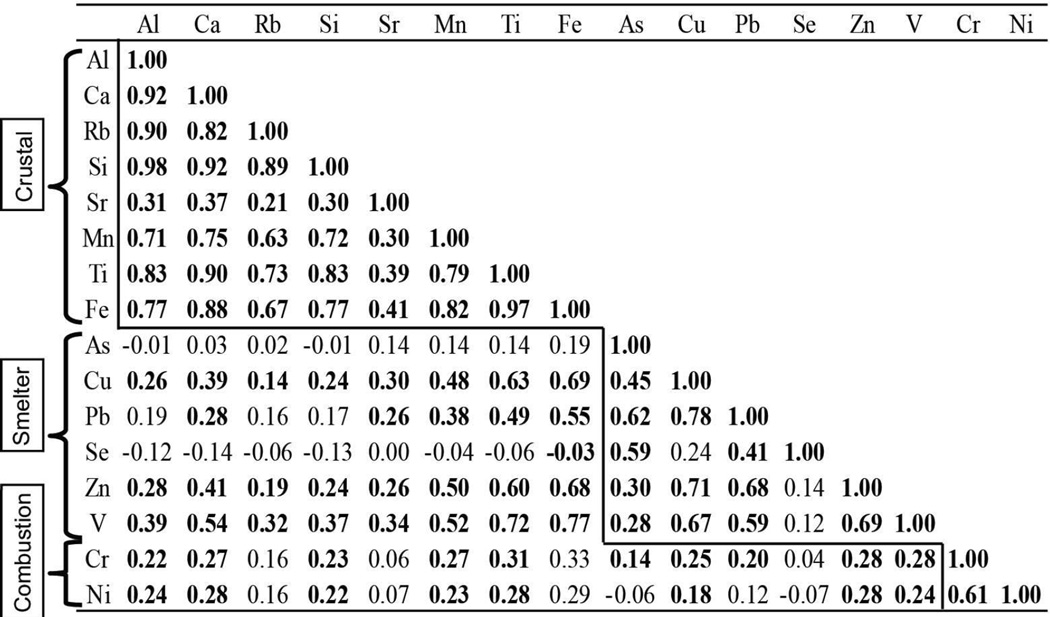
Phoenix exhibits slightly different inter-relationships between contaminants due most likely to it being the site with the largest urban influence (Table 2). Similar to the other sites, a group emerged with crustal tracers, including Al, Ca, Fe, Mn, Rb, Si, Sr and Ti. Arsenic, Cu, Pb, Se, V, and Zn form a second group of contaminants that nearly resembles the ‘smelter’ group in Tonto. Unlike Tonto, Fe, Ti and V are also positively correlated with the ‘smelter’ group species because they have common anthropogenic sources (smelter and vehicular emissions), emissions of which likely are more potent near Phoenix. Unlike Tonto, the third group only comprises Cr and Ni, while V is now correlated to ‘smelter’ group tracers. The names of the sub-groups (‘crustal’, ‘smelter’, ‘combustion’) do not preclude the possibility that other sources for these species exist. The groups of contaminants in this section will now be examined in more detail to determine how species mass concentrations vary according to location and seasonally-dependent parameters such as meteorology and mixing layer height.
Table 2.
Mass concentration correlation matrix for Phoenix. The text box labels represent at least one major common source for sub-groups of metal and metalloid contaminants in the atmosphere. Correlation coefficients in bold are statistically significant at 95% confidence with a two-tailed Student’s t-Test.
 |
3.2 Spatiotemporal Variation
The temporal and spatial variations in metals and metalloids were examined using monthly-averaged concentrations during four seasons: Summer (April to June, AMJ), Fall (October to November, ON), Monsoon (July to September, JAS) and Winter (December to March, DJFM). There are differences in the seasonal concentration cycles of As, Cu, Pb and Zn. Arsenic and Cu concentrations usually peak in winter months indicative of a combination of urban pollution being concentrated in a shallower mixing layer and more winter-driven emissions that contain these species (e.g., wood-burning; Nriagu et al., 1989). Lead and Zn exhibit some of these characteristics, but, depending on the site, their concentrations are also higher between March and May. The highest concentrations of several crustal species (Si, Fe, Al, Ti, Mn, Rb and Sr) occur during two major temporal modes each year: summer (April - June) and fall (October - November) (Figure 2).
FIG 2.

Monthly-averaged mass concentrations (1 = Jan; 12 = Dec) of PM2.5 constituents at seven sites in southern Arizona between 2000 – 2009 (note though that for Queen Valley/Phoenix, Saguaro West and Organ Pipe, data are only available since 2001, 2002 and 2003, respectively). “L” and “R” denote the left and right y-axis, respectively.
The spatial distributions of species in the region are different despite having similar sources. Based on IMPROVE data between 1995 – 1998, Malm and Sisler (2000) reported that the highest nationwide levels of As were measured at Chiricahua, while the highest Cu levels were observed at Tonto. The high As levels in Chiricahua were attributed to copper smelter emissions, mainly from the Cananea and Nacozari smelters in northern Mexico. In contrast to those earlier data, the highest Cu (and also Zn and Pb) levels in this study are found to be in Phoenix followed by Queen Valley and then Tonto (Figure 2). The source for these elements that impacts these sites is most likely copper smelters located to the east of these sites as also suggested by Anderson et al. (1988) for measurements they conducted near Phoenix. Tonto and Queen Valley have the highest concentrations of As due to close proximity to active mining and smelter operations, and independent in-situ measurements have confirmed that high concentrations of Pb and As are associated with emissions from mining and smelting operations in the nearby town of Hayden (Csavina et al., 2011). Phoenix has the highest concentrations of crustal species, followed by Saguaro West and Saguaro National Monument. The highest concentrations of V occur between June and August at all sites except in Phoenix, where V concentration peaks in winter likely due to increased anthropogenic emissions by the largest population center in the study region. It is uncertain as to what explains the unique annual cycle of V as it is most abundant during the monsoon with the heaviest rainfall and highest moisture levels. Principal Component Analysis (PCA) was also used to examine the spatial distribution of the metals and metalloids during each of the four seasons. However, the eigen values obtained were not statistically significant due to the high correlation among the species. Therefore, the discussion of the PCA has been included in the Supplement; those results are in general agreement with conclusions drawn from Figure 2.
Concentrations of all metals and metalloids were plotted as a function of the day of week to further investigate the influence of anthropogenic activities that typically follow a weekly cycle. Previous work has shown that the regional average concentrations of crustal species like Si, Ca, Ti and Fe in Arizona exhibit a distinct weekly cycle with a maximum on Thursday and a minimum on Sunday (Murphy et al., 2008); weekend effects of this nature have been documented in other arid and semi-arid regions such as in India (Kulshrestha et al., 2009) and Iran (Crosbie et al., 2014). Figure 3a shows that this weekly variation in Si concentration holds for each of the seven sites in this study. Additionally, the increase from Sunday to Thursday is the greatest at urban sites, specifically Phoenix (82%) and Saguaro West (77%), and the least at remote sites, especially Chiricahua (23%). Other crustal elements like Rb (which has no other known anthropogenic source, Figure 3b), Al, Fe, Ti, Mn and Sr also follow the same weekly pattern further confirming that this weekly pattern is a consequence of anthropogenic activities (e.g., vehicular traffic, construction) that are enhanced near urban sites (Garg et al., 2000; Rauch et al., 2000). For example, Ti and Fe are known to be associated with tailpipe emissions and the wearing of tires, brakes, and engines (Lough et al., 2005). In addition, urban road dust, which is a major source of aerosol in Phoenix, specifically has been shown to be more enriched in Fe and Ti as compared to rural road dust (Apeagyei et al., 2011). Manganese has anthropogenic sources such as coal/oil combustion and vehicular emissions (Samara and Voutsa, 2005). Similar to Si, weekly cycles of all the other crustal species also have the largest variation from Sunday to Thursday in Phoenix and Saguaro West. However, other non-crustal elements, like Pb, As, Cu, Zn, Se, V and Ni, exhibit a different weekly cycle at each site (see Pb and As in Figures 3c–d), suggestive of controlling factors that do not follow the typical work week.
FIG 3.

Weekly cycles of (a) silicon, (b) rubidium, (c) lead and (d) arsenic at the seven IMPROVE sites in southern Arizona. The y-axis in each of the figures is the mass concentration at each site normalized by the mean concentration of the given element measured at the respective site during the period between 2000 and 2009 (note though that for Queen Valley/Phoenix, Saguaro West and Organ Pipe, data are only available since 2001, 2002 and 2003, respectively). C – Chiricahua; P – Phoenix; OP – Organ Pipe; T – Tonto; QV – Queen Valley; SW – Saguaro West; SNM – Saguaro National Monument. Other crustal species like Al, Fe, Ti, Mn and Sr also follow the same weekly cycle as Si and Rb; non-crustal species, similar to Pb and As, do not have a distinct weekly cycle in the region.
3.3 Long-term Trend Analysis
Long-term seasonal trends (AMJ, JAS, ON, DJFM) are examined for the IMPROVE stations in the study region over their entire periods of data availability (Chiricahua, Tonto and Phoenix in Table 3; other sites shown in Table S8 of Supplement). An analogous analysis for the major inorganic and carbonaceous components showed long-term reductions in sulfate, elemental carbon and organic carbon, attributable to the closure of regional copper smelters and other implemented source controls for pollutants such as SO2 (Matichuk et al., 2006; Sorooshian et al., 2011). This study shows that Chiricahua and Tonto have experienced statistically significant reductions in As during all seasons since 1988 (seasonal range: 0.18 – 0.33 ng m−3 y−1 and 0.03 – 0.10 ng m−3 y−1, respectively). Statistically significant reductions in As also occurred at the other sites (except Phoenix) depending on the season (0.01 – 0.23 ng m−3 y−1). While Se levels have decreased at every site regardless of the season, Pb and Cu showed both reductions and increases depending on site and season, but with more consistent reductions at Tonto, Chiricahua, and Saguaro National Monument. Iron levels increased in Queen Valley (6.24 ng m−3 y−1 in ON), Organ Pipe (6.36 ng m−3 y−1 in ON) and Saguaro National Monument (1.17 – 3.36 ng m−3 y−1 across all seasons), but decreased at Phoenix and Saguaro West during JAS (8.89 and 16.81 ng m−3 y−1, respectively). The reductions in As, Cu, Pb and Se are at least partly due to source controls noted above.
Table 3.
Linear regression trends (slope units are ng m−3 year−1) for selected 608 IMPROVE stations as a function of season (other station data are shown in Table S8 of Supplement). Data availability: Chiricahua National Monument: 1988 – 2009, Tonto National Monument: 1988 – 2009, Phoenix: 2001 – 2009. Correlations that are statistically significant at 95% confidence with a two-tailed Student’s t-Test are in bold. Blank values indicate insufficient data availability.
| Chiricahua | |||||||
| Monsoon (JAS) | Fall (ON) | Winter (DJFM) | Summer (AMJ) | ||||
| Slope | r2 | Slope | r2 | Slope | r2 | Slope | r2 |
| As: −0.18 | 0.52 | −0.27 | 0.29 | −0.33 | 0.47 | −0.18 | 0.63 |
| Cu: 0.20 | 0.03 | −0.17 | 0.50 | −0.15 | 0.54 | −0.12 | 0.63 |
| Fe: 1.11 | 0.22 | 56.10 | 0.04 | 0.97 | 0.22 | 1.25 | 0.07 |
| Pb: −0.16 | 0.52 | −0.23 | 0.62 | −0.14 | 0.65 | −0.10 | 0.57 |
| Se: 0.81 | 0.08 | −0.02 | 0.47 | −12.90 | 0.50 | −0.01 | 0.48 |
| Tonto | |||||||
| Monsoon (JAS) | Fall (ON) | Winter (DJFM) | Summer (AMJ) | ||||
| Slope | r2 | Slope | r2 | Slope | r2 | Slope | r2 |
| As: −0.07 | 0.54 | −0.07 | 0.30 | −0.10 | 0.62 | −0.03 | 0.78 |
| Cu: −0.12 | 0.58 | −0.12 | 0.19 | −0.17 | 0.44 | −0.04 | 0.23 |
| Fe: 1.03 | 0.15 | 0.64 | 0.05 | 1.33 | 0.33 | 2.18 | 0.14 |
| Pb: −0.24 | 0.60 | −0.15 | 0.26 | −0.18 | 0.42 | −0.08 | 0.32 |
| Se: −0.01 | 0.46 | −0.01 | 0.12 | 0.00 | 0.06 | −0.01 | 0.42 |
| Phoenix | |||||||
| Monsoon (JAS) | Fall (ON) | Winter (DJFM) | Summer (AMJ) | ||||
| Slope | r2 | Slope | r2 | Slope | r2 | Slope | r2 |
| As: −0.02 | 0.22 | 0.02 | 0.10 | −0.03 | 0.21 | −0.01 | 0.22 |
| Cu: 0.10 | 0.19 | -- | -- | 0.35 | 0.07 | 0.22 | 0.33 |
| Fe: −8.89 | 0. 33 | -- | -- | −8.52 | 0.04 | −2.32 | 0.02 |
| Pb: −0.01 | 0.05 | -- | -- | −0.14 | 0.25 | −0.04 | 0.09 |
| Se: −0.01 | 0.58 | -- | -- | −0.03 | 0.39 | −0.02 | 0.52 |
3.4 Metal and Metalloid Behavior during Periods of Increased Fine Soil Concentrations
Dust particles have been shown to be effective transportation vehicles for contaminants from industrial activities in the region (Csavina et al., 2011). Owing to the high density of mining and smelting operations in the region, it is hypothesized that metals and metalloids commonly associated with these activities (Cu, Zn, As and Pb) increase in concentration simultaneous with fine soil. We provide a characterization of metal and metalloid concentrations during ‘dust events’, which are defined here as being when the fine soil concentration during a day is at least twice that of the preceding measurement from three days before. The average number of ‘dust events’ that occur in a year for the various sites ranges between 3 – 7.3 per year (Table 4). The frequency of such events is highest in Organ Pipe (7.3) and the lowest in Queen Valley (3). Metal and metalloid enhancement is quantified as the ratio of a concentration during a ‘dust event’ day to the average concentration during the adjacent measurement periods (i.e., average of two data points where one is from three days before and the other three days after). Most of these events are accompanied by an enhancement of metal and metalloid concentrations. Four of the most toxic and abundantly found metals/metalloids in the region are Pb, As, Cu and Zn. More than 50% of the events were characterized by an enhancement in the concentration of at least one of these four contaminants. Sites with more urban influence (Phoenix, Saguaro National Monument and Saguaro West) exhibit significantly higher frequencies of ‘dust events’ with enhanced metal/metalloid levels than the other sites. Zinc was enhanced most frequently (41% – 81% of the total events) along with fine soil, while As was the least frequently enhanced contaminant (10% – 27% of the total events; Table 4).
Table 4.
‘Dust event’ frequency for each site computed over their entire measurement period, the fraction of those cases which were accompanied by enhancement of at least one of the four metal/metalloids shown (Pb, As, Cu and Zn), and the fraction of events that exhibited an increase in the concentration of each specific metal/metalloid.
| Site | Dust event' frequency (per year) |
Fraction of cases with metal/metalloid enhancement |
Pb (%) |
As (%) |
Cu (%) |
Cu (%) |
|---|---|---|---|---|---|---|
| Chiricahua | 7 | 63% | 42 | 21 | 37 | 49 |
| Organ Pipe | 7.3 | 78% | 49 | 10 | 55 | 63 |
| Queen Valley | 3 | 55% | 35 | 27 | 41 | 41 |
| Tonto | 6.4 | 64% | 43 | 15 | 38 | 59 |
| Saguaro West | 7.1 | 89% | 56 | 16 | 63 | 81 |
| Saguaro NM | 4 | 82% | 52 | 18 | 54 | 73 |
| Phoenix | 6.8 | 88% | 70 | 21 | 68 | 78 |
Thirty six hour back-trajectories with an ending altitude of 10 m above ground level were computed with the NOAA HYSPLIT model (Draxler and Rolph, 2012) for these events at each site. The direction for each trajectory was obtained by dividing the region into four equal sectors to investigate the relationship between air mass source origin and the increase of contaminant concentrations during such events. For every site, the majority (45 to 50%) of the ‘dust events’ coincided with air masses approaching from the west; however, the enhancement of contaminants during the events is unrelated to the direction of where air masses came from.
4. Conclusions
This study has examined the spatial and temporal concentration trends in airborne particulate metals and metalloids for seven IMPROVE sites in southern Arizona. The results of the study, following the order of questions posed in Section 1, are summarized below.
Three major sub-groups of atmospheric metals and metalloids with positively correlated mass concentrations exist with at least one major common source for each group being crustal matter (e.g., Al, Ca, Fe, Mn, Rb, Si, Sr, Ti), smelting (e.g., As, Cu, Pb, Se, Zn) and combustion (e.g., Cr, Ni). Crustal species in the region are most abundant in the summer (AMJ), as a result of dry meteorological conditions which favor dust emissions, and also between October and November most likely due to meteorology and anthropogenic sources of dust such as roadways and construction. These species follow a distinct weekly cycle with a minimum concentration on Sunday and a maximum on Thursday, with the largest cycle amplitudes at urban sites with the most anthropogenic activity (i.e., Phoenix and Tucson). Some components of natural dust diverge in their seasonal concentration profiles owing to inputs from anthropogenic sources (Fe, Ti, Cr, Pb, Mn and Ni).
Phoenix has the highest concentrations of crustal species, followed by Saguaro West and Saguaro National Monument. The highest concentrations of As are observed at Tonto and Queen Valley, while the highest Cu, Zn and Pb levels are found in Phoenix and followed by Queen Valley.
Reductions in As and Se levels were identified across the study region, with general reductions also evident for Cu and Pb for most sites and seasons. These results indicate that source controls such as with the closure of regional smelters have been effective, but that active mining/smelter operations and other emissions promoted by a growing population continue to have an impact across the region.
Periods of high fine soil concentration in the region are often accompanied by the enhancement of concentrations of metals and metalloids, especially at urban sites (Phoenix and Tucson). The enhancement of these species during high fine soil concentration periods is found to be unrelated to the trajectory of transported air in the preceding 36 h.
The results of this work indicate that Arizona represents a region vulnerable to the impacts of airborne metals and metalloids as a result of the abundance of dust aerosol and anthropogenic emissions. The ubiquity of metal and metalloid contaminants in the region is not just a local issue as the particles enriched with these contaminants can undergo long-range transport and potentially participate in cloud drop formation, thereby influencing distant regions via deposition.
Supplementary Material
Highlights.
Spatiotemporal analysis of PM2.5 elemental composition in southern Arizona
Concentrations of crustal elements exhibit a distinct day-of-week pattern
There have been significant reductions in toxic species concentrations since 1988
Toxic element concentrations are enhanced during ‘dust events’ in urban areas
Phoenix has the highest concentrations of airborne Cu, Zn, and crustal elements
Acknowledgements
This research was supported in part by Grant 2 P42 ES04940-11 from the National Institute of Environmental Health Sciences (NIEHS) Superfund Research Program, NIH and the Center for Environmentally Sustainable Mining through the TRIF Water Sustainability Program at the University of Arizona. The authors gratefully acknowledge the sponsors of the IMPROVE network and the NOAA Air Resources Laboratory (ARL) for provision of the HYSPLIT transport and dispersion model.
Footnotes
Publisher's Disclaimer: This is a PDF file of an unedited manuscript that has been accepted for publication. As a service to our customers we are providing this early version of the manuscript. The manuscript will undergo copyediting, typesetting, and review of the resulting proof before it is published in its final citable form. Please note that during the production process errors may be discovered which could affect the content, and all legal disclaimers that apply to the journal pertain.
References
- Alloway BJ. In: The origins of heavy metals in soils. Alloway BJ, editor. New York: Heavy Metals in Soils, Blackie Academic and Professional Publ.; 1995. [Google Scholar]
- Anderson JR, Aggett FJ, Buseck PR, Germani MS, Shattuck TW. Chemistry of individual aerosol-particles from Chandler, Arizona, an arid urban-environment. Environ. Sci. Technol. 1988;22:811–818. doi: 10.1021/es00172a011. [DOI] [PubMed] [Google Scholar]
- Apeagyei E, Bank MS, Spengler JD. Distribution of heavy metals in road dust along an urban-rural gradient in Massachusetts. Atmos. Environ. 2011;45:2310–2323. [Google Scholar]
- Barbaris B, Betterton EA. Initial snow chemistry of the Mogollon Rim in Arizona. Atmos. Environ. 1996;30(17):3093–3103. [Google Scholar]
- Boulet MP, Larocque ACL. A comparative mineralogical and geochemical study of sulfide mine tailings at two sites in New Mexico, USA. Environ. Geol. 1998;33(2–):130–142. [Google Scholar]
- Cheng M-C, You C-F, Lin F–J, Huang K–F, Chung C–H. Sources of, Cu, Zn, Cd and Pb in rainwater at a subtropical islet offshore northern Taiwan. Atmos. Environ. 2011 [Google Scholar]
- Crosbie E, Sorooshian A, Monfared NA, Shingler T, Esmaili O. A multi-year aerosol characterization for the greater Tehran area using satellite, surface, and modeling data. Atmosphere. 2014;5(2):178–197. doi: 10.3390/atmos5020178. [DOI] [PMC free article] [PubMed] [Google Scholar]
- Csavina J, Landazuri A, Wonaschutz A, Rine K, Rheinheimer P, Barbaris B, Conant W, Saez AE, Betterton EA. Metal and metalloid contaminants in atmospheric aerosols from mining operations. Water Air Soil Pollut. 2011;221(1–4):145–157. doi: 10.1007/s11270-011-0777-x. [DOI] [PMC free article] [PubMed] [Google Scholar]
- Csavina J, Field J, Taylor MP, Gao S, Landazuri A, Betterton EA, Saez AE. A review on the importance of metals and metalloids in atmospheric dust and aerosol from mining operations. Sci. Total Environ. 2012;433:58–73. doi: 10.1016/j.scitotenv.2012.06.013. [DOI] [PMC free article] [PubMed] [Google Scholar]
- Dawson JL, Nash TH. Effects of air pollution from copper smelters on a desert grassland community. Environ. and Experimental Botany. 1980;20(1):61–72. [Google Scholar]
- Draxler RR, Rolph GD. HYSPLIT – Hybrid Single Particle Lagrangian Integrated Trajectory Model. USA: NOAA Air Resources Laboratory, Silver Spring; 2012. Available at http://ready.arl. noaa.gov/HYSPLIT.php. [Google Scholar]
- Ettler V, Konecny L, Kovarova L, Mihaljevic M, Sebek O, Kribek B, Majer V, Veselovsky F, Penizek V, Vanek A, Nyambe I. Surprisingly contrasting metal distribution and fractionation patterns in copper smelter-affected tropical soils in forested and grassland areas (Mufulrina, Zambian Copperbelt) Sci. Total Environ. 2014;473:117–124. doi: 10.1016/j.scitotenv.2013.11.146. [DOI] [PubMed] [Google Scholar]
- Galloway JN, Thornton JD, Norton SA, Volchok HL, McLean RAN. Trace metals in atmospheric deposition: A review and assessment. Atmos. Environ. 1982;16:1677–1700. [Google Scholar]
- Garg BD, Cadle SH, Mulawa PA, Groblicki PJ, Laroo C, Parr GA. Brake wear particulate matter emissions. Environ. Sci. Technol. 2000;34:4463. doi: 10.1021/es0010554. [DOI] [PubMed] [Google Scholar]
- Gomez-Alvarez A, Meza-Figueroa D, Villalba-Atondo AI, Valenzuela-Garcia JL, Ramirez-Hernandez J, Almendariz-Tapia J. Estimation of potential pollution from mine tailings in the San Pedro River (1993–2005), Mexico-US border. Environ. Geol. 2009;57(7):1469–1479. [Google Scholar]
- Johnson MS, Cooke JA, Stevenson JKW. Revegetation of metalliferous wastes and land after metal mining. In: Hester RE, Harrison RM, editors. Mining and Its Environmental Impact. Royal Society of Chemistry; 1994. p. 164. [Google Scholar]
- Kelly J, Thornton I, Simpson PR. Urban geochemistry: a study of influence of anthropogenic activity on heavy metal content of soils in traditionally industrial and nonindustrial areas of Britain. Appl. Geochem. 1996;11:363–370. [Google Scholar]
- Kulshrestha A, Satsangi PG, Masih J, Taneja A. Metal concentration of PM2.5 and PM10 particles and seasonal variations in urban and rural environment of Agra, India. Sci. Tot. Environ. 2009;407:6196–6204. doi: 10.1016/j.scitotenv.2009.08.050. [DOI] [PubMed] [Google Scholar]
- Leinen M, Sarnthein M. Paleoclimatology and Paleometeorology: Modern and Past Patterns of Global Atmospheric Transport. Kluwer, Dordrencht, Netherlands. 1989 [Google Scholar]
- Lough GC, Schauer JJ, Park JS, Shafer MM, Deminter JT, Weinstein JP. Emissions of metals associated with motor vehicle roadways. Environ. Sci. Technol. 2005;39(3):826–836. doi: 10.1021/es048715f. [DOI] [PubMed] [Google Scholar]
- Mackay AK, Taylor MP, Munksgaard NC, Hudson-Edwards KA, Burn-Nunes L. Identification of environmental lead sources and pathways in a mining and smelting town: Mount Isa, Australia. Environ. Pollution. 2013;180:304–311. doi: 10.1016/j.envpol.2013.05.007. [DOI] [PubMed] [Google Scholar]
- Malm WC, Sisler JF, Huffman D, Eldred RA, Cahill TA. Spatial and seasonal trends in particle concentration and optical extinction in the United States. J. Geophys. Res. 1994;99(D1):1347–1370. [Google Scholar]
- Malm WC, Sisler JF. Spatial patterns of major aerosol species and selected heavy metals in the United States. Fuel Process Technol. 2000;65:473–501. [Google Scholar]
- Malm WC, Schichtel BA, Pitchford ML, Ashbaugh LL, Eldred RA. Spatial and monthly trends in speciated fine particle concentration in the United States. J. Geophys. Res. 2004;109:D03306. [Google Scholar]
- Matichuk R, Barbaris B, Betterton EA, Hori M, Murao N, Ohta S, Ward D. A decade of aerosol and gas precursor chemical characterization at Mt. Lemmon, Arizona (1992 to 2002) J. Meteorol. Soc. Jpn. 2006;84:653–670. [Google Scholar]
- Mendez MO, Maier RM. Phytostabilization of mine tailings in arid and semiarid environments—an emerging remediation technology. Environ. Health Perspect. 2008;116(3):278–283. doi: 10.1289/ehp.10608. [DOI] [PMC free article] [PubMed] [Google Scholar]
- Moreno T, Oldroyd A, McDonald I, Gibbons W. Preferential fractionation of trace metals–metalloids into PM10 resuspended from contaminated gold mine tailings at Rodalquilar, Spain. Water Air Soil Pollut. 2007;179(1–4):93–105. [Google Scholar]
- Moyers JL, Ranweiler LE, Hopf SB, Korte NE. Evaluation of particulate trace species in southwest desert atmosphere. Environ. Sci. Technol. 1977;11(8):789–795. [Google Scholar]
- Murphy DM, Capps SL, Daniel JS, Frost GJ, White WH. Weekly patterns of aerosol in the United States. Atmos. Chem. Phys. 2008;8:2729–2739. [Google Scholar]
- Murphy DM, Chow JC, Leibensperger EM, Malm WC, Pitchford M, Schichtel BA, Watson JG, White WH. Decreases in elemental carbon and fine particle mass in the United States. Atmos. Chem. Phys. 2011;11:4679–4686. [Google Scholar]
- Navarro MC, Perez-Sirvent C, Martinez-Sanchez MJ, Vidal J, Tovar PJ, Bech J. Abandoned mine sites as a source of contamination by heavy metals: a case study in a semi-arid zone. J. Geochem. Explor. 2008;96:183–193. [Google Scholar]
- Nriagu JO. A global assessment of natural sources of atmospheric trace metals. Nature. 1989;338:47–49. [Google Scholar]
- Park SS, Wexler AS. Size-dependent deposition of particles in the human lung at steady-state breathing. Aerosol Sci. 2008;39:266–276. [Google Scholar]
- Rauch S, Morrison GM, Motelica-Heino M, Donard OFX, Muris M. Elemental association and fingerprinting of traffic related metals in road sediments. Environ. Sci. Technol. 2000;34:3119. [Google Scholar]
- Reheis MC, Budahn JR, Lamothe PJ, Reynolds RL. Compositions of modern dust and surface sediments in the Desert Southwest, United States. J. Geophys. Res. 2009;114:F01028. [Google Scholar]
- Samara C, Voutsa D. Size distribution of airborne particulate matter and associated heavy metals in the roadside environment. Chemosphere. 2005;59:1197–1206. doi: 10.1016/j.chemosphere.2004.11.061. [DOI] [PubMed] [Google Scholar]
- Schauer JJ, Lough GC, Shafer MM, Christensen WF, Arndt MF, DeMinter JT, Park JS. Characterization of metals emitted from motor vehicles. Health Effect Institute. 2006;133:1–88. [PubMed] [Google Scholar]
- Seinfeld J, Pandis S. Atmospheric Chemistry and Physics. 2nd Ed. New York, NY, USA: Wiley-Interscience; 2006. [Google Scholar]
- Sorooshian A, Wonaschütz A, Jarjour EG, Hashimoto BI, Schichtel BA, Betterton EA. An aerosol climatology for a rapidly growing arid region (southern Arizona): Major aerosol species and remotely sensed aerosol properties. J. Geophys. Res. 2011;116:D19205. doi: 10.1029/2011JD016197. [DOI] [PMC free article] [PubMed] [Google Scholar]
- Sorooshian A, Csavina J, Shingler TS, Dey Brechtel FJ, Sáez AE, Betterton EA. Hygroscopic and chemical properties of aerosols collected near a copper smelter: implication for public and environmental health. Environ. Sci. Technol. 2012;46:9473–9480. doi: 10.1021/es302275k. [DOI] [PMC free article] [PubMed] [Google Scholar]
- Sorooshian A, Shingler T, Harpold A, Feagles CW, Meixner T, Brooks PD. Aerosol and precipitation chemistry in the southwestern United States: spatiotemporal trends and interrelationships. Atmos. Chem. Phys. 2013;13:7361–7379. doi: 10.5194/acp-13-7361-2013. [DOI] [PMC free article] [PubMed] [Google Scholar]
- Taylor MP, Mackay AK, Hudson-Edwards KA, Holz E. Soil Cd, Cu, Pb and Zn contaminants around Mount Isa city, Queensland, Australia: Potential sources and risks to human health. Appl. Geochem. 2010;25:841–855. [Google Scholar]
- Thornton I. In: Metal contamination of soils in urban areas. Bullock P, Gregory PJ, editors. Blackwell: Soils in the Urban Environment; 1991. pp. 47–75. [Google Scholar]
- U.S. Census Bureau. 2009 (Available at http://www.census.gov/newsroom/releases/archives/population/cb10-90.html) [Google Scholar]
Associated Data
This section collects any data citations, data availability statements, or supplementary materials included in this article.