Abstract
Angiopoietin-like 2 (ANGPTL2) has been reported to induce sprouting angiogenesis; however, its role in vasculogenesis, the de novo lumenization of endothelial cells (EC), remains unexplored. We sought to investigate the potential role of ANGPTL2 in regulating human cord blood derived endothelial colony forming cell (ECFC) vasculogenesis through siRNA mediated inhibition of ANGPTL2 gene expression. We found that ECFCs in which ANGPTL2 was diminished displayed a 3-fold decrease in in vitro lumenal area whereas addition of exogenous ANGPTL2 protein domains to ECFCs lead to increased lumen formation within a 3 dimensional collagen assay of vasculogenesis. ECFC migration was attenuated by 36% via ANGPTL2 knockdown (KD) although proliferation and apoptosis were not affected. We subsequently found that JNK, but not ERK1/2, phosphorylation was decreased upon ANGPTL2 KD, and expression of MT1-MMP, known to be regulated by JNK and a critical regulator of EC migration and 3D lumen formation, was decreased in lumenized structures in vitro derived from ANGPTL2 silenced ECFCs. Treatment of ECFCs in 3D collagen matrices with either a JNK inhibitor or exogenous rhTIMP-3 (an inhibitor of MT1-MMP activity) resulted in a similar phenotype of decreased vascular lumen formation as observed with ANGPTL2 KD, whereas stimulation of JNK activity increased vasculogenesis. Based on gene silencing, pharmacologic, cellular, and biochemical approaches, we conclude that ANGPTL2 positively regulates ECFC vascular lumen formation likely through its effects on migration and in part by activating JNK and increasing MT1-MMP expression.
Keywords: ANGPTL2, vasculogenesis, ECFC, MT1-MMP
INTRODUCTION
The two major modes of blood vessel formation are angiogenesis, the formation of new lumenal structures from preexisting vessels, and vasculogenesis, the de novo formation of vascular structures through angioblast vacuolization and lumenization [1]. Vasculogenesis occurs during development as endothelial precursors establish the primitive vascular plexus and also postnatally from differentiation of circulating endothelial colony forming cells (ECFC) [2, 3]. Derived from circulating mononuclear cells, ECFCs possess clonal proliferative potential and the ability to form vessels in vivo by inosculating to the host vasculature [4–6]. To date many genes have been established as regulators of angiogenesis and vasculogenesis including the critical vascular endothelial growth factor (VEGF) and angiopoietin families [7, 8]. More recently, a new family of genes, structurally similar to the angiopoietins, has been discovered and was later designated the angiopoietin-like (ANGPTL) gene family [9].
There are seven members in the ANGPTL family, and like the angiopoietins they possess the characteristic C-terminal fibrinogen-like domain (FLD) and N-terminal coiled-coil domain (CCD); however, unlike the angiopoietins, they do not bind the Tie1 or Tie2 receptors [9]. They have pleiotropic effects in vascular and nonvascular cell types capable of regulating angiogenesis and various aspects of metabolism possibly through separate domains [10]. Angiopoietin-like 2 (ANGPTL2) was originally cloned in 1999 by Kim et al [11] and until recently was considered an orphan ligand [12, 13]. Kim et al [11] found that ANGPTL2 mRNA levels are highest in blood vessels and skeletal muscle in rat embryos but highest in heart, small intestine, spleen, and stomach tissue in adult humans, suggesting a special role may exist for ANGPTL2 in the developing vasculature. In addition, they found [11] that exogenous addition of recombinant human ANGPTL2 induces sprouting of porcine pulmonary arterial endothelial cells (PPAECs) in vitro. An increase in blood vessel formation also has been reported in the skin of transgenic mice that express ANGPTL2 under the control of a keratinocyte-specific promoter K14 [9]. However, whether ANGPTL2 was operating through angiogenesis or vasculogenesis was not examined. That ANGPTL2 has been shown to suppress endothelial barrier leakiness [9], a hallmark of angiogenesis, suggests the latter is a possibility.
To investigate the potential role of ANGPTL2 in ECFC vasculogenesis, we used siRNA to knockdown (KD) expression of ANGPTL2 in human cord blood derived ECFCs and evaluated the treated cells ability to form vacuoles and lumens in a three-dimensional (3D) matrix of pig skin oligomeric collagen (PSC) over 48 hours. This system allows visualization of the initial steps of vessel formation, which occurs as ECs form vacuoles that coalesce to form multicellular lumenized vascular structures [14]. We also evaluated the effects of ANGPTL2 KD on other classic angiogenic and vasculogenic cell behaviors including sprouting, migration, proliferation, and apoptosis. Since JNK activity and MT1-MMP expression are known to regulate EC migration and vasculogenesis in 3D collagen gels [15–26], JNK phosphorylation and MT1-MMP mRNA expression were investigated to gain further insight into the mechanism of ANGPTL2 function in the human ECFCs.
METHODS
Cell culture and transfection
ECFCs were isolated from human umbilical cord blood as previously described [4]. Briefly, cord blood (20–100 mL) was collected in heparin-coated syringes from healthy newborn infants (38–40 weeks gestation). Blood was diluted 1:1 with Dulbecco’s Phosphate Buffered Saline (DPBS) (Invitrogen) and overlaid onto Ficoll-Paque PLUS (GE). Cells were centrifuged at room temperature at 740×g for 30 minutes. Buffy coat mononuclear cells (MNCs) were collected and washed 3 times in complete Endothelial Growth Medium-2 (EGM-2), which is Endothelial Basal Medium-2 (EBM-2) (Lonza) with additives (Bullet Kit) provided by the manufacturer supplemented with 10% fetal-bovine serum (FBS; Hyclone), 2% penicillin/streptomycin (Invitrogen), and 0.25 μg/mL amphotericin B (Invitrogen). Cells were seeded onto tissue culture plates pre-coated with type-1 rat-tail collagen (BD Biosciences) at 37°C, 5% CO2, in a humidified incubator. Medium was changed daily for 7 days and then every other day until first passaging. ECFC colonies appeared between 5 and 22 days of culture and were identified as monolayers of cobblestone-appearing cells and confirmed as previously described [4]. ECFC were released from the primary culture dish by TrypLE™ Express (Gibco) and replated onto tissue culture flasks pre-coated with Type I rat-tail collagen. Cells were expanded, and all experiments were carried out between passages 3 and 6.
Transfection of ECFCs with ANGPTL2 and negative control small interfering RNA (siRNA) was carried out with Lipofectamine RNAiMAX (Invitrogen) according to the manufacturer’s recommendations with minimal modification. Briefly, ECFCs were plated at 104 cells/cm2 on collagen coated flasks the day before transfection in antibiotic free media (EGM-2, bullet kit, and 10% FBS). Flasks were visually inspected the next day to verify ECFCs were between 30 and 50% confluency before the addition of the Lipofectamine/siRNA complex. Three unique ANGPTL2 siRNA oligonucleotides (Invitrogen) were evaluated for maximum suppression of ANGPTL2 mRNA expression using qRT-PCR. All three were equally effective in comparison to universal medium GC content negative control siRNA (Invitrogen). The following siRNA sequence was used for all experiments: sense, 5-GGCAAUGCGGGUGACUCCUUUACAU-3; antisense, 5-AUGUAAAGGAGUCACCCGCAUUGCC-3. All experiments were carried out after overnight transfection with a final siRNA concentration of 10 nM.
Vasculogenesis Assay
Type I pig skin oligomeric collagen (PSC) and necessary reagents (HCl, PBS, NaOH, and CaCl2) were generated and prepared as previously described [14]. PBS was supplemented with rhSDF1-α, rhIL3, and rhSCF (R&D Systems) such that the final concentration in each matrix was 200 ng/mL as previously described [27]. Collagen-cell suspensions (2E3 cells/μL at 100 Pa) were kept at 4°C during mixing, pipetted into wells of a 96-well plate (58 μL/well), and allowed to polymerize for 30 min at 37°C, 5% CO2, in a humidified incubator. Matrix-cell constructs were incubated for 2 days with media changed after 24 hrs. Media consisted of EBM-2 supplemented with human fibroblast growth factor-basic (rhFGFb, Gibco) at 40 ng/mL and reduced-serum II supplement (RSII) prepared as previously described [28]. Constructs were fixed in 4% formaldehyde and stained with 0.1% toluidine blue in 30% methanol. Quantification was performed on brightfield images representing the central 9 fields of similar z-planes using a z-stack acquisition mode in each well of three wells per group. MetaMorph imaging software (Molecular Devices) was used to trace vacuoles and lumens and measure area. For experiments with JNK inhibition, ECFCs were pretreated in 2D for 4 hours prior to the vasculogenesis assay with JNK inhibitor SP600125 at 20 μM and the same concentration was used in the media for the 2 day assay. For exogenous supplementation with tissue inhibitor of matrix metalloproteinase-3 (TIMP-3) and ANGPTL2 protein, rhTIMP-3 (R&D Systems) and rhANGPTL2-FLD (fibrinogen like domain) or rhANGPTL2-CCD (coiled-coil domain) (Adipogen) was added to the media (5 μg/ml). Anisomycin (Sigma) was added directly to the collagen matrices at 50 ng/mL in EBM-2 plus FGFb and RSII. Brightfield images are shown unless otherwise specified.
Confocal Microscopy
Tissue constructs were fixed and stained with fluorescein isothiocyanate (FITC) conjugated Ulex Europaeus Agglutinin 1 (UEA-1) lectin (L9006, Sigma-Aldrich, St. Louis, MO). Constructs were imaged using confocal microscopy performed on an Olympus Fluoview FV1000 confocal system adapted to an Olympus IX81 inverted microscope with a 60X UPlanSApo water immersion objective (Olympus, Tokyo, Japan). Images (105.978 μm × 105.978 μm) were collected in combined fluorescence and reflection modes for visualization of ECFCs and collagen fibrils, respectively, to collect 3D images (2 μm thickness/slice).
Migration Assay
Confluent monolayers of ECFCs transfected with ANGPTL2 or negative control siRNA were scratched with a 1000 μL pipette tip (Corning). Images were collected at 100X at 0 and 16 hours. The scratched area was quantified using ImageJ (NIH), and the area covered by migration was calculated by subtracting the area at t = 16hrs from the area at t = 0.
Sprouting Assay
Qualitative assessment of endothelial sprouting was carried out as previously described [28]. Briefly, collagen matrices were made as described above without cells. After polymerization, ECFCs in EGM-2 were seeded as a monolayer on top. After 24–48 hours, matrices were fixed in 4% formaldehyde and stained with 0.1% toluidine blue in 30% methanol.
Western blots
ECFCs transfected with either ANGPTL2 or negative control siRNA were serum starved for 5 hours in EBM-2 prior to stimulation with 50 nM phorbol-12-myristate-13-acetate (PMA) for 30 min at 37°C. Cell lysates were prepared by resuspending cells in lysis buffer (20 mM Tris-HCl pH 7.5, 150 mM NaCl, 10% glycerol, 1% Triton X-100, 2 mM EDTA, 1 mM Na3VO4, 1μg/ml each of aprotinin and leupeptin) followed by incubation on ice for 20 min, insoluble components were removed by centrifugation at 12,000 ×g for 15 min. Protein concentration was determined by a Lowry protein assay kit (Bio-Rad). Proteins were separated by electrophoresis on 4–20% Tris-glycine minigels and then transferred onto immobilon-FL PVDF membrane (Millipore). Nonspecific binding was blocked with Odyssey blocking buffer for 1 hr at room temperature and incubated overnight at 4°C with primary antibodies against phospho-JNK and phospho-ERK1/2 (1:1,000; Cell Signaling) in blocking buffer. Blots were washed with PBS containing 0.1% Tween20, followed by incubation for 1 hour at room temperature with anti-rabbit antibody (1:10,000; Li-cor). Immunoreactive bands were detected using the Odyssey Infrared Imager (Li-cor). Densitometric analyses were performed using the infrared imager software (Odyssey; LI-COR).
Quantitative (Real-Time) RT-PCR
ECFC-derived ECs were released from the primary culture dish (2D) by TrypLE Express (Gibco) and centrifuged at 400×g for 5 min before homogenization in RLT buffer (Qiagen), and ECs from collagen matrix plugs (3D) were homogenized directly in RLT buffer (Qiagen) using a 0.5mL RNase-Free Pellet Pestle and Pellet Pestle Motor (Kimble-Chase). Collagen matrices were pelleted by microcentrifugation at max speed (14,000 RPM) for 30 sec, and the supernatant transferred to a new microcentrifuge tube (Costar). RNA was isolated using the RNeasy Micro Kit (Qiagen) according to the manufacturer’s instructions using DNAseI on column genomic DNA digestion. RNA was quantified using a Nanodrop 1000 (Thermo Scientific) and quality was assessed by the A260/A280 and A260/A230 ratios. Reverse transcription was carried out using the Omniscript RT Kit (Qiagen) incorporating Oligo (dT) 15 primer (Promega). Quantitative Real-Time PCR (qRT-PCR) was performed using the FastStart Universal SYBR Green Master (ROX) (Roche) using 25 ng cDNA from three different patients’ ECFCs per reaction. Sequences for primers (Invitrogen) can be found in Table 1. Amplification was performed in an ABI7500 Real-Time PCR system (Applied Biosystems). Cycling conditions were as follows: 95°C for 10 minutes, followed by 40 cycles of 95°C for 15 seconds and 60°C for 1 minute. 7500 Software (Applied Biosystems) was used to determine the cycle threshold (Ct) values. Data were analyzed using the 2−ΔCt method using the housekeeping gene ATP5B for normalization. This method reports expression levels of transcripts relative to ATP5B. Each sample was measured in triplicate in three separate experiments, and a maximum standard deviation between Ct values of 0.3 was considered acceptable.
Table 1. Quantitative (Real-Time) RT-PCR primers.
Sequences of forward and reverse primers used in qRT-PCR experiments are provided.
| Forward (5′-3′) | Reverse (5′-3′) | |
|---|---|---|
| ATP5B | CCACTACCAAGAAGGGATCTATCA | GGGCAGGGTCAGTCAGTCAAGTC |
| ANGPT2 | GGATGGAGACAACGACAAATG | GGACCACATGCATCAAACC |
| ANGPTL1 | ATGATGTGGCATAATGGTAAACA | AAGTGGGCGCAGTTTCCT |
| ANGPTL2 | CCACCCTGGACAGAGATCAT | AGTGGGCACAGGCGTTATAC |
| ANGPTL3 | TCCTGCTGAATGTACCACCA | TCTTCTCTAGGCCCAACCAA |
| ANGPTL4 | GACCCGGCTCACAATGTC | GGAACAGCTCCTGGCAATC |
| ANGPTL5 | CACTTAGGACGGTATTCAGGAAA | GGCATTGCATTTTGATTATCTTC |
| ANGPTL6 | AGACCCAGAGACAGCAGGAG | CCCACTCGCAGTTCATACAC |
| ANGPTL7 | GGAGTGTATAAGCTTCCTCCTGAT | CCTGAAGTCTCCATGTCACAGA |
| MT1-MMP | CTGTCAGGAATGAGGATCTGAA | AGGGGTCACTGGAATGCTC |
Statistical Analysis
Biological and technical replicates are illustrated in scatter graphs. Non-parametric tests were performed using GraphPad InStat (GraphPad Software, San Diego California USA, www.graphpad.com) as indicated in the figure legends.
RESULTS
ANGPTL family gene expression
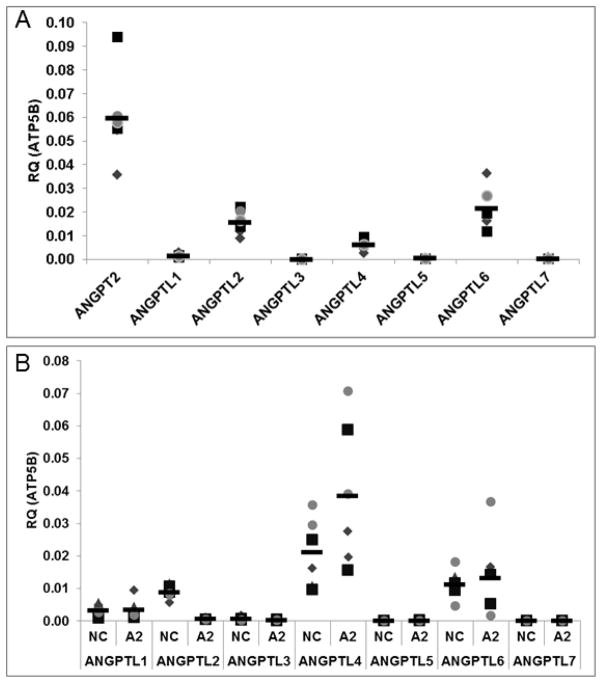
To determine the relative gene expression levels of the ANGPTL gene family members in ECFCs, we used quantitative real time RT-PCR (qRT-PCR). For reference purposes, expression levels are shown relative to angiopoietin-2, a key regulator of angiogenesis. Of the seven members in the ANGPTL gene family, ANGPTL2 and ANGPTL6 mRNA expression levels were statistically higher than ANGPTL3 and ANGPTL7 in ECFCs (Figure 1A). Furthermore, ANGPTL1, 3, 5, and 7 all had relatively high Ct values (31, 35, 32, and 33, respectively) at reasonable cDNA loads (25 ng per reaction), which suggests they are expressed at low levels.
Figure 1. Angiopoietin-like mRNA expression in ECFCs.
qRT-PCR was performed for the ANGPTL family members in ECFCs (A). ANGPTL2 and 6 were found to be expressed significantly in ECFCs compared to ANGPTL3 and 7. Expression of Angiopoietin-2 (ANGPT2) is included for comparison purposes. All data are normalized to the housekeeping gene ATP5B. Next qRT-PCR was performed for the ANGPTL family members in ECFCs treated with ANGPTL2 or negative control siRNA (B). ANGPTL2 silencing is demonstrated. ANGPTL4 expression was elevated in response to ANGPTL2 KD with no significant alterations in expression levels of the other ANGPTL genes (Figure 1B). Technical replicates are represented by the same symbol with each biological replicate represented by a unique symbol. NC = Negative Control; A2 = ANGPTL2 KD. RQ = relative quantity. (n = 3). Statistical analyses: Kruskal-Wallis test with Dunn post-test (Figure 1A) and Wilcoxon matched pairs test (Figure 1B).
Due to previous reports of a stimulatory effect of ANGPTL2 on angiogenic sprouting, we sought to determine whether or not modulation of ANGPTL2 affected vasculogenesis in ECFCs, and to test this we used siRNA to silence expression of ANGPTL2. We first used qRT-PCR to validate knockdown (KD) of ANGPTL2 expression and also examine the effects of ANGPTL2 silencing on the expression levels of the other ANGPTL family members. ANGPTL2 expression was decreased by 93%. ANGPTL4 appeared to have a small but significant compensatory increase in expression in response to ANGPTL2 KD without significantly altering expression levels of any other ANGPTL genes (Figure 1B).
ANGPTL2 in ECFC vasculogenesis
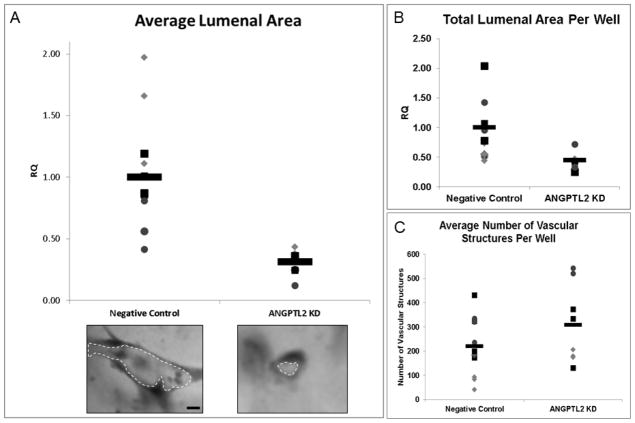
Next we observed the effect of ANGPTL2 gene silencing on ECFC vacuole and lumen formation during a 2 days in vitro culture in 3D collagen gels. There was a significant 3 fold decrease in the average lumenal area of the 3D ECFC derived vascular structures (Figure 2A). The total lumenal area was 2.2 fold lower in ANGPTL2 siRNA treated ECFCs (Figure 2B), and there was no significant difference in the total number of vascular structures, although the average was approximately 40% higher in the ANGPTL2 KD ECFCs (Figure 2C). To account for the potential effect of the compensatory increase in ANGPTL4 levels, we investigated the effect of ANGPTL4 KD and combined ANGPTL2 and 4 KD on vasculogenesis in ECFCs. We found that both conditions had a similar phenotype to, but not greater than, ANGPTL2 KD (data not shown). To demonstrate that the vascular structures observed are actually lumenized, we used confocal microscopy to visualize collagen fibril density and ECFCs by lectin staining. It was apparent that the space within the vascular structures was devoid of collagen fibrils indicating a lumen was present (Supplementary Figure 1).
Figure 2. Quantitation of ECFC lumen formation in response to ANGPTL2 silencing in a 3D assay of vasculogenesis.
ANGPTL2 silencing significantly decreased the average vascular lumen area at 2 days compared to negative control siRNA treated ECFCs (A). Representative vascular structures for each group are shown. ANGPTL2 silencing significantly decreased the total lumenal area of 3D vascular structures compared to negative control siRNA treated ECFCs (B) but did not alter the average number of vascular structures (C). RQ = relative quantity; Bar = 10 μm. Technical replicates are represented by the same symbol with each biological replicate represented by a unique symbol (n = 3). Statistical analysis: Mann-Whitney test.
To determine if ANGPTL2 has a positive effect on vasculogenesis, recombinant human ANGPTL2 (rhANGPTL2) was added back to the media in normal ECFCs. It is still unclear which domain of ANGPTL2, the coiled-coil domain (CCD) or fibrinogen-like domain (FLD), is critical for its function in blood vessel formation, so we added each domain separately to the vasculogenesis assay media at day 0. We found that the CCD but not the FLD led to a statistically significant increase in lumen formation in normal ECFCs (Figure 3).
Figure 3. Quantitation of ECFC lumenal area in response to exogenous addition of rhANGPTL2 domains.
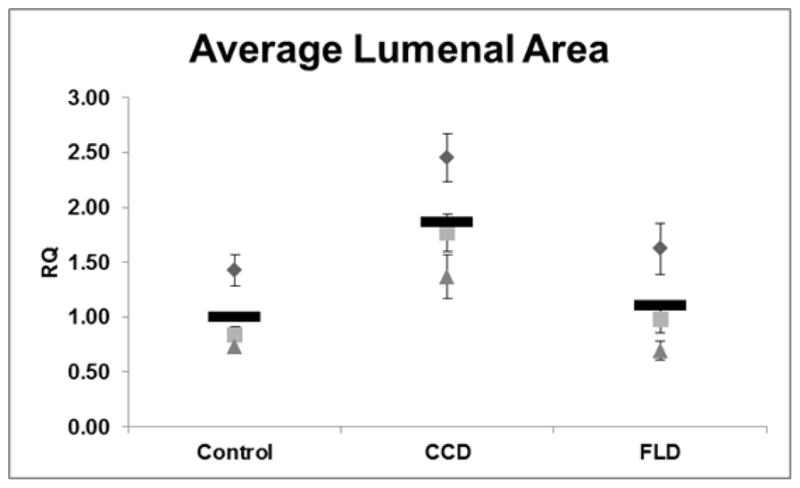
The average lumenal area of ECFC derived 3D vascular structures treated with recombinant human angiopoietin-like protein 2 fibrinogen-like domain (FLD), coiled-coil domain (CCD), or vehicle (control) was calculated. CCD treatment but not FLD significantly improved lumen formation in ECFCs. RQ = relative quantity; n = 3. Since there were no technical replicates in this experiment, the standard error of the mean was included with the average of each biological replicate to illustrate the size range of the vascular structures measured; there were 324 structures measured on average per well. Statistical analysis: Kruskal-Wallis test with Dunn post-test.
We also wanted to look at the effect of ANGPTL2 gene silencing on other common cell behaviors known to be important in vessel formation such as sprouting, migration, proliferation, and apoptosis. Kim et al originally observed a stimulatory effect of ANGPTL2 (200 ng/mL) on porcine pulmonary arterial endothelial cells (PPAEC) sprouting [11]. We did not observe a decrease in sprouting behavior in ANGPTL2 silenced ECFCs compared to control (Supplementary Figure 2). However, consistent with the prior publication [11], we found no effect on cell proliferation as determined by cell counting using a hemocytometer 24 hours after siRNA transfection. To test this more rigorously, we replated ECFCs 24 hours after transfection and counted nuclei 48 hrs later and again found no difference in cell number (Supplementary Figure 3A). Importantly, there was no effect on apoptosis as determined by flow cytometric Annexin V translocation (Supplementary Figure 3B). However, we did find that ANGPTL2 KD significantly affected endothelial cell (EC) migration, which was consistent with previous observations [13]. Time-lapse images collected following scratching a monolayer of ECFCs with a pipette tip revealed there was a significant 36% decrease in the capacity of these cells to migrate and cover the scratched area (Figure 4).
Figure 4. Quantitative migration assay of ECFCs in response to ANGPTL2 silencing.
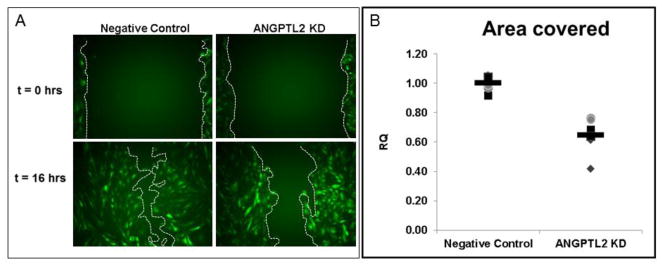
Confluent monolayers of ECFCs were scratched with a 1000 μL pipette tip with the boundaries indicated by the red lines. Images were collected until the negative control siRNA treated ECFCs filled in the scratched area, which occurred no later than 16 hours after the initial scratch. There was a significant delay in migration in ANGPTL2 silenced ECFCs as determined by area covered. For the purposes of this figure to highlight differences in migration, images were collected from experiments conducted with transgenic ECFCs constitutively expressing GFP. RQ = relative quantity; Technical replicates are represented by the same symbol with each biological replicate represented by a unique symbol (n = 4). Statistical analysis: Mann-Whitney test.
Cell signaling mechanisms
ANGPTL2 is a secreted glycoprotein thought to act in an autocrine or paracrine manner through various putative receptors [12, 13], so we hypothesized that suppressing expression of ANGPTL2 in ECFCs would result in alterations in the pathways typically known to be involved in EC migration and lumen formation.
Previous studies have demonstrated that activation of c-Jun NH2-terminal kinase (JNK) using anisomycin induced membrane type 1 matrix metalloproteinase (MT1-MMP) mRNA expression in ECs and inhibition of JNK reduced MT1-MMP mRNA expression in ECs [19]. We hypothesized that activation of JNK would be attenuated in ANGPTL2 siRNA treated ECFCs. Indeed, we found that JNK, but not ERK1/2, phosphorylation was significantly decreased in ANGPTL2 KD ECFCs (Figure 5). In addition, given the previously established importance of MT1-MMP in EC migration and lumen formation [18, 22, 23, 25], we used qRT-PCR to determine the relative expression levels of MT1-MMP in 3D ECFC derived vascular structures and also to validate any effect of suppressing ANGPTL2 expression on MT1-MMP transcript levels. We found that in ANGPTL2 siRNA treated ECFCs, ANGPTL2 and MT1-MMP expression were significantly decreased in 3D matrices at 48 hours (Figure 6).
Figure 5. MAP kinase phosphorylation analysis.
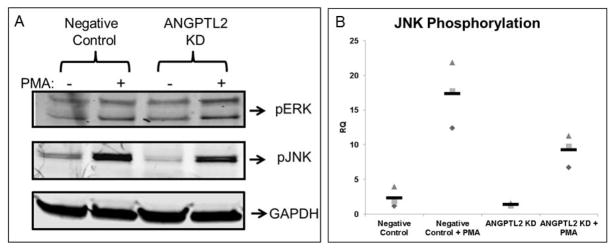
Representative Western blots are shown (A) with quantification (B) of ECFCs pretreated with negative control or ANGPTL2 siRNA then serum starved for 5 hours followed by treatment with 50 nM PMA or vehicle prior to lysis. There was significantly less JNK but not ERK1/2 phosphorylation in ECFCs treated with ANGPTL2 siRNA compared to negative control siRNA. RQ = relative quantity; n = 4. Statistical analysis: Kruskal-Wallis test with Dunn post-test.
Figure 6. Quantitative RT-PCR analysis of ANGPTL2 and MT1-MMP gene expression from 3D ECFC vascular structures.
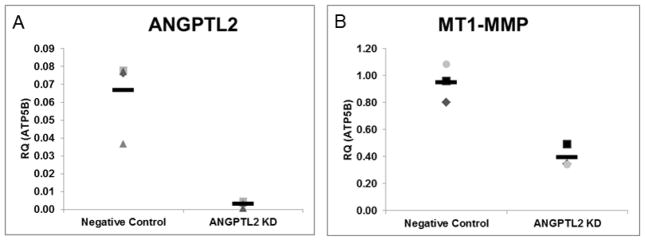
3D vascular structures formed from siRNA treated ECFCs were lysed with RNA lysis buffer at 48 hours. Real time PCR was used to determine relative expression levels of ANGPTL2 and MT1-MMP in 3D in response to ANGPTL2 KD. Both transcripts were found to be decreased in ANGPTL2 silenced ECFCs in 3D. Data are normalized to the housekeeping gene ATP5B. RQ = relative quantity; n = 3. Statistical analysis: Mann-Whitney test.
We next wanted to determine if inhibiting JNK or MT1-MMP activation would result in a similar phenotype to the ANGPTL2 KD in ECFCs and if activation of JNK would result in increased lumenization. Using a JNK inhibitor we observed a statistically significant decrease in ECFC lumen formation, and likewise, using a JNK activator, we observed a statistically significant increase in lumen formation. Finally, we also added exogenous recombinant human TIMP-3 (tissue inhibitor of metalloproteinases-3), which is known to inhibit MT1-MMP translocation [29], to the media in cellularized matrices and observed a statistically significant decrease in lumen formation similar to that found upon ANGPTL2 silencing (Figure 7).
Figure 7. Quantitation of ECFC lumenal area in response to activation or inhibition of JNK and inhibition MT1-MMP.
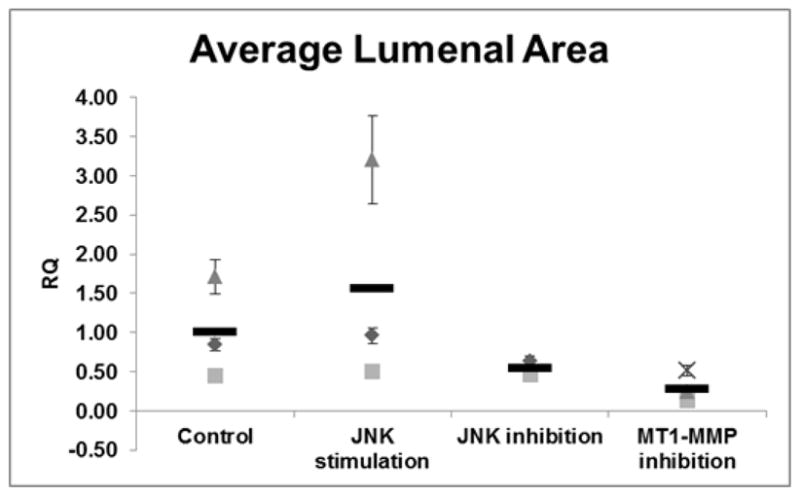
The average lumenal area of ECFC derived 3D vascular structures treated with JNK activator, JNK inhibitor, or MT1-MMP inhibitor (TIMP-3). ECFCs display statistically significant diminished lumen formation through inhibition of JNK activity, whereas activation of JNK via anisomycin resulted in increased lumen formation compared to control ECFCs. Inhibition of MT1-MMP function using exogenous addition of rhTIMP-3 resulted in a statistically significant decrease in lumen formation. RQ = relative quantity; n = 3. Since there were no technical replicates in this experiment, the standard error of the mean was included with the average of each biological replicate to illustrate the size range of the vascular structures measured; there were 248 structures measured on average per well. Statistical analysis: Kruskal-Wallis test with Dunn post-test.
DISCUSSION
ANGPTL gene expression and function in ECFCs has not been previously explored. Interestingly, to date there are no known tissues where ANGPTL2, ANGPTL4, and ANGPTL6 are all simultaneously expressed; nevertheless, they have been detected in the circulation and each has a purported role in regulating angiogenesis [10] consistent with the function of ECFCs. That ANGPTL3 is expressed in HUVECs but not ECFCs is interesting since ANGPTL3 is known to be a positive regulator of angiogenesis [30], further supporting a unique role for ANGPTL2 in ECFC vasculogenesis. In human subjects, ANGPTL1 and ANGPTL2 are frequently co-expressed; thus, ECFCs may represent a rare cell type where only ANGPTL2 is expressed. Kubota et al found that ANGPTL2 KD in zebrafish had no effect on the vasculature but when ANGPTL1 and ANGPTL2 were both silenced, there were severe defects in the vasculature [31]. These results extended upon previous studies suggested that ANGPTL2 has context dependent effects [32] and is consistent with our observations of strong effects of ANGPTL2 KD without concomitant expression of ANGPTL1. This also may help explain why ANGPTL2 knockout transgenic mice display no gross effects in the vascular system.
3D in vitro models of EC vacuole and lumen formation have been instrumental in discovering the key cellular processes and underlying molecular events necessary for vasculogenesis [24]. We describe here for the first time a role for ANGPTL2 in ECFC vasculogenesis using a 3D PSC based assay. This system differs from conventional monomeric collagen matrices in that it incorporates oligomeric collagen, which has been shown to facilitate stabilized, mature vessel network formation [14, 33]. Although vacuole formation did not appear to be affected, lumen formation, the process by which multiple vacuoles coalesce to form multicellular hollow vascular structures, was dramatically reduced as reflected in the average lumenal area. Consistent with previous observations we found that ANGPTL2 affects EC migration [13] and does not affect proliferation [11]. Tabata et al found that treating HUVECs and HAECs with ANGPTL2 activated Rac1 and promoted their migration of through a chemotaxis membrane, and Kim et al found that treating HUVECs with ANGPTL2 protein had no effect on proliferation as determined by [3H]thymidine incorporation. Kim et al also found that exogenous ANGPTL2 induces sprouting in PPAECs, but in this study we did not find the reverse to be true as ANGPTL2 KD did not affect ECFC sprouting. Although there was no effect of ANGPTL2 on proliferation in 2D, there were apparently fewer cells in ANGPTL2 KD ECFCs in 3D as determined by DAPI staining (data not shown). However, we would propose this was likely due to a decrease in the ability of ANGPTL2 KD ECFCs to migrate and interconnect vacuoles or partially lumenized structures.
Importantly, ANGPTL2 protein was found to have a positive effect as exogenous addition of ANGPTL2 coiled-coil domain (CCD) but not the C-terminal fibrinogen-like domain (FLD) led to an increase in lumenization. It is known that ANGPTL2 acts through its CCD to regulate survival and replating capacity of human cord blood hematopoietic progenitors [34], but its angiogenic activity is thought to occur through the FLD based on similarities to angiopoietin-1 [10]. However, it is still unknown which structural domain is responsible for its function in ECs. Our results suggest that the CCD is critical for the positive effect ANGPTL2 on vasculogenesis in ECFCs.
Tabata et al showed that a neutralizing antibody for integrin αvβ1 inhibited EC adhesion to ANGPTL2-coated plates implicating αvβ1 as a receptor for ANGPTL2 in ECs [13]. Hu et al found that angiopoietin-2, possessing the same characteristic coiled-coil and fibrinogen-like domains as ANGPTL2, will bind αvβ1 when it cannot bind Tie2 and activates JNK to induce expression of MMPs [35]. Interestingly, JNK has been shown to be a positive regulator of EC behavior including migration and proteolysis via MT1-MMP [26]. In 2002, Koike et al demonstrated that MT1-MMP but not other MMPs were required for migration of ECs in 3D collagen matrices [21], and in 2009 Stratman et al demonstrated that MT1-MMP is actually required for lumen formation in 3D collagen matrices [25]. Indeed, the role of MT1-MMP in EC migration and lumenization in 3D matrices has been well established such that it seems modulating JNK activation and MT1-MMP expression is a requirement for EC lumenization [15–25]. Our data are consistent with these findings and corroborates our central hypothesis that ANGPTL2 regulates ECFC vasculogenesis. Nevertheless, JNK signaling is known to affect transcription of many genes, and thus we expect that ANGPTL2 receptor activation would therefore result in alteration of many genes in addition to MT1-MMP. We conclude then that ANGPTL2 positively regulates ECFC lumen formation in vitro probably through its effects on migration and in part by activating JNK and increasing MT1-MMP expression.
Supplementary Material
ECFCs were stained in 3D with FITC conjugated UEA-1. Images were collected in reflection modes and combined fluorescence for visualization of collagen fibrils and ECFCs, respectively. The absence of collagen fibrils between ECFCs indicates lumen formation. Overlay is a merged imaged of reflection and fluorescence stained images and a brightfield image is also shown for comparison purposes. Bar = 20 μm.
Representative images are shown of ECFCs sprouting into 3D collagen matrices. No difference was observed in due ANGPTL2 expression silencing in vitro. Bar = 50 μm.
ANGPTL2 silencing affected neither proliferation as determined by nuclei counting up to 48 hours post-transfection (A) nor apoptosis as determined by Annexin V translocation (B); n = 10 (A); n = 4 (B).
Acknowledgments
This work was supported in part by the American Heart Association Midwest Affiliate Postdoctoral Fellowship (12POST9530008) and by the National Heart, Lung, and Blood Institute (R01HL10962, SLV-H and MCY).
References
- 1.Iruela-Arispe ML, Davis GE. Cellular and molecular mechanisms of vascular lumen formation. Dev Cell. 2009;16(2):222–31. doi: 10.1016/j.devcel.2009.01.013. [DOI] [PMC free article] [PubMed] [Google Scholar]
- 2.Prater DN, et al. Working hypothesis to redefine endothelial progenitor cells. Leukemia. 2007;21(6):1141–9. doi: 10.1038/sj.leu.2404676. [DOI] [PubMed] [Google Scholar]
- 3.Czirok A, Little CD. Pattern formation during vasculogenesis. Birth Defects Res C Embryo Today. 2012;96(2):153–62. doi: 10.1002/bdrc.21010. [DOI] [PMC free article] [PubMed] [Google Scholar]
- 4.Ingram DA, et al. Identification of a novel hierarchy of endothelial progenitor cells using human peripheral and umbilical cord blood. Blood. 2004;104(9):2752–60. doi: 10.1182/blood-2004-04-1396. [DOI] [PubMed] [Google Scholar]
- 5.Richardson MR, Yoder MC. Endothelial progenitor cells: quo vadis? J Mol Cell Cardiol. 2011;50(2):266–72. doi: 10.1016/j.yjmcc.2010.07.009. [DOI] [PMC free article] [PubMed] [Google Scholar]
- 6.Yoder MC, et al. Redefining endothelial progenitor cells via clonal analysis and hematopoietic stem/progenitor cell principals. Blood. 2007;109(5):1801–9. doi: 10.1182/blood-2006-08-043471. [DOI] [PMC free article] [PubMed] [Google Scholar]
- 7.Yancopoulos GD, et al. Vascular-specific growth factors and blood vessel formation. Nature. 2000;407(6801):242–8. doi: 10.1038/35025215. [DOI] [PubMed] [Google Scholar]
- 8.Jin SW, Patterson C. The opening act: vasculogenesis and the origins of circulation. Arterioscler Thromb Vasc Biol. 2009;29(5):623–9. doi: 10.1161/ATVBAHA.107.161539. [DOI] [PMC free article] [PubMed] [Google Scholar]
- 9.Oike Y, Yasunaga K, Suda T. Angiopoietin-related/angiopoietin-like proteins regulate angiogenesis. Int J Hematol. 2004;80(1):21–8. doi: 10.1532/ijh97.04034. [DOI] [PubMed] [Google Scholar]
- 10.Hato T, Tabata M, Oike Y. The Role of Angiopoietin-Like Proteins in Angiogenesis and Metabolism. Trends in Cardiovascular Medicine. 2008;18(1):6–14. doi: 10.1016/j.tcm.2007.10.003. [DOI] [PubMed] [Google Scholar]
- 11.Kim I, et al. Molecular cloning, expression, and characterization of angiopoietin-related protein. angiopoietin-related protein induces endothelial cell sprouting. J Biol Chem. 1999;274(37):26523–8. doi: 10.1074/jbc.274.37.26523. [DOI] [PubMed] [Google Scholar]
- 12.Zheng J, et al. Inhibitory receptors bind ANGPTLs and support blood stem cells and leukaemia development. Nature. 2012;485(7400):656–60. doi: 10.1038/nature11095. [DOI] [PMC free article] [PubMed] [Google Scholar]
- 13.Tabata M, et al. Angiopoietin-like protein 2 promotes chronic adipose tissue inflammation and obesity-related systemic insulin resistance. Cell Metab. 2009;10(3):178–88. doi: 10.1016/j.cmet.2009.08.003. [DOI] [PubMed] [Google Scholar]
- 14.Bailey JL, et al. Collagen oligomers modulate physical and biological properties of three-dimensional self-assembled matrices. Biopolymers. 2011;95(2):77–93. doi: 10.1002/bip.21537. [DOI] [PMC free article] [PubMed] [Google Scholar]
- 15.Fisher KE, et al. MT1-MMP- and Cdc42-dependent signaling co-regulate cell invasion and tunnel formation in 3D collagen matrices. J Cell Sci. 2009;122(Pt 24):4558–69. doi: 10.1242/jcs.050724. [DOI] [PMC free article] [PubMed] [Google Scholar]
- 16.Galvez BG, et al. Membrane type 1-matrix metalloproteinase is activated during migration of human endothelial cells and modulates endothelial motility and matrix remodeling. J Biol Chem. 2001;276(40):37491–500. doi: 10.1074/jbc.M104094200. [DOI] [PubMed] [Google Scholar]
- 17.Galvez BG, et al. ECM regulates MT1-MMP localization with beta1 or alphavbeta3 integrins at distinct cell compartments modulating its internalization and activity on human endothelial cells. J Cell Biol. 2002;159(3):509–21. doi: 10.1083/jcb.200205026. [DOI] [PMC free article] [PubMed] [Google Scholar]
- 18.Haas TL, Davis SJ, Madri JA. Three-dimensional type I collagen lattices induce coordinate expression of matrix metalloproteinases MT1-MMP and MMP-2 in microvascular endothelial cells. J Biol Chem. 1998;273(6):3604–10. doi: 10.1074/jbc.273.6.3604. [DOI] [PubMed] [Google Scholar]
- 19.Ispanovic E, Haas TL. JNK and PI3K differentially regulate MMP-2 and MT1-MMP mRNA and protein in response to actin cytoskeleton reorganization in endothelial cells. Am J Physiol Cell Physiol. 2006;291(4):C579–88. doi: 10.1152/ajpcell.00300.2005. [DOI] [PubMed] [Google Scholar]
- 20.Itoh Y. MT1-MMP: a key regulator of cell migration in tissue. IUBMB Life. 2006;58(10):589–96. doi: 10.1080/15216540600962818. [DOI] [PubMed] [Google Scholar]
- 21.Koike T, et al. MT1-MMP, but not secreted MMPs, influences the migration of human microvascular endothelial cells in 3-dimensional collagen gels. J Cell Biochem. 2002;86(4):748–58. doi: 10.1002/jcb.10257. [DOI] [PubMed] [Google Scholar]
- 22.Langlois S, Gingras D, Beliveau R. Membrane type 1-matrix metalloproteinase (MT1-MMP) cooperates with sphingosine 1-phosphate to induce endothelial cell migration and morphogenic differentiation. Blood. 2004;103(8):3020–8. doi: 10.1182/blood-2003-08-2968. [DOI] [PubMed] [Google Scholar]
- 23.Sacharidou A, et al. Endothelial lumen signaling complexes control 3D matrix-specific tubulogenesis through interdependent Cdc42- and MT1-MMP-mediated events. Blood. 2010;115(25):5259–69. doi: 10.1182/blood-2009-11-252692. [DOI] [PMC free article] [PubMed] [Google Scholar]
- 24.Sacharidou A, Stratman AN, Davis GE. Molecular mechanisms controlling vascular lumen formation in three-dimensional extracellular matrices. Cells Tissues Organs. 2012;195(1–2):122–43. doi: 10.1159/000331410. [DOI] [PMC free article] [PubMed] [Google Scholar]
- 25.Stratman AN, et al. Endothelial cell lumen and vascular guidance tunnel formation requires MT1-MMP-dependent proteolysis in 3-dimensional collagen matrices. Blood. 2009;114(2):237–47. doi: 10.1182/blood-2008-12-196451. [DOI] [PMC free article] [PubMed] [Google Scholar]
- 26.Uchida C, et al. JNK as a positive regulator of angiogenic potential in endothelial cells. Cell Biol Int. 2008;32(7):769–76. doi: 10.1016/j.cellbi.2008.03.005. [DOI] [PubMed] [Google Scholar]
- 27.Stratman AN, et al. Pericyte recruitment during vasculogenic tube assembly stimulates endothelial basement membrane matrix formation. Blood. 2009;114(24):5091–101. doi: 10.1182/blood-2009-05-222364. [DOI] [PMC free article] [PubMed] [Google Scholar]
- 28.Koh W, et al. In vitro three dimensional collagen matrix models of endothelial lumen formation during vasculogenesis and angiogenesis. Methods Enzymol. 2008;443:83–101. doi: 10.1016/S0076-6879(08)02005-3. [DOI] [PubMed] [Google Scholar]
- 29.Aplin AC, et al. Vascular regression and survival are differentially regulated by MT1-MMP and TIMPs in the aortic ring model of angiogenesis. Am J Physiol Cell Physiol. 2009;297(2):C471–80. doi: 10.1152/ajpcell.00019.2009. [DOI] [PMC free article] [PubMed] [Google Scholar]
- 30.Camenisch G, et al. ANGPTL3 stimulates endothelial cell adhesion and migration via integrin alpha vbeta 3 and induces blood vessel formation in vivo. J Biol Chem. 2002;277(19):17281–90. doi: 10.1074/jbc.M109768200. [DOI] [PubMed] [Google Scholar]
- 31.Kubota Y, et al. Cooperative interaction of Angiopoietin-like proteins 1 and 2 in zebrafish vascular development. Proc Natl Acad Sci U S A. 2005;102(38):13502–7. doi: 10.1073/pnas.0501902102. [DOI] [PMC free article] [PubMed] [Google Scholar]
- 32.Dhanabal M, et al. Angioarrestin: an antiangiogenic protein with tumor-inhibiting properties. Cancer Res. 2002;62(13):3834–41. [PubMed] [Google Scholar]
- 33.Whittington CF, Yoder MC, Voytik-Harbin SL. Collagen-Polymer Guidance of Vessel Network Formation and Stabilization by Endothelial Colony Forming Cells In Vitro. Macromol Biosci. 2013 doi: 10.1002/mabi.201300128. [DOI] [PMC free article] [PubMed] [Google Scholar]
- 34.Broxmeyer HE, et al. Angiopoietin-like-2 and -3 act through their coiled-coil domains to enhance survival and replating capacity of human cord blood hematopoietic progenitors. Blood Cells Mol Dis. 2012;48(1):25–9. doi: 10.1016/j.bcmd.2011.09.004. [DOI] [PMC free article] [PubMed] [Google Scholar]
- 35.Hu B, et al. Angiopoietin 2 induces glioma cell invasion by stimulating matrix metalloprotease 2 expression through the alphavbeta1 integrin and focal adhesion kinase signaling pathway. Cancer Res. 2006;66(2):775–83. doi: 10.1158/0008-5472.CAN-05-1149. [DOI] [PMC free article] [PubMed] [Google Scholar]
Associated Data
This section collects any data citations, data availability statements, or supplementary materials included in this article.
Supplementary Materials
ECFCs were stained in 3D with FITC conjugated UEA-1. Images were collected in reflection modes and combined fluorescence for visualization of collagen fibrils and ECFCs, respectively. The absence of collagen fibrils between ECFCs indicates lumen formation. Overlay is a merged imaged of reflection and fluorescence stained images and a brightfield image is also shown for comparison purposes. Bar = 20 μm.
Representative images are shown of ECFCs sprouting into 3D collagen matrices. No difference was observed in due ANGPTL2 expression silencing in vitro. Bar = 50 μm.
ANGPTL2 silencing affected neither proliferation as determined by nuclei counting up to 48 hours post-transfection (A) nor apoptosis as determined by Annexin V translocation (B); n = 10 (A); n = 4 (B).


