Abstract
Purpose: Ischemic vascular diseases, including myocardial infarction (MI) and stroke, have been found to be associated with elevated expression of αvβ3-integrin, which provides a promising target for semi-quantitative monitoring of the disease. For the first time, we employed 68Ga-S-2-(isothiocyanatobenzyl)-1,4,7-triazacyclononane-1,4,7-triacetic acid-PEG3-E[c(RGDyK)]2 (68Ga-PRGD2) to evaluate the αvβ3-integrin-related repair in post-MI and post-stroke patients via positron emission tomography/computed tomography (PET/CT).
Methods: With Institutional Review Board approval, 23 MI patients (3 days-2 years post-MI) and 16 stroke patients (3 days-13 years post-stroke) were recruited. After giving informed consent, each patient underwent a cardiac or brain PET/CT scan 30 min after the intravenous injection of 68Ga-PRGD2 in a dose of approximately 1.85 MBq (0.05 mCi) per kilogram body weight. Two stroke patients underwent repeat scans three months after the event.
Results: Patchy 68Ga-PRGD2 uptake occurred in or around the ischemic regions in 20/23 MI patients and punctate multifocal uptake occurred in 8/16 stroke patients. The peak standardized uptake values (pSUVs) in MI were 1.94 ± 0.48 (mean ± SD; range, 0.62-2.69), significantly higher than those in stroke (mean ± SD, 0.46 ± 0.29; range, 0.15-0.93; P < 0.001). Higher 68Ga-PRGD2 uptake was observed in the patients 1-3 weeks after the initial onset of the MI/stroke event. The uptake levels were significantly correlated with the diameter of the diseases (r = 0.748, P = 0.001 for MI and r = 0.835, P = 0.003 for stroke). Smaller or older lesions displayed no uptake.
Conclusions: 68Ga-PRGD2 uptake was observed around the ischemic region in both MI and stroke patients, which was correlated with the disease phase and severity. The different image patterns and uptake levels in MI and stroke patients warrant further investigations.
Keywords: 68Ga-PRGD2, PET/CT, stroke, myocardial infarction, αvβ3-integrin, angiogenesis.
Introduction
Ischemic vascular diseases, including myocardial infarction (MI) and stroke, have been the leading causes of death and disability worldwide. The disease burdens of the ischemic heart disease and stroke rank first and third, respectively, according to the Global Burden of Disease Study 2010, and the two diseases collectively account for one in four deaths 1, 2. In contrast to the rapid development of recanalization therapies such as stent implantation and thrombolytic treatments 3, there have been fewer technical advances in therapeutic angiogenesis, although it holds the same promise of re-establishing the blood supply and reviving myocardial and cerebral function, especially when complete recanalization is impossible 4. The absence of convenient and objective methodology to quantify the angiogenesis in vivo is one factor that may impair its development.
Angiogenesis imaging is a promising method for quantifying the formation of new blood vessels and is experiencing a breakthrough in oncology with the rapid development of anti-angiogenesis therapy for tumors 5, 6. This technology also helps to evaluate pro-angiogenesis treatments for ischemic vascular diseases 7, 8. The pathophysiological process of angiogenesis involves a number of receptors and other functional molecules regulated by pro-angiogenesis and anti-angiogenesis factors, thus offering a variety of targets for angiogenesis imaging, including vascular endothelial growth factor, integrin αvβ3, matrix metalloproteinases, and the fibronectin isoform ED-B domain 5-9. Among the angiogenesis imaging methods, αvβ3-integrin imaging is the most studied and has been preliminarily translated into clinical use. As one of the most important members of the integrin family, which mainly involves in the cell-cell and cell-matrix interactions 10, αvβ3-integrin is preferentially expressed by activated endothelial cells of growing vessels and is not expressed by stable endothelium 9, 10. The ability to visualize and quantify αvβ3-integrin expression using a specific ligand may provide an unique opportunity to evaluate angiogenesis in vivo 8-11.
A variety of arginine-glycine-aspartic acid (RGD)-based peptide probes have been developed with high affinity and selectivity for αvβ3-integrin 11, 12. Among them, cyclic RGD dimers with polyethylene glycol (PEG) spacers to separate the functional structures have shown optimal combinations of receptor binding, blood clearance kinetics, and biodistribution 13, 14. These peptides have been radiolabeled with 18F 15, 16, 68Ga 17, 18, 64Cu 19, 76Br 20, and 89Zr 21 for positron emission tomography (PET) imaging, as well as 99mTc 22, 23 and 111In 24 for single photon emission computed tomography (SPECT) evaluation. Among them, the 68Ga labeled tracer holds advantages as a PET tracer using generator-produced radionuclide rather than relying on an onsite cyclotron.
In this study, a 68Ga labeled cyclic RGD dimer with PEG spacers, 68Ga-S-2-(4-isothiocyanatobenzyl)-1,4,7-triazacyclononane-1,4,7-triacetic acid-PEG3- E[c(RGDyK)]2 (denoted as 68Ga-PRGD2), was translated into clinical use for the first time to evaluate post-MI and post-stroke repair via PET/computed tomography (PET/CT). Moreover, the αvβ3-integrin images of the MI and stroke patients were compared through the pilot clinical application of 68Ga-PRGD2 PET/CT in the two groups of patients.
Patients and Methods
This study had been approved by the Institutional Review Board of Peking Union Medical College Hospital, Chinese Academy of Medical Sciences & Peking Union Medical College, and registered online at NIH ClinicalTrials.gov. The registration number is NCT01542073 for the 68Ga-PRGD2 PET/CT evaluation of MI and NCT01656785 for the application in stroke patients.
Patients. From February 2012 to January 2013, the study enrolled 23 MI patients and 16 stroke patients to undergo 68Ga-PRGD2 PET/CT with written informed consent. Two of the stroke patients also repeated the scan 3 months later. The demographic characteristics of the patients are listed in Table 1.
Table 1.
Basic information of the recruited patients.
| Demographic or clinical characteristics | Myocardial infarction patients | Stroke patients |
|---|---|---|
| Total number of patients | N=23 | N=16 |
| Age, years | ||
| Range | 45-82 | 33-80 |
| Mean ± standard deviation | 61±10 | 56±14 |
| Gender | ||
| Male | N=19 | N=11 |
| Female | N=4 | N=5 |
| Post-attack duration | ||
| Range | 3 days-2 years | 4 days-13 years |
| 68Ga-PRGD2 accumulation | ||
| Positive number | N=20 | N=8 |
| Uptake pattern | Patchy form | Spotted form |
| Standardized uptake value | 0.62-2.69(1.94±0.51) | 0.15-0.93(0.46±0.29) |
| Peak uptake time of the patients | One week | Two weeks |
| Negative number | N=3 | N=8 |
| Negative reasons | Old attack (N=2); | Old attack (N=4); |
| Minor attack (N=1) | Minor attack (N=4) |
In the 23 patients (M 19, F 4, age range: 45-82 y) with confirmed MI, no patient had a known history of other kinds of heart diseases or other concurrent severe diseases, such as severe renal or liver function impairment. Thirteen patients received percutaneous coronary intervention upon arrival at the hospital. All patients were on standard medical treatment for secondary prevention of coronary artery disease, including anti-platelet agents and beta receptor blockers. Three patients used isosorbide dinitrate because of angina pectoris. The patients underwent 68Ga-PRGD2 PET/CT scan (Biograph 64 TruepointTrueV, Siemens Medical Solution) at 3 days to 2 years after the MI attack (18 patients within 1 month, three patients at 2.0-2.5 months, and two patients at 1-2 years). Fifteen patients underwent dual-isotope 99mTc-methoxyisobutyl isonitrile (MIBI)/18F-fluorodeoxyglucose (FDG) myocardial SPECT imaging (Infinia Hawkeye, GE Healthcare) within 3 days of the PET/CT scan for comparison, whereas the other eight patients underwent cardiac 18F-FDG PET/CT at nearly two hours after meal. Results of electrocardiogram (ECG), myocardial enzymes, echocardiography, and coronary angiography were also collected for comparison.
The 16 patients (M 11, F 5, age range: 33-80 y) diagnosed with ischemic stroke had presented with sudden onset of hemiplegia, hemidysesthesia and/or hemianopsia. Emergency brain CT showed bland infarct. None of the patients received thrombolytic therapy. No patient had severe renal or liver function impairment. The patients underwent brain 68Ga-PRGD2 PET/CT scan 4 days to 13 years after the event, including twelve patients within 1 month and four patients 0.5 to 13 years ago. All patients accepted brain 18F-FDG PET/CT within 3 days for comparison. All patients underwent brain magnetic resonance imaging (MRI); and eight patients had the MRI within 3 days for comparison. In addition, two patients underwent repeat brain 68Ga-PRGD2 and 18F-FDG PET/CT scans at 3 months after the event.
68Ga-PRGD2 preparation. The cyclic RGD peptide dimer was modified by PEGylated dimerization to form PEG3-E[c(RGDyK)]2 (PRGD2) and chelated with S-2-(isothiocyanatobenzyl)-1,4,7-triazacyclononane-1,4,7-triyltriacetic acid (NOTA). 68Ga-PRGD2 was synthesized immediately before the injection in a sterile hot cell using a manual method described before 17, 18. Briefly, 40 μL NOTA-PRGD2 (1 μg/μL in deionized water) was added into a mixture of 50 μL of sodium acetate solution (1.25 M) and 1 mL of 68GaCl3 eluent (111-370 MBq, pH 2.0-3.0) obtained from a 68Ge/68Ga generator (ITG Co., German). The mixture was then allowed to react on a metal heater (Gingko, China) at 100 °C for 15 min. The resulting solution was analyzed by instant thin-layer chromatography (ITL, BIOSCAN, USA) using silica-gel paper strips (Gelman Sciences) in a 1:1 mixture of methanol and ammonium acetate developing solution. The value of retention factor was approximately 0.9 for the labeled compound and 0 for the free 68Ga. The radiochemical purity was >97% and the specific radioactivity was 3.5-10.4 MBq/nmol. The final 68Ga-PRGD2 solution was filtered with a 0.2 μm Millex-LG filter (EMD Millipore) before the clinical use.
68Ga-PRGD2 PET/CT. Each patient was intravenously injected with the 68Ga-PRGD2 solution at a dose of approximately 1.85 MBq (0.05 mCi) per kilogram body weight. Thirty minutes later, a cardiac PET/CT scan (one 5-min bed position, matrix 128×128, zoom 1.25) or a brain scan (one 10-min bed position, matrix 256×256, zoom 2) was performed following a low-dose CT scan (140 kV, 35 mA, pitch 1:1, layer 3 mm, layer spacing 3 mm, matrix 512×512, FOV 70 cm) for attenuation correction and anatomic location. An iterative algorithm was used for the PET data reconstruction (three iterations for the cardiac and six iterations for the brain).
18F-FDG PET/CT and other related imaging. The 18F-FDG PET/CT cardiac scan and brain scan were performed to evaluate metabolism of the tissues using the same PET/CT system and the same parameters as the 68Ga-PRGD2 scan. Dual-isotope 99mTc-MIBI/18F-FDG myocardial SPECT imaging was performed using a GE Hawkeye SPECT system with a pair of ultra-high-energy collimators, which is a conventional examination in our hospital that holds the advantage of obtaining the myocardial perfusion and metabolic imaging in a single examination. The doses per patient were about 740 MBq (20 mCi) for 99mTc-MIBI (High Technology Atom Corporation, Beijing, China) and approximately 296 MBq (8 mCi) for 18F-FDG . The abovementioned cardiac 18F-FDG metabolic imaging was performed at 2 h after the meal to allow sufficient myocardial uptake. The MRI and CT were conventionally conducted in our hospital.
Image Analysis. The 68Ga-PRGD2 and 18F-FDG PET/CT images, as well as the 99mTc-MIBI/18F-FDG myocardial SPECT images, were transferred to a workstation (MMWP, Siemens Medical Solution) for comparison and analysis. The co-registered and matched images were visually analyzed by three experienced nuclear medicine physicians through consensus reading. In semi-quantitative analysis, the values of the PET, SPECT, and CT images were measured by the same physician. The peak standardized uptake values (pSUVs) of the 68Ga-PRGD2 accumulation were measured by obtaining the mean value of a region-of-interest (ROI) setting at the 80% threshold of a lesion. The mean values of remote normal myocardium or contralateral normal brain were measured as background and the lesion to background ratios were calculated. The maximum dimension (Dmax) of MI was measured over the 99mTc-MIBI images, whereas the Dmax of stroke was measured over the CT images by referring to the 18F-FDG images.
Statistical analysis. Correlation analysis between the pSUV of 68Ga-PRGD2 uptake and the Dmax of MI and stroke lesions was performed by bivariate correlation analysis using SPSS (version 16.0, SPSS Inc., Chicago, IL). P<0.05 was considered to be statistically significant.
Results
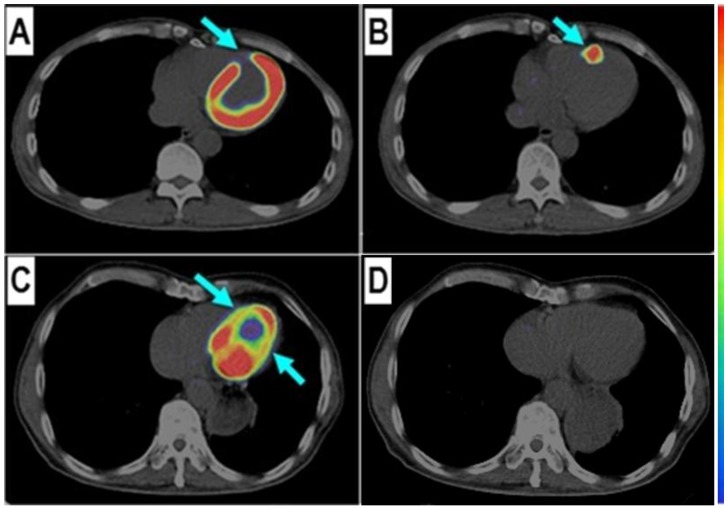
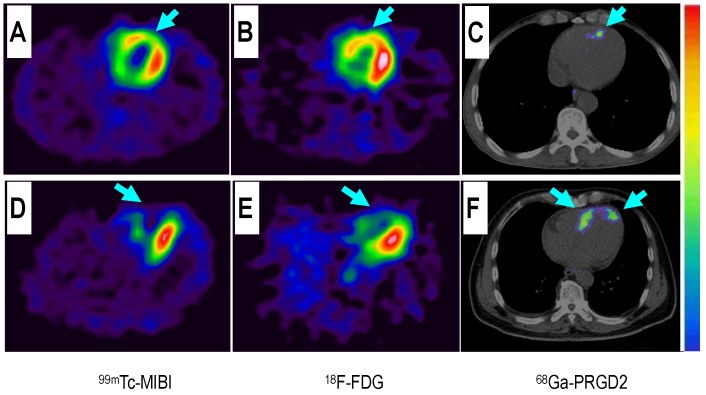
68Ga-PRGD2 PET/CT in evaluation of MI. 68Ga-PRGD2 uptake was evaluated 30 min after intravenous injection when the blood pool background and normal distribution in myocardium were relatively low (Figure 1). By referring to the matched 99mTc-MIBI and 18F-FDG images, 68Ga-PRGD2 uptake was found at or around the ischemic regions in 20 of the 23 MI patients (Figure 2). The uptake was in patchy form with pSUVs of 1.94 ± 0.48 (mean ± standard deviation [SD]; range, 0.62-2.69), which were significantly higher than the mean SUVs of the remote normal myocardium (mean ± SD, 0.94 ± 0.34; range, 0.28-1.45; P < 0.001) and the lesion to normal myocardial background ratios were calculated as 2.33 ± 1.04 (mean ± SD; range, 1.42-5.18).
Figure 1.
68Ga-PRGD2 uptake was found in the infarct region in a patient 6 days after the event but not presented in another patient 2 years after the myocardial infarction. In a 58-year-old man at the 6th day after the event, the 18F-FDG defect area (A, arrow) at the anterior septum showed definite 68Ga-PRGD2 accumulation (B, arrow) with a pSUV of 1.79. In a 69-year-old man at 2 years after the myocardial infarction, the anterior septum and inferior lateral wall with decreased 18F-FDG uptake (C, arrow) had no 68Ga-PRGD2 accumulation (D).
Figure 2.
Comparison of a patient with slight myocardial infarction (MI) and a patient with severe MI. Upper row: In a 58-year-old man at the 5th day after the event, a small apical region with decreased 99mTc-MIBI perfusion (A, arrow) and 18F-FDG metabolism (B, arrow) showed mild 68Ga-PRGD2 accumulation (C, arrow), with a pSUV of 0.62. Lower row: In a 45-year-old woman on the 7th day after the event, an apical defect on 99mTc-MIBI perfusion images (D, arrow) and 18F-FDG metabolism images (E, arrow) corresponded with moderate 68Ga-PRGD2 uptake (F, arrows), with a pSUV of 2.02.
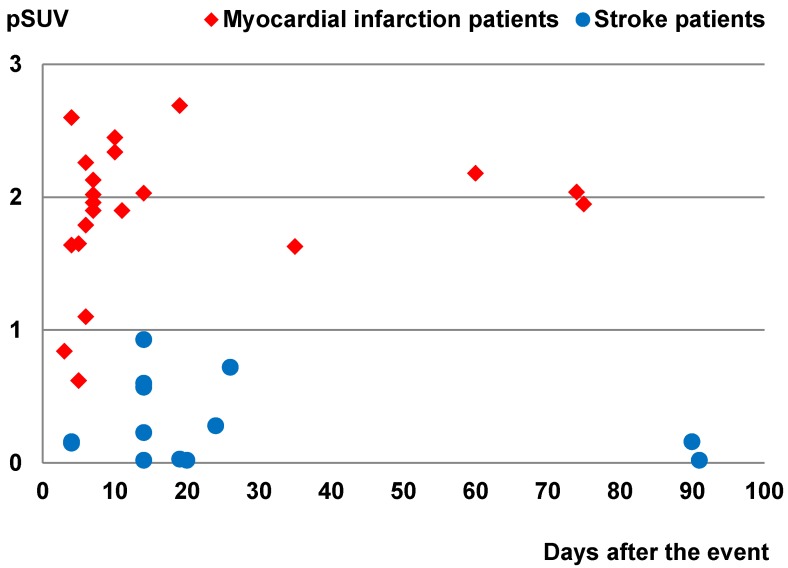
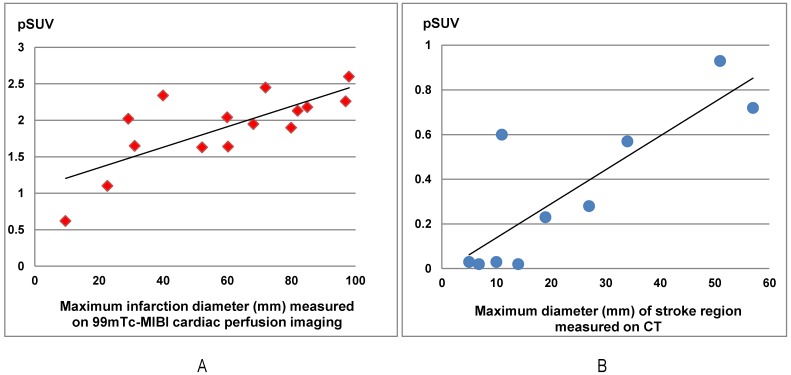
In this group of patients, higher 68Ga-PRGD2 uptake was found approximately 1 week after the MI event and remained high in the patients 2.5 months post-MI (Figure 3). In 15 MI patients within 4-75 days after the attack when the 68Ga-PRGD2 uptake seemed to be in a plateau (Figure 3), the uptake levels were significantly correlated with the maximum diameters of the infarction regions measured on the 99mTc-MIBI cardiac perfusion imaging (r=0.748, P=0.001) (Figures 2 and 4).
Figure 3.
Comparison of the peak standardized uptake values (pSUVs) of 68Ga-PRGD2 surrounding the infarction regions between the myocardial infarction patients (21 scans in 21 patients) and the stroke patients (14 scans in 12 patients) according to time after the event. Only the scans performed within 3 months after the event were included. The pSUVs were measured as the mean over a region-of-interest (ROI) with the threshold setting at 80%.
Figure 4.
The 68Ga-PRGD2 uptake around the infarction regions significantly correlated with the severity of disease in both myocardial infarction (MI) patients and stroke patients. In the15 MI patients at the 4th-75th day after the event, the pSUVs significantly correlated with the maximum diameters of the infarction regions measured on the 99mTc-MIBI cardiac perfusion imaging (r=0.748, P=0.001). In ten stroke patients at the 13th-26th day after the event, the pSUVs significantly correlated with the maximum diameters of the stroke regions measured on CT (r=0.835, P=0.003).
Among the three patients without significant 68Ga-PRGD2 accumulation at the cardiac region, one patient was on the third day after a slight MI attack without ST-elevation on the ECG, whereas the other two patients were 1-2 years post-MI without any related symptoms (Figure 1 C and D).
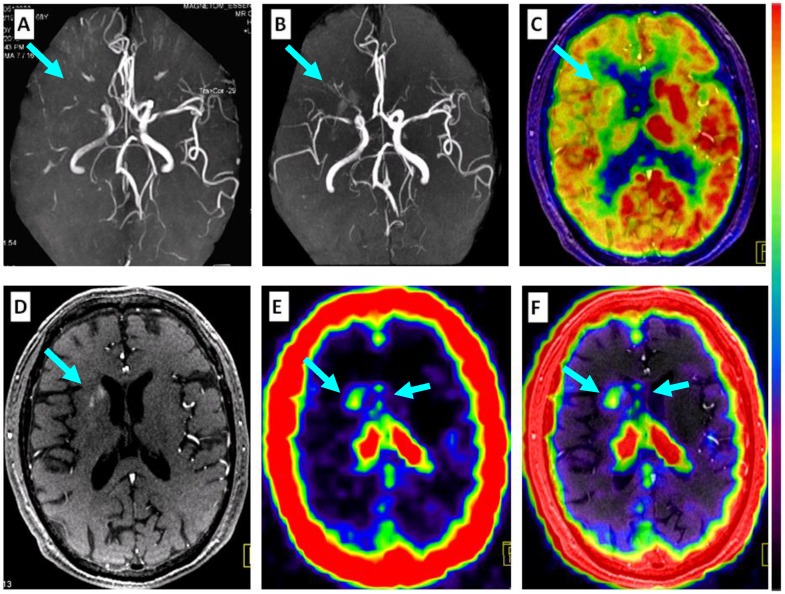
68Ga-PRGD2 PET/CT in evaluation of stroke. Except for choroid plexus, normal brain had no uptake of 68Ga-PRGD2 (Figure 5). By referring to the matched CT and 18F-FDG images, as well as MRI in some cases, the 68Ga-PRGD2 uptake was found at or around the stroke regions in 8 of 16 stroke patients. In the 8 positive patients, the uptake pattern of 68Ga-PRGD2 was in punctate multifocal form along the blood vessels, with the pSUVs of 0.46 ± 0.29 (mean ± SD; range, 0.15-0.93), which was significantly higher than the mean SUVs of the contralateral brain (mean ± SD: 0.15 ± 0.09; range, 0.05-0.30; P < 0.001) and the lesion to contralateral background ratios were 3.29 ± 1.09 (mean ± SD; range, 1.90-4.67).
Figure 5.
Comparison of 68Ga-PRGD2 PET with MRA, contrast-enhanced MRI, and 18F-FDG PET in evaluation of a 68-year-old man 2 weeks after a stroke event. Magnetic resonance angiography (MRA) on the day of the event showed obstruction of the right middle cerebral artery (A, arrow), which was still observed to be severely stenotic 2 weeks later (B, arrow). 18F-FDG PET showed diffuse low metabolism in the right hemisphere, mainly involving the frontal cortex and the basal ganglia region (C, arrow). Enhanced brain MRI showed a flaky subacute infarction area near the anterior horn of the right lateral ventricle (D, arrow). Multifocal lesions with 68Ga-PRGD2 uptake were found around the infarction region (E, F, arrows) with a pSUV of 0.57.
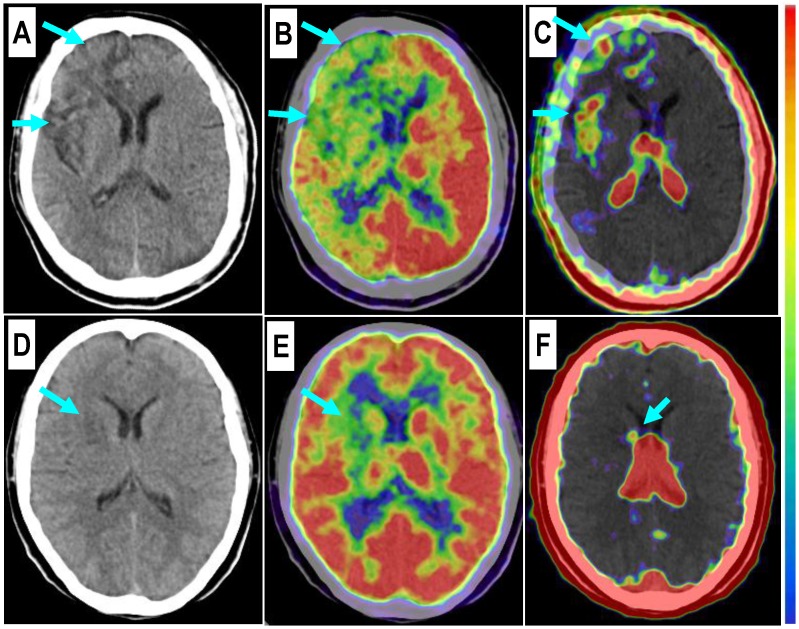
In 10 stroke patients scanned 13-26 days after the event, pSUVs were significantly correlated with the maximum diameters of the stroke regions measured on CT (r=0.835, P=0.003) (Figures 4 and 6). However, two patients on the 4th day after the event had only mildly elevated 68Ga-PRGD2 uptake (pSUV = 0.15 and 0.16, respectively), although the maximum diameter of low-density stroke region on CT reached 69.8 and 101.3 mm, respectively. In addition, two of the 8 patients with positive results underwent repeat 68Ga-PRGD2 and 18F-FDG PET/CT scans at 3 months post event; one had a decreased pSUV from 0.23 to 0.16, whereas the other patient with a small lesion at the left pons experienced a disappearance of 68Ga-PRGD2 accumulation.
Figure 6.
Comparison of a patient with a severe stroke attack and another patient with a minor event. Upper row: In a 43-year-old man at the 26th day after the event, the right frontal lobe with low density on CT (A, arrows) and significantly decreased 18F-FDG uptake (B, arrows) is found with diffuse multifocal 68Ga-PRGD2 uptake (C, arrows) with a pSUV of 0.72. Lower row: In a 37-year-old woman on the 24th day after the event, a relatively small region at the right basal ganglia shows decreased density on CT (D, arrow), low 18F-FDG uptake (E, arrow), and sparse spotted 68Ga-PRGD2 uptake around the lesion, with a pSUV of only 0.28 (F, arrow).
Among the 8 patients without definite 68Ga-PRGD2 accumulation in the brain, 4 patients had suffered the event 6 months before, whereas the other 4 patients suffered slight event resulting from relatively small lesions in the basal ganglia (n=3) or in the corona radiate (n=1).
Comparison of 68Ga-PRGD2 uptake in MI and stroke. The 68Ga-PRGD2 image patterns and uptake levels seemed to be different between MI and stroke patients. In the MI patients, the 68Ga-PRGD2 accumulated just at or immediately around the ischemia regions and was found in patchy form in the myocardium (Figure 1 and 2), whereas in the stroke patients, the 68Ga-PRGD2 was distributed in a punctate multifocal fashion, mainly along the surrounding blood vessels (Figures 5 and 6). Moreover, the 68Ga-PRGD2 uptake levels (pSUV 1.94 ± 0.48) in MI seems to be significantly higher than those in stroke (pSUV 0.46 ± 0.29, P < 0.001).
Discussion
The value of αvβ3-integrin imaging has been preliminarily indicated by prior clinical translation studies using different radiolabeled RGD peptides 6, 9, 11, 15, 16, 18, 22, 25-35. So far, most of these studies focused on diagnosis and evaluation of tumors 6, 16, 22, 25, 26, 28-31, whereas only a few reported the preliminary clinical experiences in evaluation of ischemic vascular diseases, including myocardial infarction 32, 33, carotid atherosclerosis 34, or pediatric moyamoya disease 35. In clinical evaluation of tumors, the αvβ3-integrin imaging using RGD peptides was not only found valuable in diagnosis of the primary malignancies with enhanced angiogenesis 16, 25, 26, 28, 29, but also showed benefits in evaluation of metastasis 16, 22, 30, 31. Especially in a case of benign metastasizing leiomyoma 31, the benign tumor with metastatic characteristics had only mild 18F-FDG uptake but intense RGD accumulation, corresponding to a high level of αvβ3-integrin expression on the metastatic leiomyoma cells. Since tumor accumulation of RGD peptide tracer correlates with the αvβ3-integrin expressed on both the active endothelial cells of angiogenesis and some kinds of tumor cells with metastatic characteristics 36, a reasonable interpretation of the αvβ3-integrin imaging should thus be based on a good understanding of the contribution of each part.
Similar conditions were also found in the evaluation of post-MI repair. In preclinical animal experiments, up-regulated integrin αvβ3 expression was observed in the infarct and peri-infarct regions and peaked between 1 and 3 weeks after coronary artery occlusion 7. It was reported that high-level αvβ3-integrin expression could also be found in the myofibroblasts besides the angiogenesis endothelial cells, and the accumulation of RGD-peptides seemed to correlate also with myocardial remodeling contributed by interstitial myofibroblasts, which could be inhibited by using antagonists of the renin-angiotensin-aldosterone axis, either alone or in combination 37, 38. To date, only a few articles have reported the preliminary clinical experiences of using αvβ3-integrin imaging to evaluate post-MI repair 32, 33. In a case report, the 18F-RGD signal was found to correspond to regions of severely reduced 13N-ammonia flow signal and the extent of delayed enhancement on contrast-enhanced MRI in a 35-year-old man 2 weeks post-MI; therefore the authors considered that the 18F-RGD uptake might represent the angiogenesis 32. Another article reported ten patients with 99mTc labeled RGD-peptide imaging 3 and 8 weeks post-MI, in which the RGD-peptide uptake corresponded to areas of perfusion defects but usually extended beyond the infarct zone, similar to the extent of scar observed on the late gadolinium-enhanced cardiac MRI images 1 year later 33. Therefore in MI patients, the contributions of myocardial remodeling and angiogenesis to αvβ3-integrin uptake need further investigation and clinical confirmation.
In this study, we used 68Ga-PRGD2 PET/CT to evaluate post-MI repair in patients. By comparing the matched 99mTc-MIBI and 18F-FDG images, the 68Ga-PRGD2 uptake was found to be located at or immediately around the ischemic regions, with higher uptake in patients approximately 1 week to 2.5 months after the event. The uptake levels were significantly correlated with the diameter or severity of the infarction. Interestingly, when comparing with the 68Ga-PRGD2 uptake in stroke, we found that the 68Ga-PRGD2 uptake levels seemed to be significantly higher in MI (pSUV 1.94±0.48 vs. 0.46±0.29, P<0.001). Moreover, the uptake patterns of 68Ga-PRGD2 in the MI and stroke patients are quite different. In stroke patients, the punctate multifocal 68Ga-PRGD2 uptake along the surrounding blood vessels might be mainly caused by angiogenesis, whereas in MI patients, the much higher patchy-form uptake may be explained by the fact that both angiogenesis and myocardial remodeling contributed to the uptake.
To the best of our knowledge, this article is the first report of αvβ3-integrin imaging in adult stroke patients. The prior clinical application of αvβ3-integrin imaging in ischemic cerebral vascular disease was a presentation about the use in ten children with moyamoya disease 35. In this study, we found that the RGD-peptide was absent in normal brain because of the blood-brain barrier, which allows a clear background to evaluate the post-stroke angiogenesis. However, the overall accumulation level in stroke is still very low, indicating the difficulty of forming new capillaries from the pre-existing vessels after stroke.
It is of note that this study has several limitations. First, the number of enrolled patients is relatively small. However, as a pilot clinical application, the present data, especially the significant difference of the RGD-peptide accumulation between the MI and stroke patients, warrant further clinical studies with more patients. Second, the different acquisition and reconstruction parameters between the cardiac and brain PET/CT imaging might be a possible confounding factor for the different 68Ga-PRGD2 accumulation levels in MI and stroke. This kind of variance may be up to 50% according to our phantom studies but still cannot explain the huge difference between the two groups of patients (pSUV 1.94±0.48 in MI vs. 0.46±0.29 in stroke). Third, for ethical reasons, there would be no pathological confirmation of the findings in the patients. Therefore, further studies are needed to validate the findings for future clinical applications.
Conclusion
This pilot clinical study indicates that 68Ga-PRGD2 PET/CT can provide valuable semi-quantitative information about post-MI and post-stroke repair, and thus holds a promise to guide personalized treatments to improve clinical outcomes of the ischemic vascular diseases. 68Ga-PRGD2 uptake was found at or around the ischemic region in both MI and stroke patients, significantly correlated with the disease phase and severity. The different 68Ga-PRGD2 image patterns and uptake levels between MI and stroke indicate diverse αvβ3-integrin expression levels and patterns in different ischemic vascular diseases warrant further investigation.
Acknowledgments
This work was supported, in part, by Major State Basic Research Development Program of China (973 Program) (Grant Nos. 2013CB733802 and 2014CB744503), the National Natural Science Foundation of China projects (81171370, 81271614, 81371596 and 30870725), the Capital Special Project for Featured Clinical Application (Z121107001012119), Peking Union Medical College Hospital (PUMCH-2013-011), and the Intramural Research Program (IRP), National Institute of Biomedical Imaging and Bioengineering (NIBIB), National Institutes of Health (NIH).
References
- 1.Lozano R, Naghavi M, Foreman K. et al. Global and regional mortality from 235 causes of death for 20 age groups in 1990 and 2010: a systematic analysis for the Global Burden of Disease Study 2010. Lancet. 2012;380:2095–2128. doi: 10.1016/S0140-6736(12)61728-0. [DOI] [PMC free article] [PubMed] [Google Scholar]
- 2.Murray CJ, Vos T, Lozano R. et al. Disability-adjusted life years(DALYs) for 291 diseases and injuries in 21 regions, 1990-2010: a systematic analysis for the Global Burden of Disease Study 2010. Lancet. 2012;380:2197–2223. doi: 10.1016/S0140-6736(12)61689-4. [DOI] [PubMed] [Google Scholar]
- 3.Jung C, Kwon BJ, Han MH. Evidence-based changes in devices and methods of endovascular recanalization therapy. Neurointervention. 2012;7:68–76. doi: 10.5469/neuroint.2012.7.2.68. [DOI] [PMC free article] [PubMed] [Google Scholar]
- 4.Silvestre JS, Smadja DM, Lévy BI. Postischemic revascularization: from cellular and molecular mechanisms to clinical applications. Physiol Rev. 2013;93:1743–1802. doi: 10.1152/physrev.00006.2013. [DOI] [PubMed] [Google Scholar]
- 5.Backer MV, Backer JM. Imaging key biomarkers of tumor angiogenesis. Theranostics. 2012;2:502–515. doi: 10.7150/thno.3623. [DOI] [PMC free article] [PubMed] [Google Scholar]
- 6.Iagaru A, Gambhir SS. Imaging tumor angiogenesis: the road to clinical utility. AJR Am J Roentgenol. 2013;201:W183–191. doi: 10.2214/AJR.12.8568. [DOI] [PubMed] [Google Scholar]
- 7.Gao H, Lang L, Guo N. et al. PET imaging of angiogenesis after myocardial infarction/reperfusion using a one-step labeled integrin-targeted tracer 18F-AlF-NOTA-PRGD2. Eur J Nucl Med Mol Imaging. 2012;39:683–692. doi: 10.1007/s00259-011-2052-1. [DOI] [PMC free article] [PubMed] [Google Scholar]
- 8.Cai W, Guzman R, Hsu AR. et al. Positron emission tomography imaging of poststroke angiogenesis. Stroke. 2009;40:270–277. doi: 10.1161/STROKEAHA.108.517474. [DOI] [PubMed] [Google Scholar]
- 9.Niu G, Chen X. Why integrin as a primary target for imaging and therapy. Theranostics. 2011;1:30–47. doi: 10.7150/thno/v01p0030. [DOI] [PMC free article] [PubMed] [Google Scholar]
- 10.Serini G, Valdembri D, Bussolino F. Integrins and angiogenesis: a sticky business. Exp Cell Res. 2006;312:651–658. doi: 10.1016/j.yexcr.2005.10.020. [DOI] [PubMed] [Google Scholar]
- 11.Beer AJ, Kessler H, Wester HJ, Schwaiger M. PET imaging of integrin alphaVbeta3 expression. Theranostics. 2011;1:48–57. doi: 10.7150/thno/v01p0048. [DOI] [PMC free article] [PubMed] [Google Scholar]
- 12.Zhou Y, Chakraborty S, Liu S. Radiolabeled Cyclic RGD peptides as radiotracers for imaging tumors and thrombosis by SPECT. Theranostics. 2011;1:58–82. doi: 10.7150/thno/v01p0058. [DOI] [PMC free article] [PubMed] [Google Scholar]
- 13.Liu S. Radiolabeled cyclic RGD peptides as integrin alpha(v)beta(3)-targeted radiotracers: maximizing binding affinity via bivalency. BioconjugChem. 2009;20:2199–2213. doi: 10.1021/bc900167c. [DOI] [PMC free article] [PubMed] [Google Scholar]
- 14.Shi J, Wang L, Kim YS, Zhai S, Liu Z, Chen X, Liu S. Improving tumor uptake and excretion kinetics of 99mTc-labeled cyclic arginine-glycine-aspartic (RGD) dimers with triglycine linkers. J Med Chem. 2008;51:7980–7990. doi: 10.1021/jm801134k. [DOI] [PMC free article] [PubMed] [Google Scholar]
- 15.Mittra ES, Goris ML, Iagaru AH. et al. Pilot pharmacokinetic and dosimetricstudies of (18)F-FPPRGD2: a PET radiopharmaceutical agent for imaging α(v)β(3)integrin levels. Radiology. 2011;260:182–191. doi: 10.1148/radiol.11101139. [DOI] [PMC free article] [PubMed] [Google Scholar]
- 16.Beer AJ, Lorenzen S, Metz S. et al. Comparison of integrin alphaVbeta3 expression and glucosemetabolism in primary and metastatic lesions in cancer patients: a PET study using 18F-galacto-RGD and 18F-FDG. J Nucl Med. 2008;49:22–29. doi: 10.2967/jnumed.107.045864. [DOI] [PubMed] [Google Scholar]
- 17.Lang L, Li W, Guo N. et al. Comparison study of [18F] FAl-NOTA-PRGD2, [18F] FPPRGD2, and [68Ga] Ga-NOTA-PRGD2 for PET imaging of U87MG tumors in mice. Bioconjugate chemistry. 2011;22(12):2415–2422. doi: 10.1021/bc200197h. [DOI] [PMC free article] [PubMed] [Google Scholar]
- 18.Zhu Z, Yin Y, Zheng K, Evaluation of synovial angiogenesis in patients with rheumatoid arthritis using 68Ga-PRGD2 PET/CT: a prospective proof-of-concept cohort study. Ann Rheum Dis. 2014. doi: 10.1136/annrheumdis-2013-204820. [Epub ahead of print] [DOI] [PMC free article] [PubMed]
- 19.Chen X, Liu S, Hou Y. et al. MicroPET imaging of breast cancer alphav-integrin expression with 64Cu-labeled dimeric RGD peptides. Mol Imaging Biol. 2004;6:350–359. doi: 10.1016/j.mibio.2004.06.004. [DOI] [PubMed] [Google Scholar]
- 20.Lang L, Li W, Jia HM. et al. New Methods for Labeling RGD Peptides with Bromine-76. Theranostics. 2011;1:341–53. doi: 10.7150/thno/v01p0341. [DOI] [PMC free article] [PubMed] [Google Scholar]
- 21.Jacobson O, Zhu L, Niu G. et al. MicroPET imaging of integrin alpha(v)beta(3) expressing tumors using (89)Zr-RGD peptides. Mol Imaging Biol. 2010;13:1224–1233. doi: 10.1007/s11307-010-0458-y. [DOI] [PMC free article] [PubMed] [Google Scholar]
- 22.Axelsson R, Bach-Gansmo T, Castell-Conesa J, McParland BJ; Study Group. Anopen-label, ulticenter, phase 2a study to assess the feasibility of imagingmetastases in late-stage cancer patients with the alpha v beta 3-selectiveangiogenesis imaging agent 99mTc-NC100692. Acta Radiol. 2010;51:40–46. doi: 10.3109/02841850903273974. [DOI] [PubMed] [Google Scholar]
- 23.JiaB LiuZ, ZhuZ et al. Blood clearance kinetics, biodistribution, and radiation dosimetry of a kit-formulated integrin αvβ3-selective radiotracer 99mTc-3PRGD2 in non-human primates. Mol Imaging Biol. 2011;13:730–736. doi: 10.1007/s11307-010-0385-y. [DOI] [PubMed] [Google Scholar]
- 24.Terry SY, Abiraj K, Frielink C. et al. Imaging integrin αvβ3 on blood vessels with 111In-RGD2 in head and neck tumor xenografts. J Nucl Med. 2014;55:281–286. doi: 10.2967/jnumed.113.129668. [DOI] [PubMed] [Google Scholar]
- 25.Kenny LM, Coombes RC, Oulie I. et al. Phase I trial of the positron-emitting Arg-Gly-Asp (RGD) peptide radioligand 18F-AH111585 in breast cancer patients. J Nucl Med. 2008;49:879–886. doi: 10.2967/jnumed.107.049452. [DOI] [PubMed] [Google Scholar]
- 26.Beer AJ, Grosu AL, Carlsen J. et al. [18F]galacto-RGD positron emission tomography for imaging of alphavbeta3 expression on the neovasculature in patients withsquamous cell carcinoma of the head and neck. Clin Cancer Res. 2007;13:6610–6616. doi: 10.1158/1078-0432.CCR-07-0528. [DOI] [PubMed] [Google Scholar]
- 27.Alpaugh RK, von Mehren M, Walsh JC, Haka M, Mocharla VP, Yu JQ. Biodistribution and radiation dosimetry of the integrin marker 18F-RGD-K5 determined from whole-body PET/CT in monkeys and humans. J Nucl Med. 2012;53:787–795. doi: 10.2967/jnumed.111.088955. [DOI] [PMC free article] [PubMed] [Google Scholar]
- 28.Wan W, Guo N, Pan D. et al. First experience of 18F-alfatide in lung cancer patients using a new lyophilized kit for rapid radiofluorination. J Nucl Med. 2013;54:691–698. doi: 10.2967/jnumed.112.113563. [DOI] [PMC free article] [PubMed] [Google Scholar]
- 29.Zhu Z, Miao W, Li Q. et al. 99mTc-3PRGD2 for integrin receptor imaging of lungcancer: a multicenter study. J Nucl Med. 2012;53:716–722. doi: 10.2967/jnumed.111.098988. [DOI] [PubMed] [Google Scholar]
- 30.Hou Y, Zhu Z, Jin X, Wang R, Xing B. Combined 18F-FDG PET/CT and 99mTc 3PRGD2 SPECT/CT imaging in a case of pituitary metastases. Clin Nucl Med. 2013;38:550–552. doi: 10.1097/RLU.0b013e318292aa2f. [DOI] [PubMed] [Google Scholar]
- 31.Jin X, Meng Y, Zhu Z, Jing H, Li F. Elevated 99mTc 3PRGD2 activity in benignmetastasizing leiomyoma. Clin Nucl Med. 2013;38:117–119. doi: 10.1097/RLU.0b013e318279f14d. [DOI] [PubMed] [Google Scholar]
- 32.Makowski MR, Ebersberger U, Nekolla S, Schwaiger M. In vivo molecular imaging of angiogenesis, targeting αvβ3 integrin expression, in a patient after acute myocardial infarction. Eur Heart J. 2008;29:2201. doi: 10.1093/eurheartj/ehn129. [DOI] [PubMed] [Google Scholar]
- 33.Verjans J, Wolters S, Laufer W. et al. Early molecular imaging of interstitial changes in patients after myocardial infarction: Comparison with delayed contrast-enhanced magnetic resonance imaging. J Nucl Cardiol. 2010;17:1065–72. doi: 10.1007/s12350-010-9268-5. [DOI] [PMC free article] [PubMed] [Google Scholar]
- 34.Beer AJ, Pelisek J, Heider P. et al. PET/CT imaging of integrin αvβ3 expression in human carotid atherosclerosis. JACC Cardiovasc Imaging. 2014 doi: 10.1016/j.jcmg.2013.12.003. [Epub ahead of print] [DOI] [PubMed] [Google Scholar]
- 35.Choi H, Phi JH, Paeng JC. et al. Imaging of integrin expression using positron emission tomography in pediatric cerebral infarct. Mol Imaging. 2013;12:213–217. [PubMed] [Google Scholar]
- 36.Liu Z, Jia B, Shi J. et al. Tumor uptake of the RGD dimeric probe 99mTc-G3-2P4-RGD2 is correlated with integrin αvβ3 expressed on both tumor cells and neovasculature. Bioconjug Chem. 2010;21:548–555. doi: 10.1021/bc900547d. [DOI] [PubMed] [Google Scholar]
- 37.van den Borne SW, Isobe S. et al. Molecular imaging of interstitial alterations in remodeling myocardium after myocardial infarction. J Am Coll Cardiol. 2008;52:2017–2028. doi: 10.1016/j.jacc.2008.07.067. [DOI] [PubMed] [Google Scholar]
- 38.van den Borne SW, Isobe S, Zandbergen HR. et al. Molecular imaging for efficacy of pharmacologic intervention in myocardial remodeling. JACC Cardiovasc Imaging. 2009;2:187–198. doi: 10.1016/j.jcmg.2008.11.011. [DOI] [PubMed] [Google Scholar]


