

Abstract
There is growing consensus that accurate and efficient face recognition is mediated by a neural circuit composed of a posterior “core” and an anterior “extended” set of regions. Here, we characterize the distributed face network in human individuals with congenital prosopagnosia (CP)—a lifelong impairment in face processing—relative to that of matched controls. Using functional magnetic resonance imaging, we first uncover largely normal activation patterns in the posterior core face patches in CP. We also document normal activity of the amygdala (emotion processing) as well as normal or even enhanced functional connectivity between the amygdala and the core regions. Critically, in the same individuals, activation of the anterior temporal cortex (identity processing) is reduced and connectivity between this region and the posterior core regions is disrupted. The dissociation between the neural profiles of the anterior temporal lobe and amygdala was evident both during a task-related face scan and during a resting state scan, in the absence of visual stimulation. Taken together, these findings elucidate selective disruptions in neural circuitry in CP and offer an explanation for the known differential difficulty in identity versus emotional expression recognition in many individuals with CP.
Keywords: face processing, functional connectivity, neurodevelopmental disorders, prosopagnosia, ventral visual cortex
Introduction
Faces have distinctive evolutionary and social significance and, unsurprisingly, face perception is probably the most developed perceptual skill in humans. There is growing consensus that multiple nodes of a distributed network are necessary to support face recognition (Fairhall and Ishai 2007; Ishai 2008; Van Belle et al. 2011), including core regions such as the fusiform face area (FFA) (Sergent et al. 1992; Kanwisher et al. 1997; McCarthy et al. 1997), the occipital face area (OFA), the lateral occipital sulcus (LOS), and the posterior superior temporal sulcus (pSTS) (Gauthier et al. 2000; Rossion et al. 2003; Gobbini and Haxby 2007) (Fig. 1b). Additionally, the network includes extended regions such as the anterior temporal lobe, which mediates aspects of identity, name, and biographical information (Kriegeskorte et al. 2007; Simmons et al. 2009; Nestor et al. 2011), and the amygdala, which subserves emotional aspects of face representations (Haxby et al. 2000; Fairhall and Ishai 2007; Gobbini and Haxby 2007).
Figure 1.
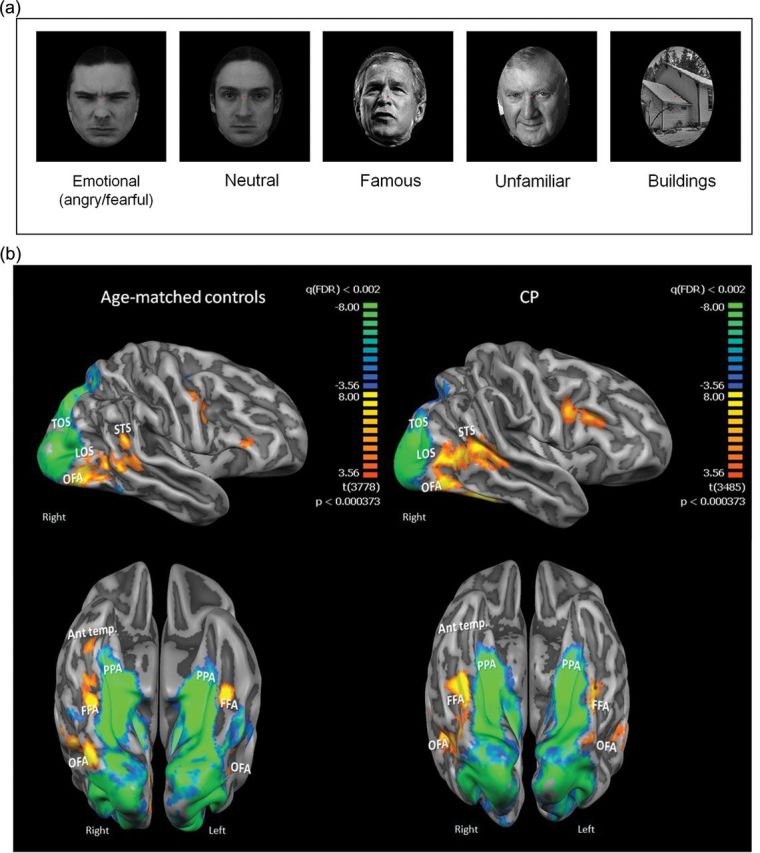
Visual stimulation experiment and activation maps in core face network and anterior temporal cortex. (a) Examples of the stimuli used in the visual stimulation experiment. (b) Averaged activation maps for controls (left panel) and CPs. The activation maps are overlaid on a group-averaged folded cortical mesh of each group and are presented in a lateral view (top row) and a ventral view (bottom row). The maps for the face activation were obtained by the contrast all faces > buildings (red to yellow colors). Note the similarity of the activation maps across groups in the core face network including bilateral OFA, LOS, FFA, and pSTS. This is in sharp contrast to the activation in anterior temporal cortex in the right hemisphere that is clearly evident in controls but is completely lacking in the CP map. Also shown is the building-selective activation obtained from the contrast buildings>all faces (blue to green colors) in the PPA and TOS, which is also very similar across groups. The 2 group maps and both contrasts are presented in the same statistical threshold. Abbreviations: Ant. temp.: anterior temporal cortex.
A critical question concerns the relative contribution of the multiplicity of these patches, and their connectivity. Although imaging studies (e.g., Hadj-Bouziane et al. 2008; Tsao et al. 2008; Freiwald and Tsao 2010) and studies using pharmacological inactivation of subparts of the system (Liu et al. 2011) in nonhuman primates have begun to address this issue, many questions remain unanswered. Here, we characterize the face network in individuals with congenital prosopagnosia (CP), who are impaired at face recognition despite intact sensory and intellectual functions (Bentin et al. 1999; Behrmann and Avidan 2005; Behrmann et al. 2005; Le Grand et al. 2006; Dobel et al. 2007; Duchaine et al. 2007; Avidan et al. 2011). Previous studies have revealed normal BOLD activation in the core network in CP (Hasson, Avidan et al. 2003; Avidan et al. 2005; DeGutis et al. 2007; Avidan and Behrmann 2009), (but see (Hadjikhani and De Gelder 2002; Bentin et al. 2007; Minnebusch et al. 2009; Furl et al. 2011), thus implying that prosopagnosia results from compromised connectivity between the core and extended systems. Relevantly, relative to controls, CPs evince reduced integrity of white matter fiber tracts projecting through the core regions to the anterior temporal lobe (Thomas et al. 2009), as well as reduced volume in the anterior temporal cortex (Bentin et al. 1999; Behrmann et al. 2007).
Interestingly, the deficit in CP appears to be largely, if not totally, restricted to difficulties in recognition of facial identity but not facial expression (Nunn et al. 2001; Duchaine et al. 2003; Bentin et al. 2007; Humphreys et al. 2007). This dissociation predicts a selective disruption in connectivity between the core and those parts of the extended network-mediating identity recognition (Haxby et al. 2000), with preservation of connectivity to those parts mediating emotional expression. Here, we compared the functional integrity and connectivity of the face network in CP and controls when participants performed a face task or were at rest (Simmons et al. 2009; Zhang et al. 2009). This latter approach targets regions that are behaviorally relevant but under conditions in which there are no perceptual or cognitive demands (Zhu et al. 2011).
Materials and Methods
Participants
All participants had normal or corrected-to-normal vision. The protocol was approved by the Institutional Review Boards of Carnegie Mellon University and the University of Pittsburgh, and all participants provided informed consent.
Congenital Prosopagnosia
Seven healthy individuals diagnosed with CP (2 males), aged between 23 and 62 years, participated in this study (mean age ± SD = 43.3 ± 13.1). Five individuals with CP were right-handed and 2 were left-handed (ON, MN) as confirmed by the Edinburgh Handedness inventory. No CP individual had any discernible lesion on conventional MRI scanning, and none had a history of any neurological or psychiatric disease by self-report. All CP participants reported substantial lifelong difficulties with face processing. Detailed behavioral profiles were obtained for all individuals from 4 different experiments: a famous face questionnaire, the Cambridge Face Memory test (CFMT), the Cambridge Face Perception Test (CFPT), and a task measuring discrimination of novel upright and inverted faces. To determine whether each CP participant is impaired, for each of these tests, we calculated z-scores for each participant based on data from large control groups. As is common in the neuropsychology literature, we established a cutoff of 2 SD away from the control mean and included only participants whose performance exceeded the cutoff on at least 2 of the 4 diagnostic measures. The data for 6 of the 7 CPs have been reported previously (see Table 1 for demographic information, performance on famous face questionnaire, and details regarding prior publications of the same individuals).
Table 1.
Demographic details of CP individuals and performance on the famous faces questionnaire
| Participant | Sex | Age | Famous faces questionnaire |
|
|---|---|---|---|---|
| % correct | z-Score | |||
| MTa,b,c,d,e,f,g | M | 50 | 62.5 | −1.64h |
| KEb,d | F | 67 | 42.9 | −3.12i |
| ON | F | 48 | 60.7 | −1.77h |
| BTb | M | 32 | 55.3 | −2.18i |
| MNa | F | 50 | 60.7 | −1.77h |
| TDa,b | F | 38 | 46.4 | −2.85i |
| WAa | F | 23 | 45.7 | −2.91i |
| CPs mean ± SD | 44 ± 14.36 | 53.46 ± 8.28 | −2.32 ± 0.63i | |
| Controls mean ± SD | 41 ± 12.6 | 91.06 ± 6.1 | 0.52 ± 0.46 | |
The table shows the age and gender of participants and their performance (raw values and z-normalized scores relative to a large control group) on the famous face questionnaire. Results show that all CP individuals are impaired on this task the letter “h” next to the numbers in the last column indicates values > 1.6 SD and < 2 SD from control mean; the letter “i” indicates values > 2SD from control mean. Note that 6 of the 7 CPs who took part in the present study have participated in various other behavioral (3 CPs), and imaging (3 CPs) studies, as indicated by the letters next to each CP name; additional behavioral performance of the CP individuals can be found in these references. Specific details regarding diagnostic and inclusion criteria can be found in the Materials and Methods section and in the related studies. The average performance on the famous faces questionnaire of the 7 controls who participated in the present study is also provided (t-test comparing performance across the CP and controls, P < 0.0001).
hValues that are >1.6 SD and <2 SD from the control mean.
iValues that are >2 SD from the control mean.
Controls
Seven healthy individuals, ages 23–62 years (mean ± SD 41.1 ± 12.6), participated in the imaging experiment. These individuals all performed within the normal range on both the famous face questionnaire and the CFMT. The CP and age-matched controls did not differ in age (P = 0.76) but did differ significantly on the famous faces questionnaire (P < 0.0001; see Table 1 for mean performance).
Imaging Experiment
Visual Stimulation
Visual stimuli were generated using the E-prime IFIS software (Psychology Software Tools, Inc., Pittsburgh, PA, USA) and projected via LCD to a screen located in the back of the scanner bore behind the subject's head. Subjects viewed the stimuli through a tilted mirror mounted above their eyes on the head coil. Prior to the scan, subjects completed a short training session to familiarize themselves with the experimental task.
MRI Setup
Subjects were scanned either in a 3T Siemens Allegra scanner equipped with a standard head coil (5 CPs, 2 controls) or in a 3T Siemens Verio scanner equipped with a standard head coil (2 CPs, 5 controls), using similar scanning parameters. BOLD contrast on the Allegra scanner was acquired using gradient-echo echo planar imaging sequence. Specific scanning parameters: whole brain coverage 33 slices, AC-PC orientation, 3.5 mm thickness, no gap, TR = 2000 ms, TE = 30 ms, flip angle = 79°, FOV = 224 × 224 cm2, matrix size 64 × 64. On the Verio scanner, parameters for the EPI were coverage 31 slices, AC-PC orientation, 3.5 mm thickness, no gap, TR = 2000 ms, TE = 29 ms, flip angle = 90°, FOV = 224 × 224 cm2, matrix size 96 × 96. High-resolution anatomical scans (3D MPRAGE) were also acquired on each subject to allow accurate cortical segmentation, reconstruction, and volume-based statistical analysis. These were all acquired with iso-voxels (1 × 1 × 1 mm); FOV = 256 × 256 mm2, matrix size = 256 × 256.
The acquisition order during the scanning session for all participants was 1) high-resolution 3D anatomy; 2) resting state experiment run 1; 3) visual stimulation run 1; 4) resting state experiment run 2; 5) visual stimulation run 2; and ) DTI scan. The DTI data were acquired for a different project and will not be further discussed here. The first resting state scan was run prior to any face experiment to avoid “contamination” through priming or imagery of faces and, hence, we only analyze and report these data here.
Visual Stimulation Experiment
Stimuli, presented in 10 s blocks, consisted of 10 images of either emotional faces (angry, fearful), matched neutral faces, famous faces, or matched unfamiliar faces (Avidan and Behrmann 2008) or buildings (Fig. 1a). In addition, there were rest periods that spanned 6s. Each image was presented for 800 ms followed by 200 ms interstimulus interval. Famous faces were highly familiar and the images of the unknown faces were of foreign celebrities; all images were downloaded from the internet or scanned from magazines (Avidan and Behrmann 2008). Images in the blocks of the emotional and neutral faces were taken from the Karolinska Directed Emotional Faces (KDEF) database and therefore, were well controlled in terms of the portrayed emotion and moreover, the same individuals were used in the emotional and neutral conditions. Building images were also downloaded from the internet. All images were transformed into grayscale and inserted into a black oval mask as shown in Figure 1a using Adobe Photoshop. To maintain subjects’ attention, a 1-back task was performed; an image was repeated once in a random position within a block and participants pressed a button with the right index finger to indicate detection of the repeat. There were 7 repetitions of each experimental condition and the whole visual stimulation experiment was run twice for each participant.
Resting State Experiment
Participants viewed a plain dark blue screen for 10min and simply stared at it. The scan was carried out with the exact same parameters as the visual stimulation scan and was also run twice (see above for the order of scans).
fMRI Data Analysis
Data analysis was performed using the BrainVoyager QX software package (Brain Innovation, Maastricht, The Netherlands) and complementary in-house software written in Excel (Microsoft Corporation) and Matlab (MathWorks). Preprocessing included 3D motion correction and filtering of low frequencies up to 3 cycles per experiment (slow drift) and was followed by concatenation of the 2 experimental runs of the visual stimulation task for each subject.
ROI Analysis
Using the average activation obtained from the concatenation of the 2 visual stimulation scans, we first identified, in each hemisphere in each individual, regions of interest (ROIs) showing a selective response in a contrast of all face conditions > buildings at q(FDR) < 0.05. Owing to either excessive motion or signal artifact, we excluded one visual stimulation scan for 1 control and 2 CPs and, hence, the analysis of their data is based on a single run. Face-selective foci included regions of the core face network: bilateral FFA located in the mid fusiform gyrus, OFA, in the inferior occipital gyrus (IOG), a region selective for faces in the vicinity of the LOS and face-selective activation in pSTS. In addition, we defined face-selective activation in the extended system in the anterior temporal cortex, in a region previously described in other studies (Rajimehr et al. 2009; Simmons et al. 2009), and in the amygdala. Finally, to examine the specificity of our findings to the face network, we also defined 2 building-selective regions, one in the vicinity of the anterior parahippocampal gyrus (PPA) and the other in the transverse occipital sulcus (TOS) (Hasson, Harel et al. 2003; Epstein et al. 2005). Given that the building-related activation is widespread and extensive, we limited the sampling of these ROIs to the most anterior voxels located in the PPA and to voxels limited to the TOS by defining a maximal cluster size of 1000 anatomical voxels (∼37 functional voxels of 3 × 3 × 3 mm). Understandably, then, any comparison of cluster size for these ROIs across the groups is uninformative.
Comparisons of the activation profiles in each ROI were done using standard repeated measures ANOVA as outlined in the Results section. In addition, we adopted a method for calculating inferential confidence intervals (ICIs) that was developed by Tryon and colleagues (Tryon 2001; Tryon and Lewis 2008) and applied this method to our data using an approach taken in a recent DTI study (Urbanski et al. 2011). This method addresses some of the problems of traditional null hypothesis testing and enables one to infer statistical differences, but even more critically for the purpose of the present study, statistical equivalence between 2 groups. For each ROI, we calculated the 95% (α = 0.05) inferential confidence interval and then compared these values across the 2 groups. According to this method, nonoverlapping ICIs denote statistical difference, while an overlap between the ICIs indicates statistical equivalence.
Table 2 includes the mean Talairach coordinates of the face-selective ROIs, the mean functional cluster size in mm3 of each of these foci, the mean face/building selectivity, and the number of participants in each group for whom we could demarcate each ROI. Critically, all coordinates were very similar across both groups. Face/building selectivity was calculated using d′ (obtained from signal detection theory) as a measure of sensitivity with a more positive index indicating greater face selectivity, a more negative index indicating greater building selectivity, and a d′ of 0 indicating no preferred activation for either buildings or faces. Specifically, we used the following equation where µ and σ are the mean and standard deviation of the response (Grill-Spector et al. 2006). Note that the signal for the preferred stimuli was the average activation across all categories of the face stimuli.
 |
Table 2.
Comparison of ROIs obtained from the visual stimulation scans for CPs and controls
| |
Talairiach |
Cluster size | Selectivity | n | ||||
|---|---|---|---|---|---|---|---|---|
| x | y | z | ||||||
| FFA | R | CP | 39.5 ± 3.2 | −45.3 ± 4.8 | −19.7 ± 5.6 | 97.1 ± 53.6 | 2.2 ± 0.6 | 6 |
| Control | 39.9 ± 3.8 | −44.6 ± 7.2 | −21.4 ± 4.6 | 58.2 ± 38.7 | 1.9 ± 0.3 | 7 | ||
| L | CP | −41.9 ± 3.2 | −47.1 ± 7.4 | −20.9 ± 3.1 | 41.4 ± 34.4 | 1.9 ± 0.8 | 7 | |
| Control | −39.7 ± 2.4 | −45 ± 9.6 | −18.9 ± 4.5 | 39.3 ± 34.1 | 1.7 ± 0.8 | 7 | ||
| OFA | R | CP | 40.4 ± 3.7 | −74.0 ± 4.8 | −14.0 ± 7.0 | 27.5 ± 25.4 | 1.5 ± 0.5 | 7 |
| Control | 40.5 ± 3.8 | −73.6 ± 4.0 | −16.6 ± 7.0 | 75.5 ± 45.8 | 2.5 ± 0.4 | 7 | ||
| L | CP | −41.5 ± 4.8 | −73.7 ± 7 | −15.5 ± 3.6 | 44.6 ± 37.4 | 1.7 ± 0.9 | 6 | |
| Control | −48.7 ± 18.2 | −64.6 ± 16.0 | −20.6 ± 6.8 | 29.9 ± 22.0 | 1.7 ± 0.7 | 7 | ||
| LOS | R | CP | 48.1 ± 5.4 | −61.7 ± 6.6 | 3.1 ± 4.2 | 56.7 ± 31.9 | 1.3 ± 0.5 | 7 |
| Control | 47.0 ± 3.7 | −62.3 ± 5.8 | 1.6 ± 5.2 | 42.1 ± 27.5 | 1.8 ± 0.7 | 7 | ||
| L | CP | −49.1 ± 7.8 | −73.5 ± 6.4 | 1.5 ± 2.7 | 31.1 ± 32.0 | 1.0 ± 0.7 | 6 | |
| Control | −46.7 ± 1 | −70.2 ± 9 | 2.4 ± 3 | 24.2 ± 24.3 | 1.2 ± 0.8 | 7 | ||
| STS | R | CP | 49.6 ± 7 | 44.6 ± 10.8 | 9.7 ± 5.9 | 20.2 ± 27.7 | 1.1 ± 0.6 | 6 |
| Control | 46.3 ± 4.6 | −44.3 ± 5.5 | 5.5 ± 5.8 | 23.5 ± 15.3 | 1.7 ± 0.7 | 6 | ||
| L | CP | −53.6 ± 4.7 | −49.2 ± 7.1 | 8.6 ± 2.9 | 17.3 ± 18.1 | 1.1 ± 0.5 | 5 | |
| Control | −51.2 ± 4.6 | 49.4 ± 10.0 | 6.4 ± 5.9 | 9.7 ± 9.9 | 1.1 ± 0.4 | 5 | ||
| Ant. temp. | R | CP | 33.3 ± 2.5 | 5.7 ± 6.1 | −34 ± 2 | 1.7 ± 1.8 | 0.8 ± 0.1 | 3 |
| Control | 30.8 ± 3.4 | 0 ± 3.2 | −33.4 ± 4.9 | 11.7 ± 17.7 | 1.0 ± 0.4 | 5 | ||
| L | CP | −32.5 ± 6.4 | 6.5 ± 4.9 | −36 ± 0 | 1.7 ± 2.3 | 0.8 ± 0.2 | 2 | |
| Control | −32 ± 0 | −2 ± 0 | −27 ± 0 | 9.09 ± 12.9 | 1.4 ± 0 | 1 | ||
| AMG | R | CP | 20.4 ± 2.3 | −4.0 ± 4.7 | −9.0 ± 1.2 | 3.0 ± 1.7 | 0.8 ± 0.4 | 5 |
| Control | 18.8 ± 2.1 | −5 ± 2 | −10.8 ± 3.3 | 3.9 ± 5.2 | 0.8 ± 0.5 | 4 | ||
| L | CP | −20.5 ± 0.7 | −6.5 ± 3.5 | −8.0 ± 0 | 1.3 ± 0.7 | 1.0 ± 0.1 | 2 | |
| Control | −19.5 ± 1 | −5.0 ± 2.5 | −11.3 ± 2.5 | 3.8 ± 4.9 | 1.1 ± 0.5 | 4 | ||
| PPA | R | CP | 23.7 ± 4.5 | −32.3 ± 3.6 | −15.0 ± 2.5 | 25.3 ± 4.8 | −2.4 ± 0.9 | 7 |
| Control | 26.6 ± 1 | −33.6 ± 6.9 | −14.9 ± 5.1 | 25.9 ± 5.7 | −2.9 ± 0.8 | 7 | ||
| L | CP | −23.7 ± 4.1 | −36.7 ± 5.9 | −13.9 ± 4.4 | 25.6 ± 4.5 | −2.4 ± 0.6 | 7 | |
| Control | −22.8 ± 4.8 | −37.4 ± 4.0 | −14.0 ± 3.1 | 23.4 ± 4.7 | −2.8 ± 0.9 | 7 | ||
| TOS | R | CP | 33.1 ± 5.6 | −82.0 ± 3.5 | 10.4 ± 4.9 | 20.0 ± 6.9 | −2.3 ± 0.3 | 7 |
| Control | 30.3 ± 6.6 | −82.9 ± 3.0 | 7 ± 5.0 | 16.0 ± 8.9 | −3.1 ± 1.1 | 7 | ||
| L | CP | −34.0 ± 6.5 | −84.8 ± 4.9 | 10.1 ± 6.4 | 17.8 ± 7.4 | −2.3 ± 0.5 | 7 | |
| Control | −36.4 ± 4.3 | −83.14 ± 2.5 | 9.4 ± 4.7 | 11.8 ± 8.9 | −2.6 ± 1.1 | 7 | ||
The table presents detailed comparisons of the CPs and control groups across various dependent measures including: mean Talairach coordinates of the face and building-selective ROIs, the mean cluster size of each ROI, mean face/building selectivity, and the number of participants in each group exhibiting each ROI. See text for statistical analyses of these measures across groups.
Following the identification of the functional ROIs, as outlined above, the time course of the BOLD response was extracted from each region for each subject. These activation profiles were then subjected to a GLM analytic model, with each experimental condition defined as a predictor. The peak of the hemodynamic response was defined separately for each subject, based on the response profile in the “neutral faces’” condition, and the average of this time point in each experimental condition, along with its preceding and consecutive time points, was used as the dependent measure for all statistical analyses. The peak activation was averaged across subjects in each group to yield the graphs presented in Figures 2 and 3b,d. As outlined above, our main goal was to compare the activity in regions of the extended face network including the anterior temporal cortex and amygdala across CP and controls. However, activation in these regions is particularly weak and noisy compared with that in the core regions and, hence, we could only identify these regions robustly after concatenating the data of the 2 visual stimulation runs. For example, when analyzing the data of only a single scan, only 1 control and 1 CP participant exhibited activation in the right, amygdala whereas 4 and 5 participants respectively exhibited this activation when the 2 runs were concatenated. Given this limitation, it was not possible to use 1 scan for defining the ROIs and then the second scan for extracting the activation profile within each ROI. Similarly, both scans were also used for the analysis of the functional connectivity pattern between regions. Because the critical comparisons in this study are across groups, to the extent that any statistical bias exists, the 2 groups are subject to the same bias. Moreover, we conducted a second analysis in which the first run of the visual stimulation scan was used to define the ROIs within the core system, which exhibit robust activation that can be reliably defined from a single run, and the second visual stimulation scan was used for data extraction, and, reassuringly, the resulting activation profiles were similar to those obtained using the average of the 2 visual stimulation runs.
Figure 2.

Activation profiles in FFA: Activation profiles from bilateral FFA obtained from the visual stimulation experiment using the contrast all faces > buildings for the age-matched controls (a) and CPs (b). The profiles were obtained individually for each participant and then averaged across the group. Percent signal change is shown for each experimental condition. As is evident, the activation profile is very similar across the 2 groups and statistical analysis did not reveal any group differences. Interestingly, in both groups, famous faces elicited a stronger signal compared with all other face categories (P < 0.0007) and, additionally, emotional faces elicited a stronger signal compared with neutral faces (P < 0.005). Error bars indicate standard error across participants in each group.
Figure 3.
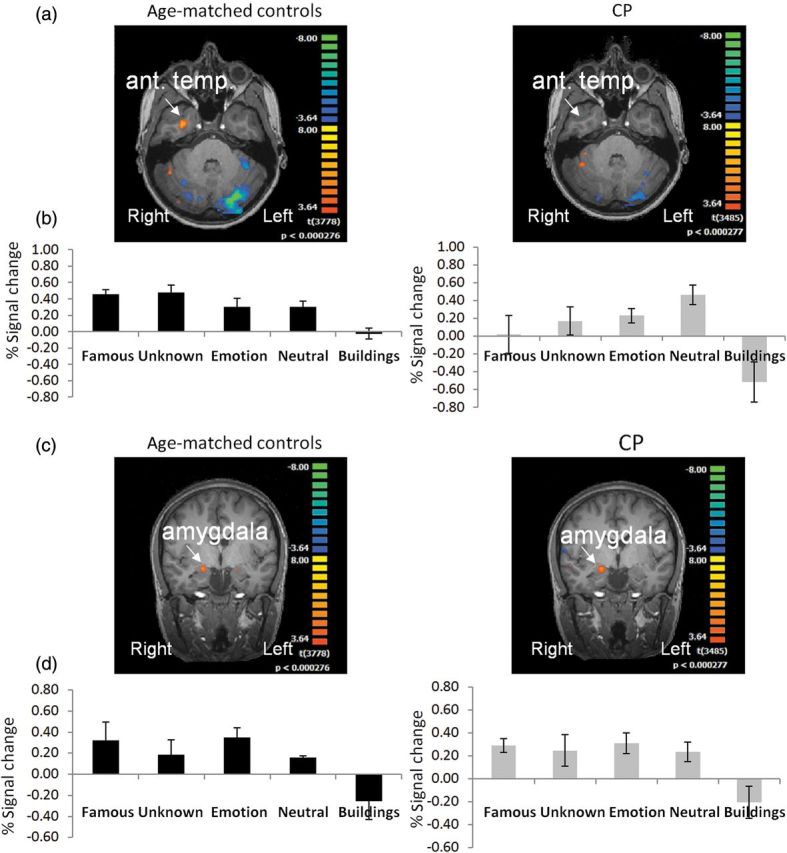
Activation maps and profiles in anterior temporal cortex and amygdala: (a) Activation maps in right anterior temporal cortex obtained for the contrast all faces > buildings; maps are projected on a horizontal slice. Robust activation can be seen in controls (left panel) in the right anterior temporal cortex, while only very weak activation is observed in CPs when applying the same statistical threshold. Note that in the activation map shown in Figure 1b, no activity is evident in this region at the group level in the CP. When examined individually, only 3 CP individuals exhibited activation in this region and contributed to the activation profile presented here. (b) Activation profiles obtained from anterior temporal cortex in controls (left) and CP (right). (c) Activation maps obtained in right amygdala for each group projected on a coronal slice. Given that the maps presented in Figure 1b only exhibit cortical activation, averaged activity of the amygdala could not be observed, and it is therefore projected on a coronal slice for each group. (d) Activation profiles obtained from individually defined right amygdala in each participant in each group. Robust and comparable amygdala activation was found in both groups as evident from the activation maps and profiles. Conventions and statistical analysis as in Figure 2.
Whole Brain Analysis
A general linear model (GLM) was used to explore face selectivity in the entire cortex and to generate statistical parametric maps. The data were modeled using a standard factorial design with each experimental condition defined as a separate predictor. The maps shown in Figure 1 were generated by contrasting all face conditions > building condition and the data are projected on group-averaged folded meshes. These meshes were created separately for each hemisphere and group, using a cortex-based alignment algorithm implemented in BrainVoyager software. Next, each subject's individual mesh time course was incorporated into a group GLM, which allows for the creation of functional activation maps in cortically aligned space. The amygdala cannot be viewed on these averaged cortical maps, and hence, the averaged-group maps shown in Figure 3a,c are projected on a horizontal and coronal slice of a single subject.
Functional Connectivity Analysis
In order to calculate functional connectivity from the visual stimulation scans, the activation profiles of each ROI were extracted, as outlined above and then a pairwise correlation coefficient was calculated between each pair of ROIs. Again, this situation, in which the connectivity is measured using the ROIs defined in the same experiment, is due to the limited statistical power of a single visual stimulation scan to reveal activation in the extended face network. As noted above, the critical comparisons are across groups and so any potential statistical bias would equally affect both groups. The functional correlation was calculated based on the entire, uninterrupted time course. These group-averaged coefficients are plotted in Figure 4. A similar approach was used for calculating the connectivity pattern of the resting state data, after extracting the activation profiles during the resting state scan from the different ROIs, as defined by the visual stimulation experiment.
Figure 4.

Functional connectivity maps obtained from localizer (a) and resting state scan (b). Matrices show all pairwise correlations between regions within the core face network (red rectangle), regions in the extended face network (blue rectangle), and regions that are building-selective (green rectangle). All ROIs were sampled from the visual stimulation experiment, and activation profiles were extracted from this experiment (a) and from the resting state scans (b). The color code indicates the level of correlation calculated between each pair of regions in each subject and then averaged across groups.
To assess the statistical significance of the correlation results across the 2 groups, we first applied the Fisher's z′ transformation to the correlation coefficients (thereby converting the correlation coefficient values into a normally distributed variable, amenable to parametric statistical testing) and then performed 1-way ANOVA on the subjects’ mean correlation values for the core face network, the building-selective network, and across these 2 networks. In addition, given the different pattern of activity obtained in the amygdala and the right anterior temporal cortex, both of which belong to the extended face network, we separately examined the correlation pattern of each of these regions and did not aggregate them together. See Table 3 for the mean correlation values in each group and the results of the statistical comparison and see also Table 4 for additional testing of the correlation of each core face ROI with the rest of the core network. Note that the mean correlation values shown in all tables and in Figure 4 depict the raw, untransformed correlation values, but these are only used for presentation purposes and were not included in any statistical analysis.
Table 3.
Values from a 1-way ANOVA comparing correlation values between controls and CP in visual stimulation (top section) and resting state (bottom section) experiments
| Network | Mean control | Mean CP | F | P | Partial η2 |
|---|---|---|---|---|---|
| Visual stimulation experiment | |||||
| Faces (R + L core) | 0.53 | 0.51 | 0.08 | 0.77 | 0.001 |
| Ant. temp. (R) individual | 0.34 | 0.26 | 6.87 | 0.02 | 0.34 |
| Ant. temp. (R) matched group | 0.28 | 0.23 | 5.09 | 0.04 | 0.27 |
| Amygdala (R) | 0.27 | 0.35 | 10.94 | 0.005 | 0.43 |
| Amygdala (R + L) | 0.28 | 0.29 | 0.26 | 0.61 | 0.008 |
| Buildings (PPA + TOS) | 0.54 | 0.56 | 0.13 | 0.72 | 0.01 |
| Between | 0.13 | 0.15 | 0.37 | 0.54 | 0.004 |
| Resting state experiment | |||||
| Faces (R + L core) | 0.43 | 0.39 | 2.29 | 0.13 | 0.04 |
| Ant. temp. (R) individual | 0.25 | 0.23 | 0.14 | 0.70 | 0.01 |
| Ant. temp. (R) matched group | 0.13 | 0.19 | 2.40 | 0.14 | 0.14 |
| Amygdala (R) | 0.21 | 0.28 | 8.78 | 0.02 | 0.38 |
| Amygdala (R + L) | 0.24 | 0.24 | 0.00 | 0.98 | 0.000 |
| Buildings (PPA + TOS) | 0.42 | 0.43 | 0.05 | 0.82 | 0.005 |
| Between | 0.29 | 0.29 | 0.02 | 0.88 | 0.000 |
The table presents the statistical values obtained by comparing the correlation levels of CPs and controls using a 1-way ANOVAs. Each row depicts the mean correlation values across all comparisons in each group. The analysis was conducted across all regions of the core face network (first row in each section); the core network with the anterior temporal cortex (defined individually for each participant, or defined based on the control group ROI) and amygdala; the connectivity within the building-related network; and the connectivity between the entire face and building networks. Significant differences are indicated in bold.
Table 4.
Values of a 1-way ANOVA comparing correlation values between each ROI within the core network with the other regions within the core network during the visual stimulation experiment
| Network | Mean control | Mean CP | F | P | Partial η2 |
|---|---|---|---|---|---|
| FFA_R | 0.57 | 0.63 | 1.13 | 0.30 | 0.08 |
| FFA_L | 0.55 | 0.55 | 0.01 | 0.92 | 0.008 |
| FFA (R + L) | 0.55 | 0.58 | 0.50 | 0.48 | 0.02 |
| OFA_R | 0.50 | 0.45 | 0.48 | 0.50 | 0.03 |
| OFA_L | 0.53 | 0.58 | 0.56 | 0.46 | 0.04 |
| OFA (R + L) | 0.54 | 0.53 | 0.00 | 0.93 | 0.00 |
| LOS_R | 0.57 | 0.54 | 0.36 | 0.55 | 0.03 |
| LOS_L | 0.50 | 0.45 | 0.98 | 0.34 | 0.07 |
| LOS (R + L) | 0.53 | 0.50 | 0.79 | 0.38 | 0.03 |
| STS_R | 0.47 | 0.36 | 11.57 | 0.005 | 0.49 |
| STS_L | 0.44 | 0.41 | 0.56 | 0.46 | 0.04 |
| STS (R + L) | 0.45 | 0.39 | 4.88 | 0.03 | 0.16 |
A 1-way ANOVA including all relevant pairwise correlations across groups was conducted for each hemisphere and then combined across hemispheres. As is evident, only the R-STS exhibited connectivity pattern that was weaker in CP compared with controls. Significant differences are indicated in bold.
Results
We designed a visual stimulation paradigm, which included a wide variety of face stimuli, known to activate both core and extended regions (Fairhall and Ishai 2007; Gobbini and Haxby 2007; Ishai 2008; Avidan and Behrmann 2009) (Fig. 1a). This enabled us to compare neural responsivity and functional connectivity in CP and control subjects in multiple regions of the core and extended systems. In addition, we compared the functional connectivity of these same regions in this paradigm with a second condition in which participants were in a rest state, in the absence of any experimental input. Seven CPs and 7 matched controls completed 2 runs of the visual stimulation experiment and 2 runs of rest scans (see Materials and Methods section and Table 1 for biographical information of participants and behavioral performance).
The Functional Architecture of the Face Network in CP
Behavioral Profile During Visual Stimulation Scanning
We compared the behavior of the CP and control groups on the 1-back task using a repeated measures ANOVA with group (controls, CP) as a between-subject factor and stimulus type (famous faces, unfamiliar faces, emotional faces, neutral faces, buildings) as the within-subject factor. With accuracy as the dependent measure, there was a significant group × stimulus interaction (F4,48 = 2.8, P < 0.036) and no main effects (F < 1). Although no post hoc comparison reached significance, numerically the biggest difference between the groups emerged in the famous face condition where, on average, CPs scored 70.4 ± 15.2% correct whereas controls scored 89.8 ± 2.8% correct. In RT, there was neither a main effect of group nor interaction with group (F < 1).
Activation in Core Face Regions in Visual Stimulation Scans
Using the BOLD profile, in each region of interest (ROI), we plotted the average activation maps of the 2 groups, and compared the magnitude of activation, anatomical site of activation in Talairach space, face selectivity, and the size of ROIs (see Table 2 and Materials and Methods section for details of the analyses).
Figure 1b shows the average activation maps for controls (left panel) and CPs, overlaid on group-averaged inflated cortical representation (see Materials and Methods section for details). The maps depict the core regions revealed for the (all face stimuli > buildings) contrast, using the same statistical threshold for both groups (P < 0.0004 uncorrected, q(FDR) < 0.002). Consistent with previous studies (e.g., Haxby et al. 2000; Rossion et al. 2003; Avidan et al. 2005), bilateral activation is evident in the 4 key core regions: FFA in the mid-fusiform gyrus, OFA in the IOG; the LOS and pSTS. As shown in Figure 1b, these 4 ROIs are clearly visible in both groups and there are no obvious group differences. While these group maps are useful for visualization purposes, to quantify the neural profile of this activity, each ROI was identified in each participant in each hemisphere (all faces > buildings q(FDR) < 0.05 in each participant). These core ROIs were identifiable in the majority of subjects and the Talairach coordinates were similar across the groups (see Table 2 for details on number of participants showing each ROI and Talairach coordinates). Percent signal change from each face-selective ROI for each experimental condition was extracted for each participant using a GLM approach (see Materials and Methods section) and subjected to a repeated measures ANOVA with group (CP, controls) as a between-subject factor, and hemisphere (right, left), and face type (famous, unknown, emotional, neutral) as within-subject factors. We did not include the building condition in this analysis as the contrast faces > buildings was used to select these regions and, by definition, a significant difference between these 2 stimulus categories would be obtained. We focus only on statistical effects related to group differences. The analysis for the FFA revealed no main effect of group (F1,11 = 2.1, P = 0.17) or any interaction of group with the other factors (all group interactions F < 1) (see Fig. 2). To further confirm the similarity of the activation pattern between CPs and controls in core face regions, we applied another statistical approach in which inferential confidence intervals (ICIs) are compared across the 2 populations separately for each region (Tryon 2001; Tryon and Lewis 2008). A graph depicting the results of this analysis as calculated for the average signal for faces is provided in Supplementary Figure 1. Importantly, there is substantial overlap of the ICIs in all core regions thus providing strong evidence of statistical equivalence between the 2 groups according to this method.
Importantly, there were also no significant group differences in cluster size or face selectivity (d′) as verified by separate repeated measures ANOVA comparing each of these variables across groups (all group effects P < 0.19). In accordance with previous studies, the FFA cluster in the right hemisphere was larger than that of the left but this held equally across both groups (main effect of hemisphere F1,11 = 9.98, P < 0.009) (see Table 2). As with the FFA, there were no significant group differences when examining the fMRI activation profiles in the OFA and LOS, (main effect of group P> 0.15; all group interactions P > 0.28). In the pSTS, there was a marginally significant hemisphere × face type × group interaction (F3,21 = 2.42, P = 0.09) that was due to a stronger signal in the left hemisphere for the CP compared with controls, especially for the famous faces condition (post hoc analysis: P = 0.06). No differences emerged in the right hemisphere. There was also a marginal main effect of group (F1,7 = 4.38, P = 0.07), with stronger signal for CPs than controls, but this effect is qualified by the 3-way interaction described above.
Analyses of the other dependent measures revealed that, in the right OFA, the cluster size was marginally larger in controls than in CPs (group × hemisphere interaction [F1,11 = 8.51, P < 0.01]; post hoc test P = 0.06), and there was stronger face selectivity in the right hemisphere for the controls compared with CP (group × hemisphere interaction [F1,11 = 7.21, P < 0.02]; post hoc P < 0.003). In the LOS, there were no group differences in any of these measures (P > 0.36 for all group effects), and as with the FFA, there were more face-selective voxels in the right than left hemisphere, (cluster size: main effect of hemisphere [F1,11 = 4.91, P < 0.05]). Finally, the pSTS was somewhat less right lateralized in CPs than controls (significant hemisphere × group interaction; F1,7, P < 0.04); however, none of the post hoc comparisons reached significance.
We note that, in contrast to another study (Furl et al. 2011), there were no correlations between the fMRI signal in core regions and the extent of the behavioral impairments of the CP subjects. This is probably not surprising given that the general pattern of activity in these regions in these individuals is normal and the range in activation magnitude is rather limited across individuals.
To confirm that activation for nonface stimuli is normal in CP, we sampled activation in 2 building-related regions: the parahippocampal place area (PPA) and transverse occipital sulcus (TOS). As above, we used only the activation for buildings and not for faces, because the contrast (buildings > all faces) was used to extract the signal in these regions. An ANOVA with group (CP, controls) as the between-subject factor and hemisphere (right, left) as the within-subject factor revealed no group differences in the PPA (P > 0.3 for all group effects) or TOS (P > 0.18 for all group effects) and analysis of the other dependent measures revealed no differences in these regions either (Table 2, P > 0.15 for all group effects). ICIs were also calculated for the signal of these 2 building-related regions and are shown in Supplementary Figure 2. As is evident, there is substantial overlap between the ICIs of the 2 groups indicating statistical equivalence between the activation patterns in these regions. These findings confirm that activation in the occipito-temporal cortex for nonface stimuli was normal in the CPs.
To summarize, the activation pattern exhibited by the CPs in the core face network (FFA, LOS, OFA, and pSTS) resembled, to a large extent, that of the controls in terms of the magnitude of the activation examined both using ANOVA and ICIs, as well as cluster size, laterality, and selectivity. Although we noted in CP a reduction in OFA cluster size and selectivity and an increase in face activation in left pSTS, taken together, these findings provide an important replication of our previous results showing normal activation of core regions in CP (Hasson, Avidan et al. 2003; Avidan et al. 2005; Avidan and Behrmann 2009). Activation in regions mediating nonface stimuli is also normal in CP.
Activation in Extended Face Regions
In contrast to the pattern from core regions, we see differentiable profiles in the CP and controls in the extended regions. As evident from the average activation maps (Fig. 1b and Fig. 3a,c), the anterior temporal lobe and amygdala activation were more evident in the right than left hemisphere (see Table 2 for breakdown). Consequently, we only conducted the analyses for the right foci.
Unlike the robust activation obtained in core regions, there was very weak activation in the anterior temporal lobe region for the CP group; also, whereas only 3 of the 7 CPs exhibited this activity, 5 controls showed robust activity in this region (see Fig. 3b and Table 2). An ANOVA comparing this anterior temporal activation between the 2 groups revealed a significant group × face-type interaction (F3,18 = 6.02, P < 0.005), with no main effects of group (F1,6 = 2.84, P > 0.14) or face type (F3,18 = 1.39, P > 0.28). Importantly, the interaction resulted from a stronger signal in the famous faces condition for the controls versus CPs (P < 0.024) and a similar trend for the unknown faces (P = 0.08), while the signal for emotional and neutral faces did not differ across groups (P > 0.6 and P > 0.18, respectively). To further confirm this difference in activation across groups, which stems from the significant group × stimulus-type interaction, we calculated ICIs for the signal for the famous faces in this region and compared these values across both groups (Supplementary Figure 3). Critically, the ICIs for the famous faces do not overlap between groups, thus providing additional support for the differences between the 2 groups in the activation profile in these 2 regions.
As evident in Table 2, the locus of the anterior temporal lobe activation, defined in Talairach coordinates did not differ across groups, and its position is consistent with that reported in other studies (e.g., Rajimehr et al. 2009; Mur et al. 2010). We analyzed the other dependent measures only for the right hemisphere, using a separate 1-way ANOVA for each measure. Despite the overall reduced activation exhibited by the 3 CPs who evinced activity in the vicinity of this region, the cluster size and face selectivity of the activation did not differ from that of controls (group effect, P > 0.37 for both measures, Table 2).
To ensure that we were not missing activation in the anterior temporal lobe in CP, we also sampled the activation for each CP based on the group ROI of the right anterior temporal cortex obtained from the 7 controls (focus depicted in Fig. 1b, lower left panel and Fig. 3a). This procedure revealed a noisy and inconsistent response profile in the CPs; thus, even when imposing an external, control ROI on the activation profile, the signal in this region was clearly abnormal.
In striking contrast with this abnormality, activity in the right amygdala did not differ across the CP and control groups (Fig. 3c,d) (main effect of group or group interaction [F < 1], main effect of face type [F3,21 = 1.93, P > 0.16]). ICI analysis that was carried out only for the signal for the famous faces, as was done for the right anterior temporal cortex, revealed statistical equivalence between the 2 groups (Supplementary Figure 3). Finally, no group differences were found for cluster size and selectivity measures (d′) (P > 0.23 for both tests).
Finally, as seen in Figure 1b (top panel), both CP and controls exhibited face-selective activation in right prefrontal cortex and this activation appeared stronger in CP. Similar activation was seen in the left prefrontal cortex in the CPs but not in the controls. This enhanced frontal activation in CP replicates a previous result (Avidan et al. 2005) and while this is of potential interest, it is beyond the scope of the present investigation. Importantly, as noted in the Materials and Methods section, participants were scanned either in a 3T Siemens Allegra scanner (5 CPs, 2 controls) or in a 3T Siemens Verio scanner (2 CPs, 5 controls), but critically, all differences found across groups cannot be account for by the particular scanner used.
The major result from the analysis of the extended network is that regions related to processing identity and person knowledge (Haxby et al. 2000) evinced impaired activation in CP, whereas activation in the amygdala, related to emotional processing, was entirely intact. This dissociation uncovers the specificity of the impairment in CP and provides a neural candidate for the observed behavioral dissociation between identity and emotion processing in individuals with this disorder.
The Functional Connectivity of the Face Network in CP
Having elucidated the neural profiles of the face-selective regions, in both the core and extended face networks, we then examined the functional connectivity within and between regions. Additionally, as a control circuit, we quantified the connectivity of a network that mediates nonface processing. All analyses were first carried out on the data obtained from visual stimulation scans and then on those acquired from the resting state scan, and we compared the findings from the 2 analyses. Because it is not possible to examine the activation profiles of the face-selective regions in the absence of visual input, with the resting state data, we only examined the functional connectivity between regions defined by the visual stimulation experiment.
Visual Stimulation Experiment
To examine functional connectivity, we averaged the 2 scans and sampled the activity from each ROI (see Materials and Methods section for details). We then performed pairwise correlation analyses, using the continuous uninterrupted signal as a function of time, between all ROIs within and between all regions of the core and extended face networks, separately for each group. Correlation analyses were also performed between PPA and TOS and between these regions and the face-selective regions. The average correlation level obtained for each pair of regions is plotted in matrix form for the controls and CPs in Figure 4a; for clarity, we place a border around regions belonging to each functional network (red: core, blue: extended, green: building network). As evident in Figure 4a, the correlation levels within the core face network (bilateral FFA, OFA, LOS, and pSTS) were similar across the 2 groups. A 1-way ANOVA examining all pairwise correlations of the core regions across hemispheres across the 2 groups revealed no group differences when the entire core system was examined (F < 1; Table 3, visual stimulation experiment, top row).
We also examined the pattern of connectivity of each core face ROI with the other components of the core face network (1-way ANOVA of all pairwise correlations of each ROI with the other ROIs across groups, Table 4). Importantly, this analysis revealed no group differences in the connectivity pattern of bilateral FFA, OFA, and LOS (all P > 0.3, see Table 4). There was, however, a significant group difference with reduced connectivity of the right pSTS with the rest of the core face system for the CPs (P < 0.005, Table 4). Finally, we examined the connectivity pattern of each core face region with its homolog in the contralateral hemisphere (1-way ANOVA with cross-hemisphere correlations of each ROI across group) and, again, there were no group differences in bilateral FFA, OFA, and LOS (P > 0.22). Weaker cross-hemisphere connectivity was found in the pSTS in the CP compared with controls (mean connectivity = 0.28, 0.53, respectively, F1,7 = 7.64, P < 0.02) as also evident when comparing the matrices of the 2 groups presented in Figure 4a. To summarize, FFA, OFA, and LOS showed the equivalent connectivity pattern in the CP compared with controls, whereas the pSTS showed some reduction in connectivity.
Of central interest, however, is the pattern of connectivity of the core network to the right anterior temporal cortex and to the amygdala. There was a significant difference between the groups in the correlation between the entire core network and the anterior temporal cortex (1-way ANOVA examining all pairwise correlations of each of the core face regions with the anterior temporal cortex across the 2 groups), with reduced correlation levels for the CP compared with controls (Table 3, top section, r = 0.26, r = 0.34 for CPs and controls, respectively, P < 0.02). This same analysis, using the time course obtained from the anterior temporal cortex of each CP as defined based on the control group ROI, unsurprisingly, also revealed reduced functional connectivity between the core and anterior temporal region in CP compared with controls (Table 3, top section, r = 0.23, r = 0.28 for CP and controls, respectively, P < 0.04). A comparison of each of the core ROIs with the right anterior temporal cortex revealed that all correlations were weaker in CPs than controls although these differences did not reach statistical significance (Table 5, top section).
Table 5.
Values of a 1-way ANOVA comparing correlation values between each core face region with regions of the extended system
| Region | Mean control | Mean CP | F | P | Partial η2 |
|---|---|---|---|---|---|
| Connectivity pattern of each core face region with right anterior temporal cortex | |||||
| FFA_R | 0.41 | 0.33 | 0.49 | 0.50 | 0.07 |
| FFA_L | 0.37 | 0.27 | 0.56 | 0.48 | 0.08 |
| OFA_R | 0.35 | 0.22 | 1.59 | 0.25 | 0.21 |
| OFA_L | 0.32 | 0.30 | 0.01 | 0.90 | 0.00 |
| LOS_R | 0.36 | 0.31 | 0.31 | 0.60 | 0.05 |
| LOS_L | 0.22 | 0.14 | 0.32 | 0.60 | 0.06 |
| STS_R | 0.33 | 0.24 | 0.30 | 0.60 | 0.06 |
| STS_L | 0.27 | 0.19 | 0.38 | 0.58 | 0.11 |
| Connectivity pattern of each core face region with right amygdala | |||||
| FFA_R | 0.26 | 0.42 | 12.33 | 0.01 | 0.63 |
| FFA_L | 0.27 | 0.42 | 4.39 | 0.07 | 0.38 |
| OFA_R | 0.21 | 0.27 | 1.11 | 0.33 | 0.13 |
| OFA_L | 0.24 | 0.26 | 0.47 | 0.52 | 0.07 |
| LOS_R | 0.29 | 0.37 | 0.58 | 0.47 | 0.07 |
| LOS_L | 0.25 | 0.34 | 0.49 | 0.50 | 0.08 |
| STS_R | 0.32 | 0.26 | 0.22 | 0.65 | 0.04 |
| STS_L | 0.26 | 0.34 | 0.32 | 0.59 | 0.06 |
As is evident, numerically, all core regions in CPs exhibited reduced correlation with the anterior temporal cortex. Note however that this analysis is limited since only 3 of the 7 CPs exhibited activity in the anterior temporal cortex and, hence, were included in this analysis. The connectivity level between FFA-R and right amygdala was significantly stronger in CP compared with controls and a similar trend was also evident in the left FFA. Note that, numerically, the correlation level in CP is higher compared with controls in all regions of the core system except for the right STS. Significant differences are indicated in bold.
Intriguingly, comparing the correlation of the core network and right amygdala revealed elevated correlations for CP versus controls (Table 3, top section, r = 0.35, r = 0.27, for CPs and controls, respectively, P < 0.005), as shown in Figure 4a, and the correlation of each core region to the right amygdala, except for right STS, exhibited elevated connectivity level in CP compared with controls (Table 5, bottom section).
The connectivity pattern within the building-related network did not differ across the 2 groups (Table 3, P = 0.72), and the connectivity between the entire face-selective network (both core and extended) and the building-selective network also did not differ across groups (P = 0.54) (analysis using a 1-way ANOVA for all pairwise comparisons of each face-selective region to each building-selective region; see regions in Figure 4 that are outside the red, blue, and green rectangles).
Resting State Experiment
In this final analysis, we performed the identical analyses as above using the same ROIs extracted from the experimental scan to sample the resting state activity. While each subject participated in 2 resting state scans, the first resting state scan was conducted at the beginning of the scanning session before participants viewed any images, while the second resting state scan was conducted after the visual stimulation experiment. To avoid possible confounds which might arise due to post-stimulus exposure, in this analysis, we only examine the connectivity obtained during the first run of the resting state scans.
We first compared the correlation patterns observed in the resting scan with those of the visual stimulation scans. While, unsurprisingly, there was reduced functional connectivity in the resting state scan compared with the visual stimulation scan for both groups (both because of the absence of stimulation and the relative reduction in statistical power as only 1 run is used; compare Fig. 4a,b and Table 6), the overall pattern of connectivity was qualitatively similar (2 sections of Table 3). Consistent with previous studies (Nir et al. 2006), the correlation levels within functional networks (i.e., face network, building network) were generally higher during the visual stimulation experiment than resting state scan, whereas correlation levels between functional networks (i.e., between the face and building networks) were higher during rest compared with the visual stimulation scan in both groups. This confirms the observation of greater overall coherence within specific functional networks and greater decoherence between functional networks during active scanning conditions.
Table 6.
t-Test comparing correlation values between resting state scan and the visual stimulation scans for controls (top section) and CP (bottom section)
| Network | Mean rest | Mean localizer | F | P | Partial η2 |
|---|---|---|---|---|---|
| Rest vs. visual stimulation scans in matched controls | |||||
| Faces (core) | 0.43 | 0.53 | 19.63 | 0.0000 | 0.27 |
| Ant. temp. (R) individual | 0.25 | 0.35 | 15.01 | 0.001 | 0.51 |
| Ant. temp. (R) matched group | 0.13 | 0.28 | 49.95 | 0.00006 | 0.78 |
| Amygdala (R) | 0.21 | 0.27 | 9.46 | 0.008 | 0.40 |
| Amygdala (R + L) | 0.24 | 0.28 | 2.21 | 0.14 | 0.06 |
| Buildings (PPA + TOS) | 0.42 | 0.54 | 2.24 | 0.16 | 0.18 |
| Between | 0.29 | 0.13 | 42.71 | 0.0000 | 0.33 |
| Rest vs. visual stimulation scans in CPs | |||||
| Faces (core) | 0.39 | 0.51 | 11.62 | 0.001 | 0.18 |
| Ant. temp. (R) individual | 0.23 | 0.26 | 0.35 | 0.56 | 0.02 |
| Ant. temp. (R) matched group | 0.19 | 0.23 | 0.43 | 0.52 | 0.03 |
| Amygdala (R) | 0.28 | 0.35 | 18.39 | 0.000 | 0.57 |
| Amygdala (R + L) | 0.24 | 0.29 | 1.24 | 0.27 | 0.14 |
| Buildings (PPA + TOS) | 0.43 | 0.56 | 1.72 | 0.22 | 0.15 |
| Between | 0.29 | 0.15 | 37.63 | 0.0000 | 0.30 |
This analysis directly evaluates the change in functional connectivity in the task-related activation versus rest scans in CPs and controls. Significant differences are indicated in bold.
Of even greater relevance is that, while controls exhibited increased connectivity in the right anterior temporal cortex in the visual stimulation study than in the rest scans, this was not true in CP (see Table 6 for statistical analysis). Also, in the rest scan, elevated connectivity between right amygdala and the core face network in CP compared with controls was evident again (Table 3, lower section r = 0.21, r = 0.28, for controls and CPs, P < 0.02). There were no other significant differences across the 2 groups. Overall, the functional connectivity analyses of both the visual stimulation experiment and resting state scan reveal a normal pattern of connectivity of the core face network in the CPs while revealing reduced connectivity of the right anterior temporal cortex and elevated connectivity of the right amygdala.
Discussion
There is growing consensus from investigations with human and nonhuman primates that face processing is mediated by a distributed network comprising a posterior “core” and an anterior “extended” network, with multiple regions/patches in each subnetwork. Consistent with this, damage to a component of this circuitry, either posterior or anterior, leads to impairments in face recognition (Barton and Cherkasova 2003; Fox et al. 2008; Thomas et al. 2009; Gainotti and Marra 2011; Van Belle et al. 2011). Here, we characterized the activation pattern and functional connectivity of the core and extended networks in CP individuals, who have longstanding difficulties in the recognition of facial identity (e.g., Avidan et al. 2011) but not facial expressions (Nunn et al. 2001; Duchaine et al. 2003; Bentin et al. 2007; Humphreys et al. 2007).
We obtained 4 major results. First, we replicated the largely normal activation profile in the core regions in CP, confirming that the core network may be necessary but not sufficient to support normal face recognition. Second, we revealed a reduction in activation in the right anterior temporal cortex (see Fig. 3a,b), specifically for known faces, as well as compromised connectivity between the core and the right anterior temporal cortex. Third, activity in the amygdala appeared entirely intact in CP (Fig. 3c,d) and connectivity to the core was intact or even potentially enhanced. Finally, the dissociation between the core and anterior temporal cortex versus amygdala was evident in activation maps, activation profiles, and functional connectivity during an engaging face task and during a rest scan.
The Core Face System in CP
Although the present findings of normal face activation in the core face network in CP replicate previous findings (Hasson, Avidan et al. 2003; Avidan et al. 2005; DeGutis et al. 2007; Avidan and Behrmann 2009), some studies have observed differences in these regions between CPs and controls with abnormal face selectivity in core regions (Hadjikhani and De Gelder 2002; Bentin et al. 2007), reduced activity in FFA and OFA (Minnebusch et al. 2009; Furl et al. 2011) or reduced face-selective response in bilateral FFA and smaller cluster size in right FFA (Furl et al. 2011). Across a large range of dependent measures and using both standard ANOVA as well as an additional approach using ICIs to determine statistical equivalence, we demonstrated that face activation in core face regions does not differ between CPs and controls (see Fig. 1b and Table 1). We did note a few minor group differences but these were inconsistent: while the overall functional profile of the right OFA did not differ across groups, CPs exhibited a smaller cluster size and reduced face selectivity, although the connectivity between the core and extended regions and OFA was equivalent across groups (Table 1). Also, compared with controls, the CPs have relatively increased left pSTS activation (and hence a reduced laterality effect of pSTS), which may be related to the altered pSTS reported previously (also see Furl et al. 2011). Finally, the connectivity of the right pSTS to the other core regions appears to be somewhat weaker in CP compared with controls and the cross-hemisphere connectivity of this region (left vs. right STS) is marginally weaker in the CPs. It is unclear what to make of these effects: first, they appear in just 1 or 2 but not all dependent measures and so the pattern is inconsistent, and second, while the OFA findings indicate reduced OFA function and normal connectivity in CP, the pSTS shows enhanced activation accompanied with reduced connectivity. Thus, while there may be some subtle changes in the core network in CP, to a large extent, even if not entirely, activity in this network is equivalent to that of the controls. We note that the subtle effects we observed could very well be related to the heterogeneity and extent of severity of the impairment among the CP individuals within our sample, but given the relatively small sample size, such correlations could not be tested. Moreover, the fact that some studies have observed differences in core regions, as noted above, might reflect the heterogeneity of the participants across studies. Clearly, these findings warrant further investigation using larger groups and additional, more sensitive analytical approaches such as multivoxel pattern analysis before we can fully understand their implications.
As apparent from studies of acquired prosopagnosia, having an intact core system may be necessary for normal face perception but, clearly, this is not sufficient (see also (Fox et al. 2008; Grossi et al. 2012). At the very same time that the CPs performed abnormally on a face task (see Results section), the activation profile from the core regions was essentially normal (Avidan et al. 2005; Avidan and Behrmann 2009). Furl et al. (2011), however, have reported a positive correlation between the activity pattern in the right fusiform gyrus and in the left anterior temporal cortex (i.e., in a core and an extended region) and a behavioral face-processing index in a group of 15 individuals with developmental prosopagnosia (we use “congenital” rather than “developmental” prosopagnosia but the terms are interchangeable in the present context). The reasons for this discrepancy in the findings across studies remain to be determined and as noted above, differences in statistical power, sample heterogeneity, and prosopagnosia severity all require further investigation.
The Extended Face System in CP
We have previously proposed that the differences in the activations of the extended face network between CP and controls were key to the disorder (Avidan and Behrmann 2009). Here, we focused specifically on 2 extended regions, both of which have been difficult to image previously because of imaging/susceptibility artifacts (e.g., low SNR). Using a more intensive visual stimulation paradigm and analytic procedures, we obtained sufficient signal in these regions and have uncovered, for the first time, the abnormal activation and connectivity pattern of the right anterior temporal cortex in CP. Not only was activation in this region absent in most CPs, the profile was atypical even in those few individuals who did have signal in this region and even when we superimposed an externally defined ROI and extracted the signal from this region. Moreover, the functional connectivity between this area and the core face network was reduced, further endorsing the critical role of this region in mediating normal face processing (Kriegeskorte et al. 2007; Rajimehr et al. 2009).
In dramatic contrast to the group differences in the anterior temporal lobe, there were no group differences in the activation profile of the right amygdala and, intriguingly, the CP individuals exhibited greater functional connectivity between the core face network and the amygdala compared with controls. As most CP individuals are able to recognize emotional expression normally, this apparent enhancement may reflect the engagement of a compensatory mechanism utilized by CP individuals perhaps by focusing specifically on the emotional expression of the face. It is also possible that the connectivity between the core and the extended regions adheres to a “zero sum game” principle, and the reduced connectivity to right anterior temporal cortex is compensated for by elevated connectivity to the amygdala. Our findings dovetail well with those of (Gschwind et al. 2012) who report strong structural connectivity between occipital regions and amygdala in normal individuals, and the functional connectivity described here may be directly related to these structural links. The amygdala may also play a modulating role on face-related regions in temporal cortex, as demonstrated by a recent study in which activity from neurons in the human amygdala were recorded (Rutishauser et al. 2011); the present results are also consistent with such effects, although our current analysis does not allow us to determine the directionality of connections.
The Necessary Neural Circuitry
Recent investigations have begun to explore the differential contribution of the multiplicity of face-selective patches in human and nonhuman primates (Freiwald and Tsao 2010). Understanding the relative role of these regions, however, is not trivial as they are functionally coactivated (Simmons et al. 2009; Zhang et al. 2009) and structurally connected (Gschwind et al. 2012). There does, however, appear to be some differentiation between these regions; for example, some independence is apparent between various face-related areas, as shown by (Nestor et al. 2011), but because they focused on identity-related areas, the contribution of additional regions such as the amygdala remains to be determined. Similarly, in nonhuman primates, the neural profile of 4 face patches (2 middle patches and 2 anterior patches) differed qualitatively in their representation of identity across head orientations (Freiwald and Tsao 2010); whereas neurons in the middle patches were view-specific, neurons in one anterior patch, AL, were tuned to identity mirror-symmetrically across views, and neurons in the most anterior face patch, AM, achieved almost full view invariance. Again, although informative, this study also does not examine patches mediating identity versus emotion recognition nor possible inter-relations or dissociations between patches.
The novelty of our findings is the observation that patches can be differentially affected under neural alteration and that behavioral dissociations ensue. That we observe a functional dissociation between the core and the anterior temporal lobe is consistent with the reported structural disruption between these regions: the integrity in the inferior longitudinal fasciculus (ILF) in CP is compromised and the extent of this compromise is correlated with the severity of the prosopagnosia (Thomas et al. 2009). Similarly, structural integrity of white matter fibers and specifically the ILF was also shown to be critical in a case of progressive prosopagnosia (Grossi et al. 2012). Our findings of a selective dissociation, both under visual stimulation and rest conditions, strongly support the structural perturbations and uncover circuits in ventral cortex (Turk-Browne et al. 2010; Gschwind et al. 2012) whose disruption can give rise to very particular behavioral profiles.
Conclusions
We propose that the function and connectivity of the right anterior temporal cortex is impaired in CP. This stands in contrast to the right amygdala, whose activation profile is normal in the same individuals. Importantly, these specific patterns of integrity versus impairments in CP not only demarcates the connectivity that is necessary for intact recognition of individual faces, but also elucidates selective patterns of breakdown that can occur in the otherwise integrated circuitry. Taken together, these findings attest to the specificity of this neurodevelopmental disorder and contribute to our understanding of its underlying neural mechanism.
Supplementary Material
Supplementary material can be found at: http://www.cercor.oxfordjournals.org/.
Funding
This research was supported by a grant from the Israeli Science Foundation (ISF, 384/10) to G.A., and from grants from the National Institutes of Mental Health (MH54246), and the National Science Foundation (NSF BCS0923763; NSF SBE-0542013 to the Temporal Dynamics of Learning Center, an NSF Science of Learning Center) to M.B. F.H.-B., N.L., and L.G.U. were supported by the NIMH Intramural Research program.
Supplementary Material
Notes
We thank Lauren Lorenzi for her help with data collection, Shiran Oren and Limor Hochberg for their help with data analysis, and Dr. Bat-Sheva Hadad for her help with statistical issues. Conflict of Interest: None declared.
References
- Avidan G, Behrmann M. Functional MRI reveals compromised neural integrity of the face processing network in congenital prosopagnosia. Curr Biol. 2009;19:1146–1150. doi: 10.1016/j.cub.2009.04.060. [DOI] [PMC free article] [PubMed] [Google Scholar]
- Avidan G, Behrmann M. Implicit familiarity processing in congenital prosopagnosia. J Neuropsychol. 2008;2:141–164. doi: 10.1348/174866407x260180. [DOI] [PubMed] [Google Scholar]
- Avidan G, Hasson U, Malach R, Behrmann M. Detailed exploration of face-related processing in congenital prosopagnosia: 2. Functional neuroimaging findings. J Cogn Neurosci. 2005;17:1150–1167. doi: 10.1162/0898929054475145. [DOI] [PubMed] [Google Scholar]
- Avidan G, Tanzer M, Behrmann M. Impaired holistic processing in congenital prosopagnosia. Neuropsychologia. 2011;49:2541–2552. doi: 10.1016/j.neuropsychologia.2011.05.002. [DOI] [PMC free article] [PubMed] [Google Scholar]
- Barton JJ, Cherkasova M. Face imagery and its relation to perception and covert recognition in prosopagnosia. Neurology. 2003;61:220–225. doi: 10.1212/01.wnl.0000071229.11658.f8. [DOI] [PubMed] [Google Scholar]
- Behrmann M, Avidan G. Congenital prosopagnosia: face-blind from birth. Trends Cogn Sci. 2005;9:180–187. doi: 10.1016/j.tics.2005.02.011. [DOI] [PubMed] [Google Scholar]
- Behrmann M, Avidan G, Gao F, Black S. Structural imaging reveals anatomical alterations in inferotemporal cortex in congenital prosopagnosia. Cereb Cortex. 2007;17:2354–2363. doi: 10.1093/cercor/bhl144. [DOI] [PubMed] [Google Scholar]
- Behrmann M, Avidan G, Marotta JJ, Kimchi R. Detailed exploration of face-related processing in congenital prosopagnosia: 1. Behavioral findings. J Cogn Neurosci. 2005;17:1130–1149. doi: 10.1162/0898929054475154. [DOI] [PubMed] [Google Scholar]
- Bentin S, Degutis JM, D'Esposito M, Robertson LC. Too many trees to see the forest: performance, event-related potential, and functional magnetic resonance imaging manifestations of integrative congenital prosopagnosia. J Cogn Neurosci. 2007;19:132–146. doi: 10.1162/jocn.2007.19.1.132. [DOI] [PubMed] [Google Scholar]
- Bentin S, Deouell LY, Soroker N. Selective visual streaming in face recognition: evidence from developmental prosopagnosia. Neuroreport. 1999;10:823–827. doi: 10.1097/00001756-199903170-00029. [DOI] [PubMed] [Google Scholar]
- DeGutis JM, Bentin S, Robertson LC, D'Esposito M. Functional plasticity in ventral temporal cortex following cognitive rehabilitation of a congenital prosopagnosic. J Cogn Neurosci. 2007;19:1790–1802. doi: 10.1162/jocn.2007.19.11.1790. [DOI] [PubMed] [Google Scholar]
- Dobel C, Bolte J, Aicher M, Schweinberger SR. Prosopagnosia without apparent cause: overview and diagnosis of six cases. Cortex. 2007;43:718–733. doi: 10.1016/s0010-9452(08)70501-x. [DOI] [PubMed] [Google Scholar]
- Duchaine BC, Germine L, Nakayama K. Family resemblance: ten family members with prosopagnosia and within-class object agnosia. Cogn Neuropsychol. 2007;24:419–430. doi: 10.1080/02643290701380491. [DOI] [PubMed] [Google Scholar]
- Duchaine BC, Parker H, Nakayama K. Normal recognition of emotion in a prosopagnosic. Perception. 2003;32:827–838. doi: 10.1068/p5067. [DOI] [PubMed] [Google Scholar]
- Epstein RA, Higgins JS, Thompson-Schill SL. Learning places from views: variation in scene processing as a function of experience and navigational ability. J Cogn Neurosci. 2005;17:73–83. doi: 10.1162/0898929052879987. [DOI] [PubMed] [Google Scholar]
- Fairhall SL, Ishai A. Effective connectivity within the distributed cortical network for face perception. Cereb Cortex. 2007;17:2400–2406. doi: 10.1093/cercor/bhl148. [DOI] [PubMed] [Google Scholar]
- Fox CJ, Iaria G, Barton JJ. Disconnection in prosopagnosia and face processing. Cortex. 2008;44:996–1009. doi: 10.1016/j.cortex.2008.04.003. [DOI] [PubMed] [Google Scholar]
- Freiwald WA, Tsao DY. Functional compartmentalization and viewpoint generalization within the macaque face-processing system. Science. 2010;330:845–851. doi: 10.1126/science.1194908. [DOI] [PMC free article] [PubMed] [Google Scholar]
- Furl N, Garrido L, Dolan RJ, Driver J, Duchaine B. Fusiform gyrus face selectivity relates to individual differences in facial recognition ability. J Cogn Neurosci. 2011;23:1723–1740. doi: 10.1162/jocn.2010.21545. [DOI] [PMC free article] [PubMed] [Google Scholar]
- Gainotti G, Marra C. Differential contribution of right and left temporo-occipital and anterior temporal lesions to face recognition disorders. Front Hum Neurosci. 2011;5:55. doi: 10.3389/fnhum.2011.00055. [DOI] [PMC free article] [PubMed] [Google Scholar]
- Gauthier I, Tarr MJ, Moylan J, Skudlarski P, Gore JC, Anderson AW. The fusiform “face area” is part of a network that processes faces at the individual level. J Cogn Neurosci. 2000;12:495–504. doi: 10.1162/089892900562165. [DOI] [PubMed] [Google Scholar]
- Gobbini MI, Haxby JV. Neural systems for recognition of familiar faces. Neuropsychologia. 2007;45:32–41. doi: 10.1016/j.neuropsychologia.2006.04.015. [DOI] [PubMed] [Google Scholar]
- Grill-Spector K, Sayres R, Ress D. High-resolution imaging reveals highly selective nonface clusters in the fusiform face area. Nat Neurosci. 2006;9:1177–1185. doi: 10.1038/nn1745. [DOI] [PubMed] [Google Scholar]
- Grossi D, Soricelli A, Ponari M, Salvatore E, Quarantelli M, Prinster A, Trojano L. Structural connectivity in a single case of progressive prosopagnosia: the role of the right inferior longitudinal fasciculus. Cortex. doi:10.1016/j.cortex.2012.09.010. 2012 doi: 10.1016/j.cortex.2012.09.010. [DOI] [PubMed] [Google Scholar]
- Gschwind M, Pourtois G, Schwartz S, Van De Ville D, Vuilleumier P. White-matter connectivity between face-responsive regions in the human brain. Cereb Cortex. 2012;22:1564–1576. doi: 10.1093/cercor/bhr226. [DOI] [PubMed] [Google Scholar]
- Hadj-Bouziane F, Bell AH, Knusten TA, Ungerleider LG, Tootell RB. Perception of emotional expressions is independent of face selectivity in monkey inferior temporal cortex. Proc Natl Acad Sci USA. 2008;105:5591–5596. doi: 10.1073/pnas.0800489105. [DOI] [PMC free article] [PubMed] [Google Scholar]
- Hadjikhani N, De Gelder B. Neural basis of prosopagnosia: an fMRI study. Hum Brain Mapp. 2002;16:176–182. doi: 10.1002/hbm.10043. [DOI] [PMC free article] [PubMed] [Google Scholar]
- Hasson U, Avidan G, Deouell LY, Bentin S, Malach R. Face-selective activation in a congenital prosopagnosic subject. J Cogn Neurosci. 2003;15:419–431. doi: 10.1162/089892903321593135. [DOI] [PubMed] [Google Scholar]
- Hasson U, Harel M, Levy I, Malach R. Large-scale mirror-symmetry organization of human occipito-temporal object areas. Neuron. 2003;37:1027–1041. doi: 10.1016/s0896-6273(03)00144-2. [DOI] [PubMed] [Google Scholar]
- Haxby JV, Hoffman EA, Gobbini MI. The distributed human neural system for face perception. Trends Cogn Sci. 2000;4:223–233. doi: 10.1016/s1364-6613(00)01482-0. [DOI] [PubMed] [Google Scholar]
- Humphreys K, Avidan G, Behrmann M. A detailed investigation of facial expression processing in congenital prosopagnosia as compared to acquired prosopagnosia. Exp Brain Res. 2007;176:356–373. doi: 10.1007/s00221-006-0621-5. [DOI] [PubMed] [Google Scholar]
- Ishai A. Let's face it: it's a cortical network. Neuroimage. 2008;40:415–419. doi: 10.1016/j.neuroimage.2007.10.040. [DOI] [PubMed] [Google Scholar]
- Kanwisher N, McDermott J, Chun MM. The fusiform face area: a module in human extrastriate cortex specialized for face perception. J Neurosci. 1997;17:4302–4311. doi: 10.1523/JNEUROSCI.17-11-04302.1997. [DOI] [PMC free article] [PubMed] [Google Scholar]
- Kriegeskorte N, Formisano E, Sorger B, Goebel R. Individual faces elicit distinct response patterns in human anterior temporal cortex. Proc Natl Acad Sci USA. 2007;104:20600–20605. doi: 10.1073/pnas.0705654104. [DOI] [PMC free article] [PubMed] [Google Scholar]
- Le Grand R, Cooper PA, Mondloch CJ, Lewis TL, Sagiv N, de Gelder B, Maurer D. What aspects of face processing are impaired in developmental prosopagnosia? Brain Cogn. 2006;61:139–158. doi: 10.1016/j.bandc.2005.11.005. [DOI] [PubMed] [Google Scholar]
- Liu N, Jones KB, Hadj-Bouziane F, Turchi JN, Tootell RBH. Ungerleider LG. Hierarchical organization of face-selective regions in macaque cortex as revealed by fMRI and pharmacological deactivation. 2011 Neuroscience Meeting Planner. Washington, DC: Society for Neuroscience, 2011. Program No. 487.12. Online [Google Scholar]
- McCarthy G, Puce A, Gore JC, Allison T. Face specific processing in the human fusiform gyrus. J Cogn Neurosci. 1997;9:605–610. doi: 10.1162/jocn.1997.9.5.605. [DOI] [PubMed] [Google Scholar]
- Minnebusch DA, Suchan B, Koster O, Daum I. A bilateral occipitotemporal network mediates face perception. Behav Brain Res. 2009;198:179–185. doi: 10.1016/j.bbr.2008.10.041. [DOI] [PubMed] [Google Scholar]
- Mur M, Ruff DA, Bodurka J, Bandettini PA, Kriegeskorte N. Face-identity change activation outside the face system: “release from adaptation” may not always indicate neuronal selectivity. Cereb Cortex. 2010;20:2027–2042. doi: 10.1093/cercor/bhp272. [DOI] [PMC free article] [PubMed] [Google Scholar]
- Nestor A, Plaut DC, Behrmann M. Unraveling the distributed neural code of facial identity through spatiotemporal pattern analysis. Proc Natl Acad Sci USA. 2011;108:9998–10003. doi: 10.1073/pnas.1102433108. [DOI] [PMC free article] [PubMed] [Google Scholar]
- Nir Y, Hasson U, Levy I, Yeshurun Y, Malach R. Widespread functional connectivity and fMRI fluctuations in human visual cortex in the absence of visual stimulation. Neuroimage. 2006;30:1313–1324. doi: 10.1016/j.neuroimage.2005.11.018. [DOI] [PubMed] [Google Scholar]
- Nishimura M, Doyle J, Behrmann M. Probing the face-space of individuals with prosopagnosia. Neuropsychologia. 2010;48:1828–1841. doi: 10.1016/j.neuropsychologia.2010.03.007. [DOI] [PubMed] [Google Scholar]
- Nunn JA, Postma P, Pearson R. Developmental prosopagnosia: should it be taken at face value? Neurocase. 2001;7:15–27. doi: 10.1093/neucas/7.1.15. [DOI] [PubMed] [Google Scholar]
- Rajimehr R, Young JC, Tootell RB. An anterior temporal face patch in human cortex, predicted by macaque maps. Proc Natl Acad Sci USA. 2009;106:1995–2000. doi: 10.1073/pnas.0807304106. [DOI] [PMC free article] [PubMed] [Google Scholar]
- Rossion B, Caldara R, Seghier M, Schuller AM, Lazeyras F, Mayer E. A network of occipito-temporal face-sensitive areas besides the right middle fusiform gyrus is necessary for normal face processing. Brain. 2003;126:2381–2395. doi: 10.1093/brain/awg241. [DOI] [PubMed] [Google Scholar]
- Rutishauser U, Tudusciuc O, Neumann D, Mamelak AN, Heller AC, Ross IB, Philpott L, Sutherling WW, Adolphs R. Single-unit responses selective for whole faces in the human amygdala. Curr Biol. 2011;21:1654–1660. doi: 10.1016/j.cub.2011.08.035. [DOI] [PMC free article] [PubMed] [Google Scholar]
- Sergent J, Ohta S, Macdonald B. Functional neuroanatomy of face and object processing. A positron emission tomography study. Brain. 1992;115:15–36. doi: 10.1093/brain/115.1.15. [DOI] [PubMed] [Google Scholar]
- Simmons WK, Reddish M, Bellgowan PS, Martin A. The selectivity and functional connectivity of the anterior temporal lobes. Cereb Cortex. 2009;20:813–825. doi: 10.1093/cercor/bhp149. [DOI] [PMC free article] [PubMed] [Google Scholar]
- Thomas C, Avidan G, Humphreys K, Jung K, Gao F, Behrmann M. Reduced structural connectivity in ventral visual cortex in congenital prosopagnosia. Nat Neurosci. 2009;12:29–31. doi: 10.1038/nn.2224. [DOI] [PMC free article] [PubMed] [Google Scholar]
- Tryon WW. Evaluating statistical difference, equivalence, and indeterminacy using inferential confidence intervals: an integrated alternative method of conducting null hypothesis statistical tests. Psychol Methods. 2001;6:371–386. [PubMed] [Google Scholar]
- Tryon WW, Lewis C. An inferential confidence interval method of establishing statistical equivalence that corrects Tryon's (2001) reduction factor. Psychol Methods. 2008;13:272–277. doi: 10.1037/a0013158. [DOI] [PubMed] [Google Scholar]
- Tsao DY, Schweers N, Moeller S, Freiwald WA. Patches of face-selective cortex in the macaque frontal lobe. Nat Neurosci. 2008;11:877–879. doi: 10.1038/nn.2158. [DOI] [PMC free article] [PubMed] [Google Scholar]
- Turk-Browne NB, Norman-Haignere SV, McCarthy G. Face-specific resting functional connectivity between the fusiform gyrus and posterior superior temporal sulcus. Front Hum Neurosci. 2010;4:176. doi: 10.3389/fnhum.2010.00176. [DOI] [PMC free article] [PubMed] [Google Scholar]
- Urbanski M, Thiebaut de Schotten M, Rodrigo S, Oppenheim C, Touzé E, Méder JF, Moreau K, Loeper-Jeny C, Dubois B, Bartolomeo P. DTI-MR tractography of white matter damage in stroke patients with neglect. Exp Brain Res. 2011;208(4):491–505. doi: 10.1007/s00221-010-2496-8. [DOI] [PubMed] [Google Scholar]
- Van Belle G, Busigny T, Lefevre P, Joubert S, Felician O, Gentile F, Rossion B. Impairment of holistic face perception following right occipito-temporal damage in prosopagnosia: converging evidence from gaze-contingency. Neuropsychologia. 2011;49:3145–3150. doi: 10.1016/j.neuropsychologia.2011.07.010. [DOI] [PubMed] [Google Scholar]
- Zhang H, Tian J, Liu J, Li J, Lee K. Intrinsically organized network for face perception during the resting state. Neurosci Lett. 2009;454:1–5. doi: 10.1016/j.neulet.2009.02.054. [DOI] [PMC free article] [PubMed] [Google Scholar]
- Zhu Q, Zhang J, Luo YL, Dilks DD, Liu J. Resting-state neural activity across face-selective cortical regions is behaviorally relevant. J Neurosci. 2011;31:10323–10330. doi: 10.1523/JNEUROSCI.0873-11.2011. [DOI] [PMC free article] [PubMed] [Google Scholar]
Associated Data
This section collects any data citations, data availability statements, or supplementary materials included in this article.