Abstract
Background
The purposes of this study were to map overall malaria incidence rates from 1989 through 1999 for villages in Belize; to assess the seasonal distribution of malaria incidence by region; and to correlate malaria incidence rates with vegetation cover and rivers in villages, using geographic information system technology.
Malaria information on 156 villages was obtained from an electronic database maintained by the Belize National Malaria Control Program. Average annual malaria incidence rates per 1000 population over 10 years were calculated for villages using the 1991 population census as a denominator. Malaria incidence rates were integrated with vegetation cover from a 1995 vegetation map, and with river data from a digital data set.
Results
Mapping malaria incidence over the 10-year period in the study villages indicated the existence of a spatial pattern: the southern and western areas of Belize had consistently higher rates of malaria than northern areas. Examination of the seasonal distribution of malaria incidence by month over 10 years indicated that a statistically significant difference existed among districts and among months (p < 0.05). Spatial analysis of malaria incidence rates and of vegetation in Belize showed villages with high malaria rates having more broadleaf hill forests, agricultural land, and wetland vegetation types (i.e. SWF-seasonally waterlogged fire-induced shrubland of the plains). Statistical and spatial analyses of malaria incidence and of river distributions in Belize determined the high 10 percentile malaria incidence villages in western and southern Belize to have more rivers within two kilometers of the center of a village and a statistically significant correlation between proximity to rivers and villages (Spearman's γ = -0.23; p < 0.05), especially in Stann Creek District (Spearman's γ = -0.82; p < 0.05).
Conclusions
Examination of the distribution of malaria during 10 years indicated transmission varied among geographic areas and among seasons. Additional studies are needed to examine, in more detail, the association between environmental and meteorological factors and malaria transmission. Furthermore, the role of An. darlingi in malaria transmission in Stann Creek needs further study since, of the three main vectors in Belize, An. darlingi has been found strongly associated with rivers.
Background
Geographic information systems (GIS) are computerized systems utilized to process and manage spatial data. A GIS is capable of integrating topographical maps, satellite images, and aerial photos with attribute data such as demographic and socioeconomic characteristics and disease incidence. The systems have been used widely to produce maps of disease distribution and for analyzing spatial patterns in disease distribution [1-7]. These maps have been used as tools for developing control and intervention strategies.
In this study, a GIS was used to map malaria incidence rates for villages in Belize. The country of Belize, which is divided into six administrative districts, is geologically, environmentally and topographically diverse [8-10]. Elevation varies from 0 to 20 meters in the marshes and swamp forests of the coastal plain to 1124 meters at the highest peak in the Maya Mountains. Annual rainfall varies from 1200 millimeters in the north to 4000 millimeters in the south. Generally, the months of June through November are considered the wet season and January through April constitute the dry season. December and May are transitional months when rainfall occurs but not for prolonged periods as in the wet season. Vegetation types in Belize encompass savanna, mangrove, pine forests, and broadleaf hill forests.
Three anopheline species, considered as potential malaria vectors in Belize, have larval habitats characterized by a specific vegetation type. Anopheles albimanus, the most widely distributed mosquito in Belize, is associated with cyanobacterial mat and submerged-periphyton habitats [11]. Anopheles darlingi, primarily a riverine mosquito, has been found, during both wet and dry seasons, in shaded or partly shaded patches of floating debris and submerged plants along creek and river margins [12]. Anopheles vestitipennis, found throughout the year, is most abundant in the wet season in swamp forest and tall dense macrophyte marsh habitats [13,14].
The epidemiology of arthropod-borne diseases is directly influenced by vector characteristics. The survival, distribution, and abundance of vectors are closely linked to environmental and climatic conditions such as vegetation, rainfall, and availability of adequate aquatic environments for larval habitats. The aquatic habitats are particularly important for mosquito-borne diseases. GIS, with the ability to integrate and manage multiple geographic and attribute data sources, aid in the study of the environmental and climatic factors associated with diseases such as malaria, lymphatic filariasis, and onchocerciasis [15-19].
The purposes of this study were to map average annual malaria incidence rates for 1989 through 1999 for villages in Belize, to assess the seasonal distribution of average annual malaria incidence rates by region, and to correlate malaria incidence rates with vegetation cover and rivers in villages. We conducted the study by creating and analyzing a GIS composed of topographical maps of Belize, a 1995 vegetation map, a rivers/streams digital data set, malaria cases from 1989 through 1999 for 156 villages and the 1991 national population census.
Results
Only villages with malaria, census, and geographic location information were selected for mapping of malaria distribution for the years 1989 through 1999. The topographical maps had the locations of 213 villages in Belize (Figure 1). The study included 156 villages and excluded fifty-seven villages due to lack of population census information (Table 1). It is likely that the fifty-seven villages were not included in the census due to their small size (perhaps only a few families). The fact that none of these villages appeared in the malaria database is also an indication that these villages did not have malaria cases during the 10 years covered in this study. Higher percentages (32 to 38) of the excluded villages were located in Belize, Cayo, and Stann Creek Districts.
Figure 1.
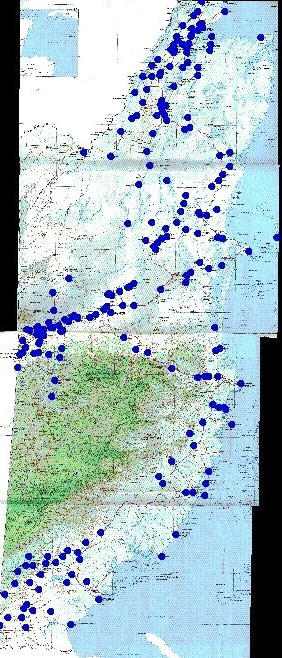
Villages (represented as blue dots) in Belize digitized on 1:250,000 topographical maps, which were electronically scanned in four sections and joined.
Table 1.
Study population from 213 villages digitized on 1:250,000 topographical maps
| Villages in study | Villages excluded* | All villages | |||
| District | n | (%) | n | (%) | n |
| Corozal | 30 | (88) | 4 | (12) | 34 |
| Orange Walk | 22 | (73) | 8 | (27) | 30 |
| Belize | 25 | (68) | 12 | (32) | 37 |
| Cayo | 34 | (62) | 21 | (38) | 55 |
| Stann Creek | 16 | (67) | 8 | (33) | 24 |
| Toledo | 29 | (88) | 4 | (12) | 33 |
*Villages without population census data were excluded from the study.
Spatial distribution of malaria rates
A spatial pattern is seen in the distribution of high and low 30 (Figure 2) and 10 (Figure 3) percentile malaria incidence (averaged annual rates) villages in the study. The villages with higher malaria incidence rates (top 30% and 10%) were located in southern (Toledo and Stann Creek Districts) and western Belize (Cayo District). The villages with lower malaria incidence rates (low 30% and 10%) during 10 years were located in the northern areas of Belize (Corozal, Orange Walk and Belize Districts).
Figure 2.
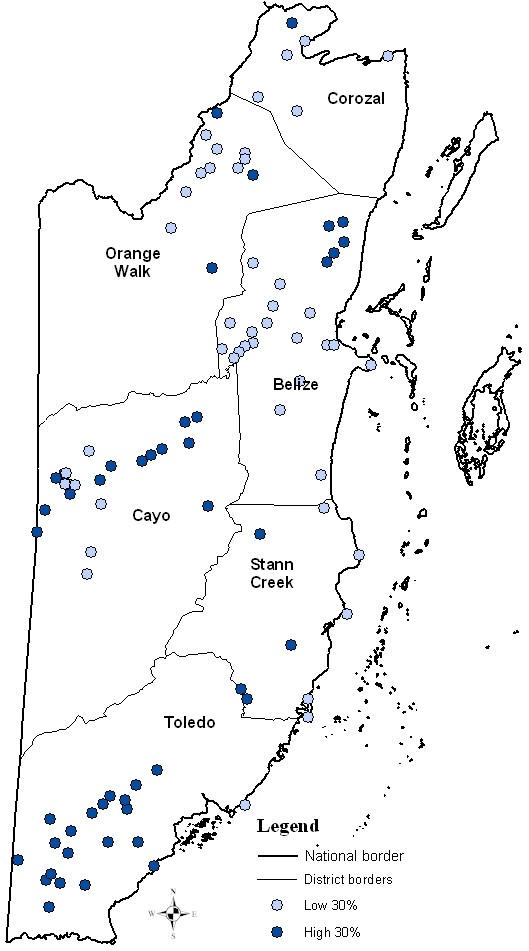
A map of the high and low 30% of average annual malaria incidence villages during 1989–1999 in Belize.
Figure 3.
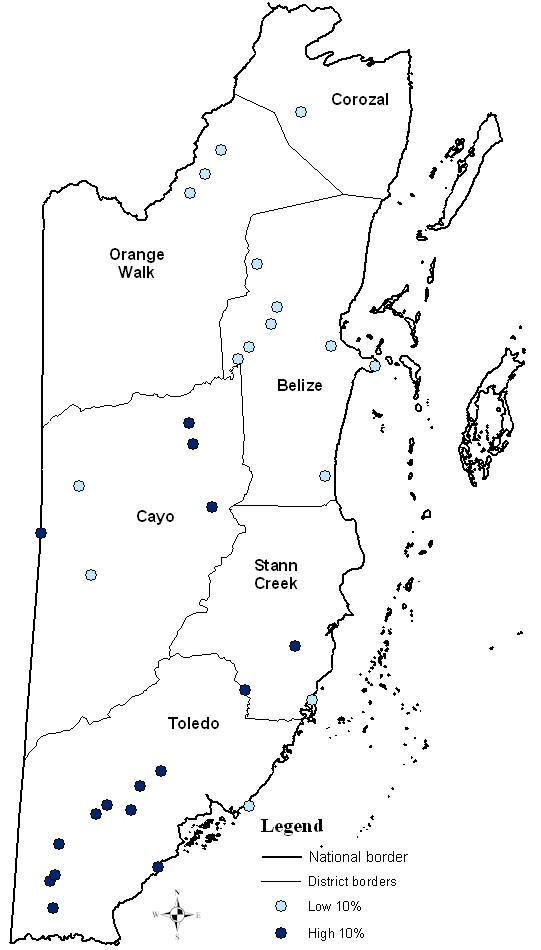
A map of the high and low 10% of average annual malaria incidence villages during 1989–1999 in Belize
Seasonal distribution of malaria incidence
Among all districts, Toledo had the highest average annual malaria incidence from 1989 through 1999 (Table 2, Figure 5). During the study period, Cayo, Stann Creek, and Toledo Districts had higher average annual malaria incidence than Corozal, Orange Walk, and Belize Districts (Table 2), which corroborates the results of mapping the high and low malaria incidence villages (Figures 2 and 3). Average monthly malaria incidence varied significantly in magnitude among districts and among months (p < 0.05). Average monthly malaria incidence for 1989 through 1999 was highest in August in Toledo District and in June in Stann Creek District.
Table 2.
Descriptive statistics of average annual malaria incidence and proximity of rivers to villages
| Average annual incidence (per 1000 population) during 1989–1999 | Distance to rivers from center of the village (meters) | ||||||||||
| District | No. of villages | Minimum | Maximum | Mean | S.E. | Minimum | Maximum | Mean | S.E. | γ (Spearman) | p-value |
| All villages | 156 | 0 | 97.7 | 28.5 | 1.9 | 1.4 | 7392.8 | 1407.1 | 139.7 | -0.23 | 0.004 |
| Corozal | 30 | 1.4 | 82.9 | 23.0 | 2.7 | 38.6 | 7392.8 | 3532.5 | 383.7 | 0.04 | 0.85 |
| Orange Walk | 22 | 1.7 | 87.9 | 21.3 | 4.5 | 42.8 | 3865.8 | 1320.8 | 265.0 | 0.09 | 0.68 |
| Belize | 25 | 0.3 | 66.0 | 14.6 | 3.9 | 1.4 | 3408.4 | 965.8 | 208.7 | -0.36 | 0.08 |
| Cayo | 34 | 0.0 | 77.4 | 34.0 | 3.8 | 6.9 | 2500.3 | 469.0 | 95.5 | -0.07 | 0.71 |
| Stann Creek | 16 | 4.0 | 93.4 | 28.1 | 7.1 | 16.0 | 5368.6 | 1120.4 | 418.4 | -0.82 | 9.8E-5 |
| Toledo | 29 | 3.6 | 97.7 | 45.3 | 5.0 | 5.6 | 5901.2 | 912.1 | 258.5 | 0.08 | 0.68 |
Figure 5.
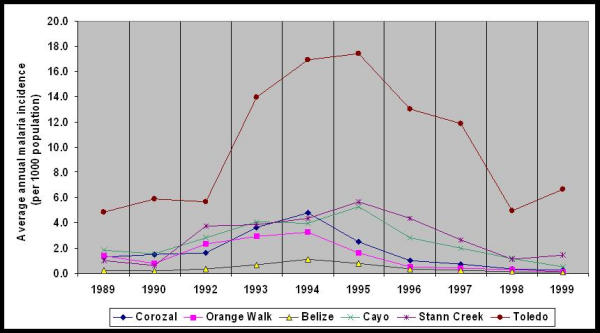
Average annual malaria incidence (per 1000 population) from 1989 through 1999 (except 1991) by year for six administrative districts
Vegetation in study villages
The total area of vegetation types was determined within two-kilometer buffers of villages with the highest and lowest 10 percentile of malaria rates during 1989 through 1999. Villages with the highest malaria rates had higher total area of agricultural land, broadleaf hill forests, and seasonally waterlogged fire-induced shrubland of the plains (SWF) within two-kilometer buffers of villages (Figure 7). Villages with the lowest malaria rates had higher total area of mangrove forests, needle-leaf forests, seasonal swamp forest, tall herb wetland communities, urban development, and water within two-kilometer buffers of villages (Figure 7). The vegetation map illustrated water bodies such as lakes, lagoons, and other contained water bodies but not rivers or streams. Iremonger and Brokaw broadly characterized seasonal swamp forests (SWF) and tall herb wetland communities as wetland communities. Coastal communities included mangrove forests, while forest and scrub communities included needle-leaf and broadleaf hill forests. Wetland and coastal communities primarily were located in the coastal plains of Belize.
Figure 7.
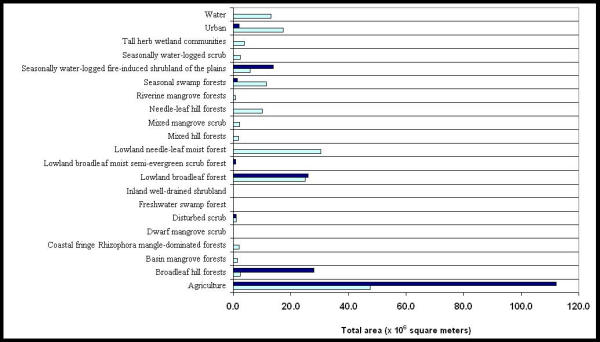
Total area, in square meters, of vegetation within 2 kilometer buffers around the higher and lower 10 percentile malaria incidence villages. The dark and light blue bars represent the higher and lower 10 percentile malaria incidence rates, respectively
Figure 6.
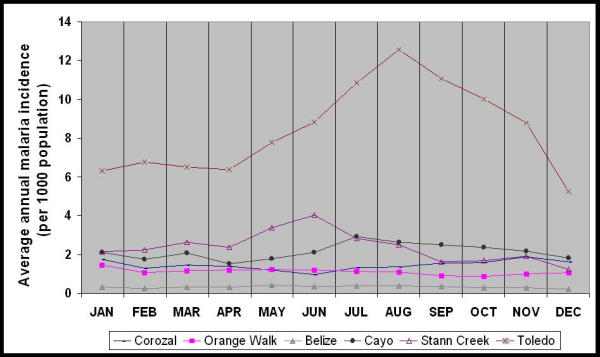
Average annual malaria incidence per 1000 population by month for the six administrative districts in Belize
Analysis of the total area and percentage of vegetation types in villages by district indicated that villages in Corozal, Cayo, and Toledo Districts had 70% or more agricultural land than other vegetation types within two-kilometers of the village center (Table 3). Villages in Belize District had more lowland needle-leaf moist forests (19%), seasonal swamp forests (11%) and urban area (7%) than villages in other districts. Villages in Stann Creek District had more SWF (26%) than villages in other districts. Cayo and Toledo Districts had more broadleaf hill forest than other districts (13 and 16%, respectively).
Table 3.
Total area (square meters) of vegetation within two kilometers of 156 different villages in Belize
| Area(%) | ||||||
| Orange | Stann | |||||
| Vegetation type | Corozal (n = 30) | Walk (n = 22) | Belize (n = 25) | Cayo (n = 34) | Creek (n = 16) | Toledo (n = 29) |
| Agriculture | 190.0 (74) | 148.2 (61) | 32.6 (11) | 246.2 (70) | 66.7 (42) | 230.9 (71) |
| Broadleaf hill forests | 0 | 0 | 4.1 (1) | 44.8 (13) | 7.1 (4) | 51.1 (16) |
| Basin mangrove forests | 0 | 0 | 5.7 (2) | 0 | 1.0 (1) | 0 |
| Coastal fringe Rhizophora mangle-dominated forests | 4.3 (2) | 0 | 0.2 (<0.5) | 0 | 2.1 (1) | 2.7 (1) |
| Dwarf mangrove scrub | 0.2 (<0.5) | 0 | 0.9 (<0.5) | 0 | 0 | 0 |
| Disturbed scrub | 0 | 1.3 (1) | 5.5 (2) | 6.2 (2) | 1.9 (1) | 1.6 (<0.5) |
| Freshwater swamp forest | 0 | 0 | 0 | 0 | 0 | 0.8 (<0.5) |
| Inland well-drained shrubland | 0 | 0 | 0 | 0.8 (<0.5) | 0 | 0 |
| Lowland broadleaf moist evergreen seasonal forests | 8.1 (3) | 8.5 (4) | 88.0 (30) | 27.7 (8) | 6.4 (4) | 20.5 (6) |
| Lowland broadleaf moist semi-evergreen scrub forest | 1.9 (1) | 0 | 0 | 0 | 8.0 (5) | 0 |
| Lowland needle-leaf moist forest | 0 | 12.7 (5) | 54.4 (19) | 2.2 (1) | 7.9 (5) | 1.4 (<0.5) |
| Mixed hill forests | 0 | 0 | 0 | 1.7 (<0.5) | 0 | 0 |
| Needle-leaf hill forests | 0 | 0 | 0 | 15.4 (4) | 0 | 0 |
| Mixed mangrove scrub | 0 | 0 | 0 | 0 | 5.5 (3) | 0 |
| Riverine mangrove forests | 17.8 (7) | 29.2 (12) | 5.2 (2) | 0 | 1.1 (1) | 0.2 (<0.5) |
| Seasonal swamp forests | 15.4 (6) | 19.1 (8) | 32.5 (11) | 0 | 1.2 (1) | 10.9 (3) |
| Seasonally water-logged fire-induced shrubland of the plains | 0 | 6.5 (3) | 20.7 (7) | 1.1 | 41.5 (26) | 3.6 (1) |
| Seasonally water-logged scrub | 0 | 5.8 (2) | 6.9 (2) | 6.5 (2) | 0 | 0 |
| Tall herb wetland communities | 1.9 (1) | 9.2 (4) | 3.8 (1) | 0 | 0 | 0 |
| Urban | 9.5 (4) | 0 | 20.9 (7) | 0.6 (<0.5) | 7.0 (4) | 2.5 (1) |
| Water | 8.5 (3) | 2.0 (1) | 9.5 (3) | 0 | 1.7 (1) | 0.1 (<0.5) |
Relationship of rivers/streams to malaria incidence in villages
Rivers and streams within two kilometer buffer zones of the high and low 10 percentile malaria incidence villages were mapped (Figure 4). More of the high 10 percentile than the low 10 percentile malaria incidence villages had rivers within two kilometers of the centers of villages.
Figure 4.
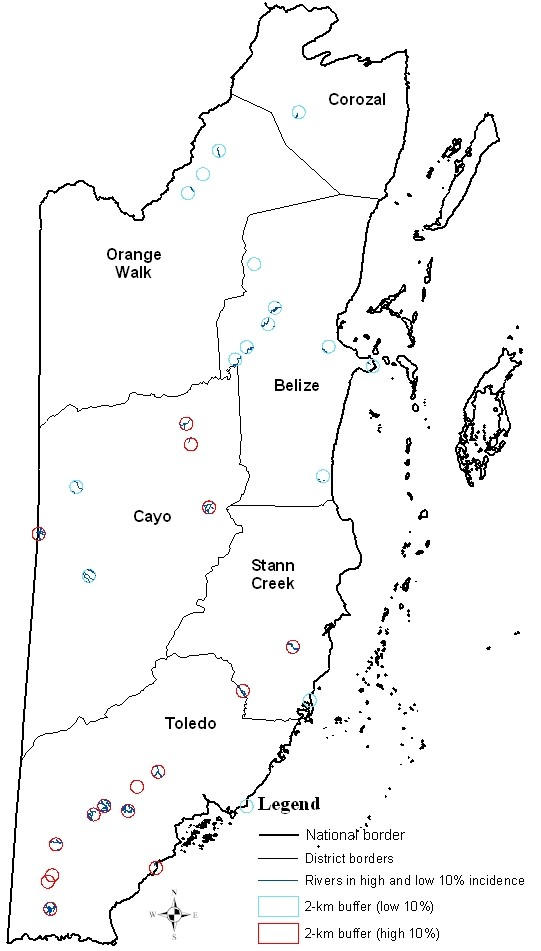
Rivers and/or streams within 2-kilometer buffers of high and low 10% malaria incidence (per 1000 population) villages
For all study villages, distance to the nearest river from the centers of villages was calculated and correlated with the average annual malaria incidence (Table 2). When all study villages were considered in the analysis, proximity to a river was significantly but weakly correlated with the average annual malaria incidence in a village (Spearman's γ = -0.23; p < 0.05). However in Stann Creek District, proximity of villages to rivers was strongly correlated with malaria incidence (Spearman's γ = -0.82; p < 0.05).
Discussion
We used GIS technology to explore the distribution of malaria during 10 years among regions within Belize and to preliminarily assess the correlation of malaria rates with ecological factors such as vegetation and rivers or streams. During the 10-year span, we examined malaria rates by month to investigate seasonal patterns.
Mapping malaria incidence rates for 1989 through 1999 for the entire country showed that malaria distribution varied for the six administrative regions in Belize. The top 10 percentile of average annual malaria incidence villages were located in western (Cayo District) and southern Belize (Stann Creek and Toledo Districts). These four districts had higher annual mean malaria incidence over the 10 years than Corozal, Orange Walk, and Belize Districts. Toledo District experienced significantly higher malaria incidence than other regions. The pattern of high malaria incidence in Toledo was seen especially during 1993 to 1995. Vector control efforts, among other factors, may explain the variation seen in malaria incidence among districts. During 1993 to 1995 minimal or no malaria control efforts were in effect. Nationwide residual spraying, initiated in 1957 and intermittent during 1990 to 1991, were suspended in western and southern Belize during 1993 through 1995 [20]. Vector Control Program records for Corozal and Orange Walk Districts indicate villages in the northern districts were sprayed in 1994. We were unable to assess the relationship between house spray data and malaria incidence for each district during the study period since these data were not available. However, the spatial patterns in districts, together with general vector control information for the country and the distribution of the three main vector species in Belize, suggest that region-specific factors are associated with specific vectors and malaria transmission.
The spatial distribution of the three potential vectors in Belize helps explain the variation in malaria incidence among districts and the correlation of malaria rates with different types of vegetation. Each of the three main vector species in Belize, An. albimanus, An. darlingi, and An. vestitipennis has specific habitats and differs in its vector competency. The lower malaria incidence villages, primarily in northern Belize, had more total area of coastal (mangrove forest) and wetland vegetation (seasonal swamp forest, and tall herb wetland communities). Entomological surveys in northern Belize have found An. albimanus and An. vestitipennis [21,22,14]. In northern Belize, An. albimanus larvae are associated with cyanobacterial mats (CBM), or blue-green algae with precipitated calcium carbonate, that are found in marshes [11]. In comparative susceptibility studies and field-caught specimens, An. albimanus showed the lowest infectivity by Plasmodium species [23,24] and displayed exophilic (or outside feeding) behavior [25]. In northern Belize, the wetland and coastal vegetation supports An. albimanus, which may be the primary vector of malaria in this region. This species' weak vector association may partly explain lower malaria incidence in northern villages and, therefore, the correlation of low 10 percentile malaria incidence villages with coastal and wetland vegetations.
Cayo, Stann Creek and Toledo Districts had higher average annual malaria incidence during the study period. Additionally, the high 10 percentile malaria incidence villages had more total area of broadleaf hill forests, agricultural land, and seasonally waterlogged fire-induced shrubland of the plains (SWF). Analysis of the vegetation types within all study villages indicated Corozal, Cayo and Toledo Districts had 70 percent or more agricultural land within two kilometers of a village and Cayo and Toledo Districts had the highest area of broadleaf hill forests near the village. Anopheles vestitipennis has been shown to preferentially breed in flooded forests and marshes with Typha [14]. Fertilizer run-off from agricultural areas has been known to increase Typha domingensis (cattails), a type of marsh vegetation [26]. Anopheles vestitipennis larvae and adults have been found in Toledo district in previous entomological surveys [13,14,27]. This vector species prefers to feed inside houses and had higher minimum field infection rates than An. albimanus or An. darlingi [13,21,23]. It has been determined to be an important vector of malaria in Belize [24]. The spatial pattern of higher malaria incidence villages and the correlation with broadleaf hill forests and agriculture coincide with the spatial distribution and breeding habitats of An. vestitipennis.
The high 10 percentile malaria incidence villages had more rivers present within two kilometers than the low 10 percentile malaria incidence villages. When all study villages (combining high and low malaria incidence villages) were included in the analyses, proximity of rivers to villages was significantly and weakly correlated with malaria incidence in villages. In Stann Creek District, where the correlation between proximity of rivers to malaria incidence in villages was strong, visual examination of digital data set for rivers in Belize indicates the foothills of Stann Creek District have the densest river and stream systems in the whole country. Anopheles darlingi larvae have been associated with river habitats in Belize, and adults and larvae of this species have been collected in all six districts [12,28]. Field-caught An. darlingi in Stann Creek District during 1994 to 1997 had a statistically significant minimum field infection rate for human Plasmodium circumsporozoite protein [23]. This Anopheles species is a competent vector because it is easily infected by malaria parasites, especially P. falciparum, and readily enters dwellings to blood-feed [24,25,28]. The higher malaria incidence in Stann Creek District together with the correlation with rivers and malaria incidence indicate that An. darlingi may play an important role in malaria transmission in this district.
Malaria incidence varied significantly by month within the six regions. Average monthly malaria incidence was highest in Toledo in August. Southern Belize has more broadleaf hill forests, extensive river systems, and gets more rainfall than northern areas. The ecology of this district (and Cayo) supports An. darlingi, An. vestitipennis, and An. albimanus [12,13,24,25]. At two sites in Toledo, Grieco found An. vestitipennis and An. albimanus populations to be associated with rainfall and river levels [24]. In the study's circumsporozoite analysis of landing collections, of the three vector species, An. vestitipennis had a higher infection rate. In the same study, An. darlingi populations were lower with increased rainfall, river levels and malaria cases, indicating a smaller role of An. darlingi in most sites of Toledo District. Rejmankova et al. were able to find An. vestitipennis larvae during the wet season, and not the dry season, in Toledo [14]. In Toledo, during times of high rainfall, it may be that environmental or habitat conditions that are associated with high rainfall are the more likely determinants for increased malaria.
We excluded villages with no population census information. Coincidentally, these villages had no malaria cases recorded in the National Malaria Database. Though printed in 1987, the maps we used to digitize villages may have been outdated. The first edition of the 1987 maps was originally produced from 1973–1976 1:50,000 maps (Directorate of Overseas Surveys – Government of the United Kingdom). If the localities indeed still exist, then 37 percent of the excluded villages were from Cayo District. In mapping the high and low 10 and 30 percentile villages, we may have underestimated the low or no malaria incidence villages in Cayo. However, since these villages were excluded from the population census (probably due to their small population size of less than 30 which is the Central Statistics Offices' criteria to include a village in a census), the excluded villages were unlikely to be good indicators of malaria for their geographic area.
We extrapolated the 1991 population census to calculate mean incidence rates for the entire 10 years of the study. Population data of individual villages for 2000 were not available when this study was conducted. Therefore, we did not account for variations, over time, in population size in villages. As a result, population size used in our study may have overestimated malaria incidence for the administrative regions. However, we were able to examine the trends in malaria incidence by month and by year during the 10-year period of the study, since Belize maintains a database of incident malaria cases. Using GIS technology, we were able to assess the relationship of vegetation and rivers with malaria incidence for the entire country quickly and cost-effectively.
Conclusions
In our study, malaria incidence had temporal and spatial patterns and a relationship existed between high malaria incidence and proximity to rivers and vegetation such as broadleaf hill forests and agricultural land. Assuming malaria transmission occurred within the village and was not imported, environmental factors such as forest type, cultivation, rainfall, and proximity of rivers are useful proxy measures to identify presence of a vector species and its role in malaria transmission. Previous studies in Belize indicate that the presence and abundance of Anopheles species are closely related to ecological niches supported by certain environmental factors [12,14,22,29]. An association was found between An. vestitipennis and swamp forests [14] and the presence of An. darlingi and An. albimanus near rivers and creeks [25]. In a vector survey conducted in 1993, collection efforts were guided by predictions based on identification of environmental factors using satellite data and topographical maps [29]. At high probability sites, using criteria based on proximity of houses to rivers, altitude of house compounds in relation to rivers, and presence of forest cover, the investigators collected the malaria vectors, An. pseudopunctipennis and An. darlingi, and showed that predictions for the former vector species was 50% and 100% accurate, respectively for the two species. Furthermore, in the investigation, An. darlingi, which was last found in Belize in 1946, was successfully collected. Clearly, understanding and identifying the relationship of environmental factors with the ecology of the vectors of malaria in Belize would aid in targeting malaria control measures in a timely and cost-effective manner. Additional studies examining the association of environmental and climatic factors with malaria transmission are warranted.
Methods
Using a GIS created for 213 villages in Belize, this retrospective study assessed the spatial and seasonal distributions of average annual malaria incidence rates per 1000 population from 1989 through 1999 and their correlation with vegetation and rivers and streams in the villages of Belize. Malaria incidence was mapped for every village having census information. The vegetation type in villages was determined using a 1995 vegetation map for Belize. A digital data set produced by the Land Information Centre (LIC) in Belize provided information on the presence of rivers/streams in villages.
Malaria cases during 1989 through 1999 for the study villages in Belize were obtained from the Belize Ministry of Health's National Malaria Control Program's (NMCP) electronic database. This database was initiated in 1989 for surveillance and malaria control purposes. Malaria case information was incomplete for 1991. Therefore, 1991 malaria data were omitted from analyses. Malaria case information entered in the database was gathered from weekly reports sent by each of the six administrative districts (Corozal, Orange Walk, Belize, Cayo, Stann Creek, and Toledo) in Belize. The weekly report contained demographic information and date of diagnosis of all patients positive for malaria through microscopic examination.
Reports in the districts were generated by malaria surveillance activities conducted in each village within the district. The surveillance consisted of either active, or passive, case detection. In passive surveillance, villagers sought malaria diagnosis, through blood film examination, and treatment from a volunteer health collaborator (VC) in the village. Personnel from the Vector Control Program (VCP), during periods of high malaria cases, conducted active surveillance in villages by visiting and taking blood films of householders of malaria-positive patients with fever. In both active and passive surveys, the Ministry of Health's district medical laboratory's microscopists examined the blood films. Additionally, all malaria positive films were sent to the central MOH laboratory microscopists for confirmation.
Malaria incidence per 1000 population was calculated for 1989 through 1999 by using the 1991 national census for villages in Belize as denominator data. It was assumed that the entire population in each village was at risk for malaria. The 2000 population census for the study villages was unavailable when this study was conducted. A comparison by the Central Statistics Office of Belize between the 1991 national census and preliminary results of the 2000 census indicated there was an overall 2.7 percent growth in population per year in the country. Average annual, and monthly, malaria incidence rates were calculated for each village and each district. First calculating the malaria rate for 10 years and subsequently calculating the annual incidence yielded the average annual malaria incidence rate for each village. Similarly, calculating the 10-year monthly rate first, and subsequently the annual monthly rate yielded the average monthly malaria incidence rate per 1000 population per year over 10 years.
The geographic location of each village was determined through use of topographical maps. Two sheets of 1:250,000 topographical maps of Belize were electronically scanned in four sections. These maps were then georeferenced and joined using PCI version 6.2.2 software. The coordinates of each village were obtained by digitizing the location of the village on the maps in PCI software. A vector file of all towns was created and exported to ArcView as a coverage file. The attributes of each village, such as malaria case and census information, were joined to the village coverage using ArcInfo software version 7.2.1.
The average annual 10-year malaria incidence rates for all villages were sorted in ascending order to obtain the high and low 10 and 30 percentiles of malaria incidence villages. The 16 villages with the highest malaria incidence rates, and the 16 villages with the lowest malaria incidence rates, were used to represent the high and low 10 percentiles of malaria incidence villages, respectively. The 47 villages with the highest malaria incidence rates, and the 47 villages with the lowest malaria incidence rates, were used to represent the high and low 30 percentiles of malaria incidence villages, respectively. The high and low 30 and 10 percentiles of malaria incidence villages were mapped in ArcView.
Average annual malaria incidence rates per 1000 population for the 10-year period were calculated by district, and graphed by month, to assess seasonal distribution. Differences in average annual malaria rates among districts and differences in average monthly malaria incidence rates were compared using the PROC GENMOD command in SAS version 6.12.
In this study, we used the vegetation map produced in 1994 (published in 1995) by the ecologists Iremonger and Brokaw that showed actual vegetation, cultivated and urban areas. Iremonger and Brokaw based their map on potential vegetation and soil maps produced by Wright et al. in 1958, satellite imagery, and in depth information on certain local areas [30]. They used concepts from UNESCO's classification system, which is a physiognomic vegetation classification system hierarchically categorizing vegetation structures seen on the ground. Iremonger and Brokaw started with three general categories (forest, scrub, and herbaceous), and further divided the broad categories to produce 51 vegetation types (36 forest, 9 scrub, and 6 herbaceous). The vegetation map was assumed to be accurate for 1995 and was not field-checked at the time this study was conducted in 2001.
Each village was given a two-kilometer radius buffer in ARC/INFO. A buffer of one kilometer was chosen to represent the maximum flight range of the Anopheles mosquito, and an additional one-kilometer radius was given as an estimate of the size of a village. The village buffers and the vegetation map were integrated using the UNION command in ARC/INFO. Descriptive statistics of the vegetation present within the village buffers were calculated in ARC/INFO. Total area in square meters for the high and low 10 percentile of malaria incidence villages was plotted by vegetation type. Additionally, total area and percentage of vegetation types in villages were calculated by district.
To assess the correlation of malaria incidence with rivers in Belize, we used a digital data set of rivers purchased from the LIC, Belize. The LIC produced the data set by digitizing rivers and streams using 1:50,000 and 1:250,000 Belize topographical maps. To assess the distribution of rivers in high versus low malaria incidence villages, two-kilometer buffers of high and low 10 percent malaria villages were integrated with the rivers data set using the INTERSECT command in ARC/INFO. Distances from the center of all study villages to the closest river were calculated using the NEAR command in ARC/INFO. At national and district levels, correlations between distances to rivers from village centers, and average annual malaria rates, were calculated using Spearman's correlation (SPSS version 11.0 for Windows).
Authors' contributions
SH co-designed the study, developed the study's GIS, conducted spatial and statistical analyses, and drafted the manuscript. PM designed the study, co-developed the study's GIS, and conducted spatial analyses. EV initiated and developed the National Malaria Database in Belize. DR participated in the study design and drafting of the manuscript.
All authors read, edited and accepted the final manuscript.
Disclaimer
This manuscript was completed in partial fulfillment of the Doctor of Public Health degree earned at the Department of Preventive Medicine and Biometrics, Uniformed Services University of the Health Sciences, Bethesda, Maryland, USA. The opinions of the authors expressed in the manuscript do not reflect the views of the authors' affiliated organizations.
Acknowledgments
Acknowledgements
We would like to thank Dr. Paul Hshieh and Mrs. Cara Olsen for their help in statistical analyses. We would also like to thank the anonymous reviewers whose comments helped in improving the manuscript. This study was partially funded by NASA grant number NAG5-8532.
Contributor Information
Shilpa Hakre, Email: shilpa.hakre@na.amedd.army.mil.
Penny Masuoka, Email: pmasuoka@usuhs.mil.
Errol Vanzie, Email: evanzie@moh.gov.bz.
Donald R Roberts, Email: droberts@usuhs.mil.
References
- Beyers N, Gie RP, Zietsman HL, Kunneke M, Hauman J, Tatley M, Donald PR. The use of a geographical information system (GIS) to evaluate the distribution of tuberculosis in a high-incidence community. S Afr Med J. 1996;86:40–1, 44. [PubMed] [Google Scholar]
- Brooker S, Rowlands M, Haller L, Savioli L, Bundy DA. Towards an atlas of human helminth infection in sub-Saharan Africa: the use of geographical information systems (GIS) Parasitol Today. 2000;16:303–307. doi: 10.1016/S0169-4758(00)01687-2. [DOI] [PubMed] [Google Scholar]
- Cattani P, Jannin J, Lucas P. Sleeping sickness surveillance: an essential step towards elimination. Trop Med Int Health. 2001;6:348–361. doi: 10.1046/j.1365-3156.2001.00669.x. [DOI] [PubMed] [Google Scholar]
- Cherkasskiy BL. A national register of historic and contemporary anthrax foci. J Appl Microbiol. 1999;87:192–195. doi: 10.1046/j.1365-2672.1999.00868.x. [DOI] [PubMed] [Google Scholar]
- Kitron U. Landscape ecology and epidemiology of vector-borne diseases: tools for spatial analysis. J Med Entomol. 1998;35:435–445. doi: 10.1093/jmedent/35.4.435. [DOI] [PubMed] [Google Scholar]
- Moncayo AC, Edman JD, Finn JT. Application of geographic information technology in determining risk of eastern equine encephalomyelitis virus transmission. J Am Mosq Control Assoc. 2000;16:28–35. [PubMed] [Google Scholar]
- Omumbo J, Ouma J, Rapuoda B, Craig MH, le Sueur D, Snow RW. Mapping malaria transmission intensity using geographical information systems (GIS): an example from Kenya. Ann Trop Med Parasitol. 1998;92:7–21. doi: 10.1080/00034989860120. [DOI] [PubMed] [Google Scholar]
- Wright ACS, Romney RH, Arbuckle RH, Vial VE. Land in British Honduras. Colonial Research Publication No. 24. London, Her Majesty's Stationery Office; 1959. p. 327. [Google Scholar]
- King RB, Baillie IC, Abell TMB, Dunsmore JR, Gray DA, Pratt JH, Versey HR, Wright ACS, Zisman SA. Land Resources Assessment of Northern Belize. 1992. p. 513.
- Meerman JC, Sabido W. Central American Ecosystems Map: Belize. Vol. 1. Belize City, Programme for Belize; 2001. [Google Scholar]
- Rejmankova E, Harbach RE, Pecor J, Peyton EL, Manguin S, Krieg R, Polanco J, Legters L. Environmental and regional determinants of Anopheles (Diptera: Culicidae) larval distribution in Belize, Central America. Environ Entomol. 1993;22:978–992. [Google Scholar]
- Manguin S, Roberts DR, Andre RG, Rejmankova E, Hakre S. Characterization of Anopheles darlingi (Diptera: Culicidae) larval habitats in Belize, Central America. J Med Entomol. 1996;33:205–211. doi: 10.1093/jmedent/33.2.205. [DOI] [PubMed] [Google Scholar]
- Roberts DR, Chan O, Pecor J, Rejmankova E, Manguin S, Polanco J, Legters LJ. Preliminary observations on the changing roles of malaria vectors in southern Belize. J Am Mosq Control Assoc. 1993;9:456–459. [PubMed] [Google Scholar]
- Rejmankova E, Pope KO, Roberts DR, Lege MG, Andre R, Greico J, Alonzo Y. Characterization and detection of Anopheles vestitipennis and Anopheles punctimacula (Diptera: Culicidae) larval habitats in Belize with field survey and SPOT satellite imagery. J Vector Ecol. 1998;23:74–88. [PubMed] [Google Scholar]
- Bergquist NR. Vector-borne parasitic diseases: new trends in data collection and risk assessment. Acta Trop. 2001;79:13–20. doi: 10.1016/S0001-706X(01)00099-7. [DOI] [PubMed] [Google Scholar]
- Sabesan S, Palaniyandi M, Das PK, Michael E. Mapping of lymphatic filariasis in India. Ann Trop Med Parasitol. 2000;94:591–606. doi: 10.1080/00034983.2000.11813582. [DOI] [PubMed] [Google Scholar]
- Seketeli A, Adeoye G, Eyamba A, Nnoruka E, Drameh P, Amazigo UV, Noma M, Agboton F, Aholou Y, Kale OO, Dadzie KY. The achievements and challenges of the African Programme for Onchocerciasis Control (APOC) Ann Trop Med Parasitol. 2002;96 Suppl 1:S15–28. doi: 10.1179/000349802125000628. [DOI] [PubMed] [Google Scholar]
- Sharma VP, Srivastava A. Role of geographic information system in malaria control. Indian J Med Res. 1997;106:198–204. [PubMed] [Google Scholar]
- Yamagata Y, Suzuki T, Garcia Manzo GA. Geographical distribution of the prevalence of nodules of Onchocerca volvulus in Guatemala over the last four decades. Trop Med Parasitol. 1986;37:28–34. [PubMed] [Google Scholar]
- Roberts DR, Vanzie E, Bangs MJ, Grieco JP, Lenares H, Hshieh P, Rejmankova E, Manguin S, Andre RG, Polanco J. Role of residual spraying for malaria control in Belize. J Vector Ecol. 2002;27:63–69. [PubMed] [Google Scholar]
- Bangs MJ. Department of Preventive Medicine and Biometrics. Bethesda, Maryland, Uniformed Services University of the Health Sciences; 1999. The susceptibility and behavioral response of Anopheles albimanus Weidemann and Anopheles vestitipennis Dyar and Knab (Diptera: Culicidae) to insecticides in northern Belize, Central America; p. 448. [Google Scholar]
- Rejmankova E, Roberts DR, Pawley A, Manguin S, Polanco J. Predictions of adult Anopheles albimanus densities in villages based on distances to remotely sensed larval habitats. Am J Trop Med Hyg. 1995;53:482–488. doi: 10.4269/ajtmh.1995.53.482. [DOI] [PubMed] [Google Scholar]
- Achee NL, Korves CT, Bangs MJ, Rejmankova E, Lege MG, Curtin D, Lenares H, Alonzo Y, Andre RG, Roberts DR. Plasmodium vivax polymorphs and Plasmodium falciparum circumsporozoite proteins in Anopheles (Diptera: Culicidae) from Belize, C.A. J Vector Ecol. 2000;25:203–211. [PubMed] [Google Scholar]
- Grieco JP. Preventive Medicine and Biometrics. Bethesda, Uniformed Services University of the Health Sciences; 2000. The bionomics and vector competence of Anopheles albimanus Wiedemann and Anopheles vestitipennis Dyar and Knab (Diptera: Culicidae) in southern Belize, Central America; p. 445. [Google Scholar]
- Roberts DR, Manguin S, Rejmankova E, Andre R, Harbach RE, Vanzie E, Hakre S, Polanco J. Spatial distribution of adult Anopheles darlingi and Anopheles albimanus in relation to riparian habitats in Belize, Central America. J Vector Ecol. 2002;27:21–30. [PubMed] [Google Scholar]
- Selby S. Ecological change in the wetland of northern Belize. Journal of Belizean Affairs. 2001;3:97–117. [Google Scholar]
- Grieco JP, Achee NL, Andre RG, Roberts DR. A comparison study of house entering and exiting behavior of Anopheles vestitipennis (Diptera: Culicidae) using experimental huts sprayed with DDT or deltamethrin in the southern district of Toledo, Belize, C.A. J Vector Ecol. 2000;25:62–73. [PubMed] [Google Scholar]
- Kumm HW. Observations on the Anopheles of British Honduras. Am J Trop Med Hyg. 1941;21:559–566. [Google Scholar]
- Roberts DR, Paris JF, Manguin S, Harbach RE, Woodruff R, Rejmankova E, Polanco J, Wullschleger B, Legters LJ. Predictions of malaria vector distribution in Belize based on multispectral satellite data. Am J Trop Med Hyg. 1996;54:304–308. doi: 10.4269/ajtmh.1996.54.304. [DOI] [PubMed] [Google Scholar]
- Brokaw NVL. A history of plant ecology in Belize. Journal of Belizean Affairs. 2001;3:1–39. [Google Scholar]


