Abstract
CD4+ T cell counts are important tests used to stage HIV-postive patients, enabling clinicians to make informed antiretroviral treatment decisions and to monitor the therapeutic outcomes. However, state-of-the-art CD4 counting methods based on flow cytometry are not applicable in resource-limited settings, due to their high cost and technical requirements. In previous work, we reported the development of a cell isolation microchip that can be used at the point of care for CD4 counts. In that microfluidic chip, CD4+ T cells were separated from 10 μL of whole blood, and enumerated via either light microscopy or impedance sensing. The microchip counts matched flow cytometry results in the intermediate CD4 count range, between 200–800 cells/μL, but displayed a positive bias at absolute CD4 counts below 200 cells/μL, due largely to monocyte contamination. To enhance the performance in the low CD4 count range, we report here an improved design of a two-stage microfluidic device to deplete monocytes from whole blood, followed by CD4+ T cell capture. Using the double-stage device combined with a high viscosity rinsing solution, we obtained microchip CD4 counts comparable to flow cytometry results in the full clinically relevant range. In addition to CD4 counting, the strategy of contaminant depletion prior to target cell isolation can be easily adapted to immunoaffinity capture of other cell types that lack a unique surface marker from a complex biological fluid.
Introduction
Among the diseases of global concern, HIV/AIDS is one of the leading causes of morbidity and mortality. In the past 3 decades, more than 25 million people have died from AIDS, and another 33 million are living with HIV, of whom 90% are in developing countries.1 Since 2001, HIV has also been recognized as one of the United States’ top economic and national security priorities. UN agencies, Western governments, and non-governmental organizations have committed more than ten billion dollars per year to support AIDS relief, leading to a dramatic reduction in the treatment cost. However, staging and monitoring HIV/AIDS patients with appropriate tests remains technically difficult in resource-limited settings.
In clinical HIV/AIDS management, the absolute number of circulating CD4+ T lymphocytes is a critical indicator used to predict the degree of damage to the immunological system during HIV infection.2–5 Regular monitoring of CD4 counts—two to four times per year—is recommended for all stages of infection, prior to the need for antiretroviral drugs and during lifelong treatment.6 A CD4+ T cell count below 200 cells/μL in blood is considered to represent the onset of AIDS, and is recommended by the World Health Organization as the time to start anti-retroviral therapy (ART).7 Other thresholds, 350 and 500 CD4+ T cells/μL, are used in some settings as clinical triggers, to either start therapy or to increase the monitoring intensity.
Currently, the ‘gold standard’ method to measure CD4 counts is through flow cytometry. Although high throughput and accurate, the technical requirements and operation costs involved in flow cytometry prevent its penetration into most resource-limited regions.8 As an effort to develop a CD4 counter applicable at the point of care, we recently reported a microfluidic approach that relied on immunoaffinity CD4+ T cell isolation, followed by cell lysate impedence measurement for cell enumeration.9–11 For cell isolation, a microfluidic channel was functionalized with a surface-bound anti-CD4 antibody, and the CD4+ T lymphocytes were captured directly from whole blood. Total cell counts obtained using this device compared well with flow cytometry measurements over a wide range of absolute CD4 counts. However, at CD4 counts below 200 cells/μL, contaminating CD4+ monocytes often offset the total cell counts, limiting the accuracy of our microchip approach for quantitative CD4 counting in this range.
Here, we describe a system to minimize monocyte contamination and to expand the quantitative detection range of the CD4 counting microchip. Our new device consists of a monocyte depletion module upstream to the CD4+ T cell capture channel, to improve target cell purity. We compare its performance to our previously reported single-chamber device and to flow cytometry, and demonstrate the accuracy of the new, two-chamber device to measure CD4 counts throughout the entire, clinically relevant CD4 count range.
Materials and methods
Materials
3-Mercaptopropyl trimethoxysilane was purchased from Gelest (Morrisville, PA). Ethanol (200 proof), glass coverslips (35 × 60 mm, no. 1), hemacytometer and microslide field-finder were obtained from Fisher Scientific (Fair Lawn, NJ). For chamber fabrication, SU-8 photoresist and developer were obtained from MicroChem (Newton, MA); silicone elastomer and curing agent were obtained from Dow Corning (Midland, MI). Phosphate buffered saline (PBS) was purchased from Mediatech (Herndon, VA). Lyophilized bovine serum albumin (BSA) was obtained from Aldrich Chemical Co. (Milwaukee, WI). The coupling agent GMBS (Ñ-γ-maleimidobutyryloxy succinimide ester), NeutrAvidin, protein biotinylaiton and Melon Gel IgG Purification kits were purchased from Pierce Biotechnology (Rockford, IL). Biotinylated anti-human anti-CD4 (clone 13b8.2) and anti-human CD14 (clone RMO52 and clone MY4) were purchased from Beckman Coulter (Somerset, NJ). Biotinylated anti-human CD14 (clone UCHM1) was from AbD Serotec (Raleigh, NC) and anti-human CD36 (clone SMO) were obtained from Ancell (Bayport, MN). Alexa Fluor® 488-conjugated mouse antibody to human CD4 (AF488-anti-CD4, clone 289-14120), Alexa Fluor® 647-conjugated mouse antibody to human CD3 (AF647-anti-CD3, clone 289-13801) and 4′-6-diamidino-2-phenylindole (DAPI) were obtained from Molecular Probes (Eugene, OR). FITC conjugated anti-CD36 (FITC-anti-CD36, clone CB38 (NL07)) and PE conjugated anti-CD14 (PE-anti-CD14, clone MϕP9) were purchased from BD Bioscience (San Jose, CA). Paraformaldehyde was obtained from Electron Microscopy Sciences (Hatfield, PA). Dextran 500 (molecular weight 500 kDa) was from Amersham Biosciences (Piscataway, NJ).
Biotinylation of antibodies
Anti-human CD14 (MY4 clone) was purified using the Melon Gel IgG purification kit and biotinylated using the Sulfo-NHS-Biotinylation kit following the recommended kit protocols. Afterwards, the antibody concentration was measured using a UV-Vis spectrometer and diluted to the desired final concentration using PBS containing 1% BSA.
Chamber design and fabrication
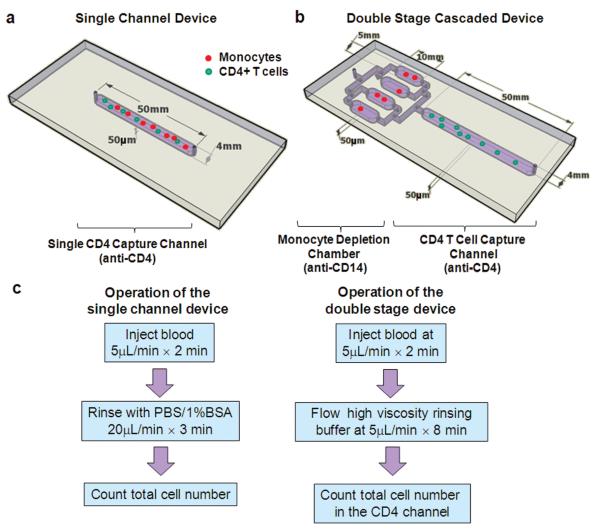
Three types of microfluidic devices were used in this work. The first one was a Hele–Shaw chamber for the study of shear stress on cell isolation.12,13 The second was the previously described single straight flow channel, with dimensions of 50 mm × 4 mm × 50 μm (Fig. 1a) for CD4+ T cell capture.9 The third device consists of two types of chambers in series, one set of four chambers for monocyte depletion, connected to a single chamber for CD4+ T cell isolation (Fig. 1b). All devices were fabricated in PDMS and bonded permanently to clean glass cover slips using standard clean room techniques.
Fig. 1.
Microfluidic devices used in the study and the operation procedures. (a), (b) Schematics showing the geometry of the single channel (a) and two stage (b) devices used for cell counting in this paper. The CD4+ T cell capture channels of both devices were functionalized with an anti-CD4 antibody for target cell isolation. The two stage device also contains 4 parallel chambers upstream to the CD4 channel for monocyte depletion. (c) The operation procedures of the two counting devices. For the double-stage devices, two considerations were taken into account for the rinsing buffers: one is to quickly displace monocyte depleted blood to the CD4 capture channel and the second is to avoid shearing off specifically captured cells. These two considerations were studied in detail in this work.
Surface modification
Freshly fabricated devices were modified using previously described methods.10,13 Briefly, the chambers were pretreated with 4% (v/v) solution of 3-mercaptopropyl trimethoxysilane in ethanol for 30 minutes at room temperature, followed by incubation with 0.01 mM GMBS in ethanol for 15 minutes at room temperature. Afterwards, NeutrAvidin was immobilized to GMBS by incubating the chamber surfaces with 10 μg/mL NeutrAvidin solution in PBS for at least 1 hour at 4 °C. Finally, 10 μg/mL biotinylated antibody solution in PBS containing 1% (w/v) BSA and 0.09% (w/v) sodium azide was injected to react at room temperature for at least 15 minutes. After each step, the surfaces were rinsed with either ethanol or PBS, depending on the solvent used in the previous step, to flush away unreacted molecules. For the double-stage cell capture devices, an outlet was created between the two stages to enable them to be functionalized with separate antibodies. After surface modification, this outlet was plugged for cell capture experiments.
Study subjects and blood preparation
Healthy HIV-negative and HIV-infected subjects were recruited from the Massachusetts General Hospital (MGH) in Boston. All subjects were provided with written informed consent, and the study was approved by the hospital’s Institutional Review Board. Samples of 5 mL of peripheral blood were collected by venipuncture in either heparin or EDTA Vacutainer® collection tubes (Becton Dickinson). All samples were run on both the single-channel and double-stage microfluidic devices on the day of blood collection. Parallel measurement of CD4 counts was performed in the hospital clinical laboratory using standard 4-color flow cytometry on a Becton Dickinson FACSCalibur, using the MultiTEST reagents and TruCOUNT beads and MultiSET software to obtain CD4 counts, as described previously.14
Antibody spotting and cell capture
To screen for the antibody clones for monocyte immunoaffinity capture, we used an antibody spotting and cell capture approach, as previously described.15 Briefly, anti-CD14 and anti-CD36 antibodies were spotted onto glass slides pre-coated with a thin film of polyethylene glycol (PEG) hydrogel. After the antibody spots dried, slides were incubated with erythrocyte-depleted whole blood, followed with rinsing to remove non-specifically attached cells. The slides were then stained using fluorescent antibodies to inspect the type and purity of captured cells.
Microfluidic flow experiments
To identify the optimal flow condition for monocyte capture, 300 ml of unprocessed whole blood from healthy donors was introduced into the Hele–Shaw chambers at various flow rates between 5–40 μl/min, followed with a rinse using PBS containing 1% BSA (w/v) and 1 mM EDTA at 40 μL/min for 5 minutes. Cells immobilized in the Hele–Shaw chamber were then fixed on the surfaces by incubating with 1% paraformaldehyde and stained with fluorescent antibodies against human CD14 and CD36 for monocyte identification. The number of attached cells was counted by placing a field finder under the chambers and counting cells at selected points along the device’s central axis using an inverted microscope (Nikon Eclipse TE2000, Nikon, Japan). For each point, three measurements were made, corresponding to three 1 mm2 squares in that vicinity, and averaged.9
In experiments performed to test the CD4 cell counting devices, 10 μl of whole blood from healthy donors or HIV-infected subjects was flowed into the devices at a flow rate of 5 μl/min, optimal for isolation of CD4+ T lymphocytes. Afterwards, the single-channel devices were rinsed with PBS containing 1% BSA and 1 mM EDTA at 20 μl/min for 3 minutes, while the two-stage devices were rinsed with PBS containing 1% BSA and 1mM EDTA or other high-viscosity buffers at a flow rate of 5 μl/min for 8 minutes. Such a flow rate pushed monocyte-depleted blood into the CD4 channel for capture, and at the same time flushed non-specific cells off the devices. Next, cells adherent to the surface were stained using a solution containing AF647-anti-CD3, AF488-anti-CD4, PE-anti-CD14 and DAPI. To determine CD4 counts from the microchips using HIV+ blood samples, the total number of adherent nucleated cells in the CD4 channel was obtained by enumeration of DAPI-stained cells under an epifluorescent microscope or by direct observation under a phase contrast microscope. Microchip CD4 counts (cells/μL) were calculated by dividing the total cell number in the CD4 channels by 10 (the volume of blood samples processed through the device, in microliters). Purity of the isolated CD4+ T cells was determined by dividing the number of CD3+/CD4+/CD14− cells by the total cell number. Flow-through samples were collected from the outlet of the device into eppendorf tubes and centrifuged to concentrate the cells for flow cytometry.
Flow cytometry analysis
In order to confirm the efficiency of the devices in isolating CD4+ T cells from whole blood, aliquots of samples before and after passing through the cell counting devices were collected and analysed using standard flow cytometry, to quantify the percentage of CD4+ T cells captured inside the devices. The flow cytometric measurements were performed on a FACSCalibur (Beckton Dickinson Immunocytometry System (BDIS, San Jose, CA)) instrument using BD CellQuest Pro Software. The capture efficiency, or yield, of the device was estimated from the ratio of the percentage of CD3+ CD4+ T cells in samples collected before and after passing the microfluidic device.
Results and discussion
CD4+ T cell counts have critical prognostic and therapeutic implications in the management of HIV patients. To develop a CD4 counter usable at the point of care, we have previously designed a microfluidic device functionalized with a monoclonal antibody to isolate CD4+ T lymphocytes from whole blood (Fig. 1a).11 This method required no sample preparation and was label-free, with the CD4 counts being obtained by enumerating the total number of cells captured in the device. When operated under the optimal flow condition, the microchip yields CD4 counts comparable to conventional flow cytometry measurements in the CD4 count range between 200 and 800 cells/μL. However, at the low CD4 count range of less than 200 cells/μL, CD4+ monocytes often dominate the cell population immobilized within the microchannel, leading to a positive bias in microchip CD4 counts. To reduce monocyte contamination and improve the microchip operational range, we describe in this paper the development of a two-stage microfluidic device (Fig. 1b): the first stage of parallel microchambers depletes monocytes from whole blood through immunoaffinity isolation, and the second stage of a single microchannel specifically isolates CD4+ T cell for CD4 counts. Successful development of the two stage device requires proper selection of the antibody and flow condition for monocyte immobilization, and quick displacement of monocyte-depleted blood to the CD4 capture channel. We describe in detail these design considerations as well as performance of the final device. The operating procedures for the single channel and double-stage devices are summarized in Fig. 1c.
Antibody clones for monocyte capture
Although a number of antibodies are available for monocyte immunochemistry, they may not be suitable for immunoaffinity cell capture in a microfluidic device, since the latter is greatly influenced by the accessibility of the monocyte surface markers to a substrate-bound antibody. To screen for the most efficient antibody for monocyte capture, we spotted three clones of anti-CD14 and one clone of anti-CD36 on a PEG-functionalized glass slide, followed by incubating the slide with erythrocyte-lysed blood under static conditions. Both CD14 and CD36 are highly expressed on the monocyte membrane,16,17 while CD14 is also present on the neutrophil membrane, and CD36 is present on platelets. After rinsing off unbound cells, cells captured on the slides were stained with AF488-anti-CD36, PE-anti-CD14 and DAPI. As shown in Fig. 2, the triple-stained cells are monocytes, while CD14−CD36 + DAPI− and CD14+ CD36−DAPI+ cells are platelets and neutrophils, respectively. From the images, it is clear that the anti-CD14 MY4 clone immobilizes monocytes most efficiently from erythrocyte lysed blood. The next most efficient antibody is the anti-CD14 RMO52 clone. The anti-CD14 UCHM1 captures only a few monocytes under static conditions, while the anti-CD36 SMO-clone spot is heavily covered by platelets. Thus, we chose the anti-CD14 MY4 clone as the monocyte depletion antibody for all tests described in the following sections.
Fig. 2.
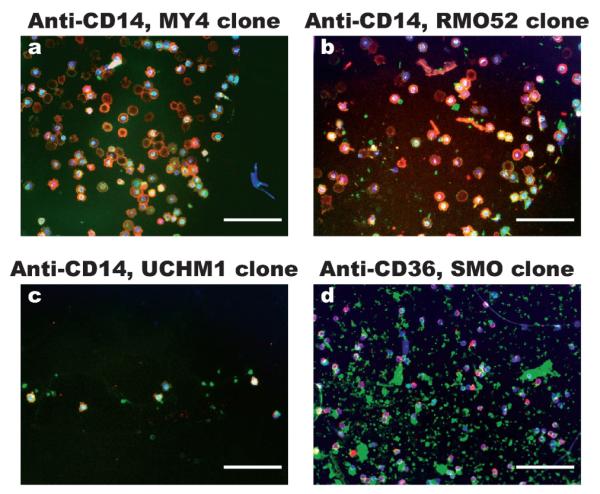
Representative images of cells captured from erythrocyte lysed blood onto antibody spots under static incubation conditions. The antibodies used are (a) anti-CD14 clone MY4, (b) anti-CD14 clone RMO52, (c) anti-CD14 clone UCHM1 and (d) anti-CD36 clone SMO. After rinsing off unbound cells, the cells captured on the antibody spots were stained using FITC-anti-CD36 (green), PE-anti-CD14 (red) and DAPI (blue). The images were created by overlapping the fluorescence photographs. The triple stained cells are monocytes, CD36 + CD14− cells are likely platelets and CD36−CD14+ cells are likely neutrophils. From the images, anti-CD14 MY4 clone and RMO52 clone captures monocytes efficiently, while anti-CD36 captures mostly platelets. (Scale bars: 100 μm).
Shear stress and antibody concentration for monocyte capture
We next studied the effects of shear stress on monocyte capture using Hele–Shaw chambers functionalized with the anti-CD14 MY4 clone at several different solution concentrations. The design of a Hele–Shaw chamber allows for an analysis of cell adhesion over a range of shear stresses in a single experiment.12,13 Whole blood from healthy donors was injected into the Hele–Shaw chambers at various flow rates until monocyte capture reached a steady state. After rinsing off uncaptured cells, immobilized cells were stained using AF488-anti-CD36, PE-anti-CD14 and DAPI. Monocytes were counted as the triple positive population. As shown in Fig. 3, both the antibody concentration and the shear stress affect monocyte adhesion. Cell capture reaches a maximum density plateau of ~150 cell/mm2 when the shear stress is lower than 0.5 dyn/cm2 with the highest antibody concentration of 75 μg/mL. At an antibody concentration of 35 μg/mL, a relatively lower plateau of ~120 cell/mm2 is reached below 0.3 dyn/cm. At shear stresses higher than the transition points, cell capture quickly drops to nearly zero. When the devices were functionalized with anti-CD14 MY4 clone at concentrations lower than 18 μg/mL, cell densities on the surfaces are lower than 50 cells/mm2 within the whole tested shear stress range. As the solution antibody concentration increases from 10 to 75 μg/mL to functionalize the substrates, the surface antibody coverage is likely to increase accordingly. The dependence of cell capture on the surface antibody coverage may be explained by the need of multiple interaction points for cell immobilization from a dynamic flowing sample. In addition, soluble CD14 protein in blood may compete with the cells for the surface antibody binding sites, also contributing to the dependence on antibody density. Considering the reagent cost and nearly comparable maximum cell capture density using antibody concentrations of 35 and 75 μg/mL, we chose to functionalize the monocyte depletion chambers of the two-stage devices using anti-CD14 MY4 clone at 35 μg/mL, and injected blood under a shear stress of 0.3 dyn/cm2 for maximal monocyte immobilization.
Fig. 3.
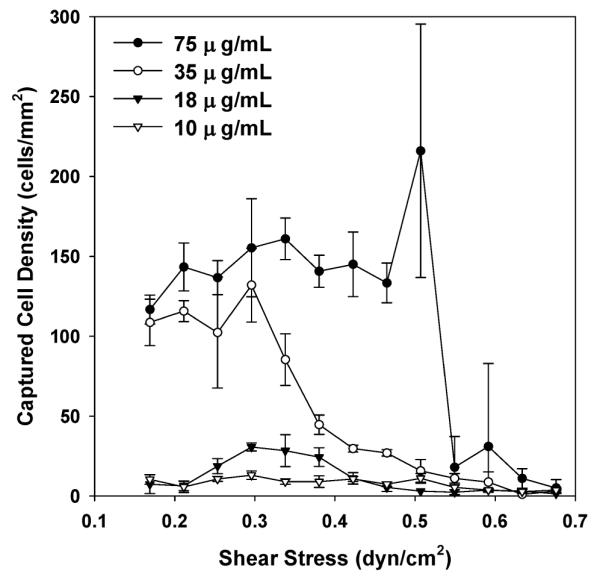
Adhesion of monocytes from whole blood on surfaces functionalized with anti-CD14 MY4 clone in response to shear stress and antibody concentration. Differentiated capture of monocytes in response to varying shear rates was observed. The maximum cell capture density was also a function of the antibody concentration. Considering reagent cost, we chose to use an antibody concentration of 35 μg/mL and shear stress of 0.3 dyn/cm2 for monocyte depletion. Each data point was repeated in 3 devices spanning different shear stress ranges; the error bars represent standard deviations from these measurements.
Effect of rinsing buffer on blood cell displacement
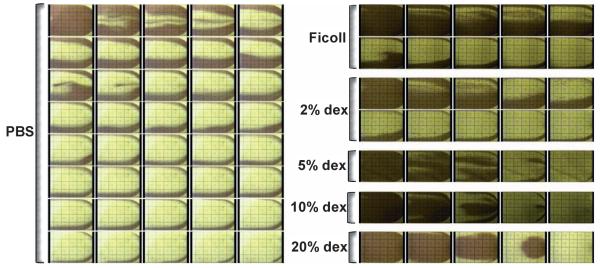
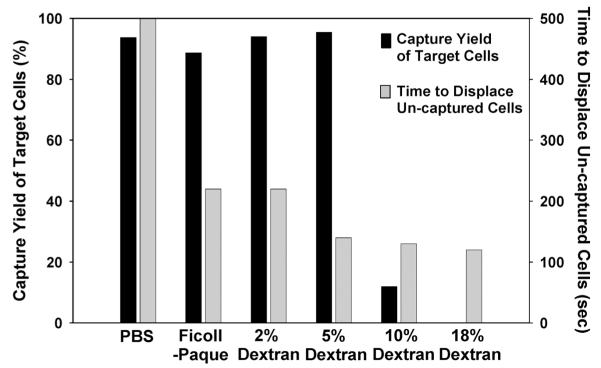
After monocyte capture, monocyte depleted blood needs to be propelled to the CD4+ T cell channel. When PBS buffer was used to displace blood from one microchannel to the next, we observed that the cells in the center of the microchannel were displaced quickly, while the cells near the channel sidewalls remained nearly stagnant (Fig. 4, left panel). Such “viscous fingering” phenomena have been observed by others.18,19 As a result, it takes roughly five microchannel volumes, or 50 microliters, to completely transport all of the unbound cells from the monocyte depletion chamber to the CD4 cell capture channel. At the CD4+ T cell capture flow rate of 5 μL/min, this volume translates to ~10 minutes of displacement time; a shorter displacement time was found to cause a drop in the capture yield of CD4+ T cells (data not shown). To displace cells more efficiently, we tested buffers of higher viscosity and/or density than PBS, since solution viscosity and density influence the shear force and particle transport: a high viscosity buffer is expected to decrease the Reynolds number, promote a laminar flow profile and encourage a plug flow interface between the buffer and whole blood. To increase solution viscosity, we added different concentrations of dextran to PBS. To test the effect of buffer density, we used Ficoll–Paque, a commercially available density centrifugation media for lymphocyte isolation with low viscosity. We injected these solutions into blood-filled microchannels at a flow rate of 5 μL/min, and imaged the blood flow pattern near the channel outlets every 10 seconds (Fig. 4, right panel). From the time-lapsed images, it is observed that significantly less buffer volume is needed with both the dextran and Ficoll–Paque solutions to propel all blood cells out of the microchannels. The most efficient blood cell displacement was observed with the highest viscosity buffers: when the dextran concentration reaches 5% or higher in PBS, nearly no wall layer of slow moving cells was observed. As a result, all blood cells were quickly displaced to the next capture channel. Quantitative comparison of the time to displace all unbound cells from a 10 μL microchannel at a flow rate of 5 μL/min is plotted in Fig. 5. Blood cells can be fully displaced up to 4 times faster using the dextran-containing PBS solutions than with PBS alone.
Fig. 4.
Time lapse images showing the flow profile in microfluidic channels of 50 mm × 4 mm × 50 μm when various rinsing buffers were flowed into blood-filled channels at a flow rate of 5 mL/min. The images were taken every 10 seconds near the device outlets. The dark color in the images represents blood cells remaining in the channels while the clear area results from buffer displacement. As the viscosity of the rinsing buffer increases, the time decreases to displace all the blood cells out of the channel.
Fig. 5.
Effect of the rinsing buffer formula on the time to displace all unbound blood cells (gray bars) and the capture yield of target cells (black bars). Each bar was from a single measurement. The rinsing buffer containing 5% dextran was found to satisfy both fast displacement of unbound cells and minimal detachment of the captured cells. Thus it is used as the rinsing buffer for the cell counting experiments.
While it is desirable to use a high viscosity buffer for fast displacement of unbound cells from the monocyte depletion chambers to the CD4 capture channel, specifically captured cells in both stages of the device should remain attached to the substrate during the displacement process. To characterize how buffers of different viscosities affect the captured cells, we first captured CD4+ T lymphocytes from blood into microfluidic channels (as shown in Fig. 1a), and then injected into the channels different buffers at the same flow rate of 5 μL/min. To analyze the fraction of cells left immobilized inside the microfluidic channels, we compared the CD4+ T cell percentage in the flow-through fractions versus the original samples using flow cytometry. It is observed that almost all of the immunoaffinity captured CD4+ T cells remain attached during the flow of PBS, Ficoll–Paque and up to 5% dextran solutions. When dextran solutions of 10% or 20% were used to displace the unbound cells, most of the captured T cells were sheared off from the device (Fig. 5, black bars). Similar observations were made with monocyte capture (data not shown). Considering the need to displace unbound cells without detaching the captured cells, we chose 5% dextran in PBS as the rinsing solution for subsequent cell counting experiments.
CD4 counts with the double chamber device
After identifying the optimal conditions for monocyte capture and blood displacement, we then constructed a cascaded device with a monocyte depletion chamber connected upstream to a CD4+ T cell capture channel. Since the optimal shear stress for monocyte and CD4+ T cell capture are dramatically different at 0.3 dyn/cm2 and 1.5 dyn/cm2 respectively, we designed four parallel monocyte chambers upstream to the single CD4 capture channel so that a single flow rate of 5 μL/min could satisfy the shear stress requirement for the capture of both cell types. We then used the cascaded device for CD4 counting with venous blood from 11 HIV patients. 10 μL of blood were injected into each device at 5 μL/min to fill up the monocyte chamber. Immediately afterwards, a PBS solution containing 5% dextran was injected into the device at 5 μL/min for 6–8 min to propel blood into the CD4 channel and flush out unbound cells. The total number of cells captured within the CD4 channel was enumerated and compared to CD4 counts obtained by flow cytometry. We also compared results obtained in our single channel devices.
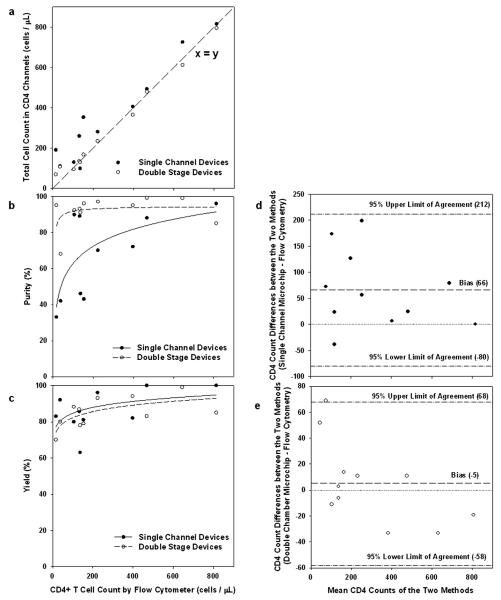
Fig. 6 shows a closer agreement between the microchip and the flow cytometry CD4 cell counts with the double chamber device design, compared with the single channel devices. Improvement over the single channel design is especially significant in the extremely low CD4 count range below 200 cells/μL, a range in which CD4 counts from the single channel devices are consistently higher than the flow cytometry counts. The linear regression of the experimental data for absolute CD4 counts (n = 11, fitting lines not shown) indicates a R2 value of 0.98 between the double stage microchip counts and flow cytometry results, while the R2 value between the single channel microchip counts and flow cytometry counts is 0.84. The single channel devices yielded a positive bias of 66 cells/μL, and 95% limit of agreement of −80 cells/μL and 212 cells/μL using a Bland–Altman methods comparison analysis (Fig. 6d). The same analysis applied to the double channel devices showed a bias of −5 cells/μL and 95% limit of agreement of −58 cells/μL and 68 cells/μL (Fig. 6e), further demonstrating a more accurate CD4 count using the double chamber devices.
Fig. 6.
Comparison of CD4 counting using single channel (solid circles) and double stage devices (empty circles). (a) Correlation of total cell counts in the microchips versus absolute CD4 counts by flow cytometry, using whole blood from 11 HIV+ adult subjects. The linear regression of the experimental data for absolute CD4 counts (n = 11, fitting not shown) indicates a R2 value of 0.98 between the double stage microchip counts and flow cytometry results, while the R2 value between the single channel microchip counts and flow cytometry counts is 0.84. The dashed line represents an ideal 1 : 1 correlation between the two. (b) Purity of the captured CD4+ T cells as a function of the absolute CD4 counts. The CD4+ T cell purity is constant in the 80–90% range in the double stage devices, but drops dramatically at low CD4 counts using the single channel devices. The lines are drawn as a visual guide. (c) Capture yield of CD4+ T cells within the microdevices as a function of the absolute CD4 counts. Fairly consistent yield was observed for absolute CD4 counts up to 800 cells/μL. The lines are drawn as a visual guide. (d) Bland–Altman methods comparing total number of cells captured per microliter of whole blood in the single channel microchip to absolute CD4 cell counts obtained by standard four-color flow cytometry. (e) Bland–Altman methods comparing total number of cells captured per microliter of whole blood in the double chamber microchip to absolute CD4 cell counts obtained by standard four-color flow cytometry. In (d) and (e), the dash lines indicate a bias of 66 and −5 cells/μL, respectively, in the single and double stage devices. The dash–dot lines indicate upper and lower 95% limits of agreement.
The improved performance can be appreciated by inspecting the purity and yield of the target cell capture. The CD4 channels in both microchip designs consistently capture >80% target cells in the clinically relevant range of CD4 counts between 0 and 500 cells/μL (Fig. 6c). However, the target cell purity is greatly enhanced in the low CD4 count range using the cascaded design with monocyte depletion (Fig. 6b). As a result, the microchip counts from the double-stage devices match those from flow cytometry in the whole clinically relevant range (Fig. 6a). By designing the microchannels to match the capture flow rates of the two cell types and by using a high-viscosity rinsing buffer, improved cell counting accuracy is achieved without increasing the device operational complexity, making the design appealing to point-of-care applications.
Conclusion
In conclusion, we improved our design of an immunoaffinity CD4+ T cell isolation device by including a monocyte depletion chamber to reduce contamination from CD4+ monocytes. By optimizing the monocyte capture antibody, microfluidic design and rinsing buffer, we achieved consistent CD4+ T lymphocyte capture purity of ~90% in the full clinically relevant range using the two-stage microfluidic device. The capture yield of the double stage device is in the high 80% range when we displace monocyte-depleted blood using a high viscosity buffer containing 5% dextran. As a result of both high capture purity and yield, the two-stage devices provide CD4 counts comparable to the state-of-the-art flow cytometry measurements in the whole clinically relevant range. The microfluidic strategy of contaminant depletion prior to target cell capture is not limited to CD4 counts; instead it is useful for the isolation of many other cell types that lack a distinct surface marker from a complex biological fluid.
Acknowledgements
We thank Mr Octavio Hurtado for technical support with the microfabrication procedures. This work was partially supported by the National Institute of Biomedical Imaging and Bioengineering under Grant No. P41 EB002503 (BioMEMS Resource Center). Dr William Rodriguez was supported by grants from the National Institutes of Health, the Bill and Melinda Gates Foundation, and the Doris Duke Charitable Foundation. The authors (XC, WR, MT) acknowledge financial interest in Daktari Diagnostics, Inc., which develops low-cost CD4 cell counting systems.
References
- 1.World Health Organization. Joint United Nations Programme on HIV/AIDS [Accessed August 1, 2008];AIDS Epidemic Update. 2005 Dec; Available at: http://libdoc.who.int/unaids/2005/929173439X_eng.pdf.
- 2. [Accessed August 1, 2008];Monitoring antiretroviral treatment with limited laboratory services. Available at: http://www.aidsmap.com/cms1060152.asp.
- 3.Obrien WA, Hartigan PM, Daar ES, Simberkoff MS, Hamilton JD. Ann. Intern. Med. 1997;126:939–945. doi: 10.7326/0003-4819-126-12-199706150-00002. [DOI] [PubMed] [Google Scholar]
- 4.Mellors JW, Munoz A, Giorgi JV, Margolick JB, Tassoni CJ, Gupta P, Kingsley LA, Todd JA, Saah AJ, Detels R, Phair JP, Rinaldo CR. Ann. Intern. Med. 1997;126:946–954. doi: 10.7326/0003-4819-126-12-199706150-00003. [DOI] [PubMed] [Google Scholar]
- 5.Obrien WA, Hartigan PM, Martin D, Esinhart J, Hill A, Benoit S, Rubin M, Lahart C, Wray N, Finegold SM, George WL, Dickinson GM, Klimas N, Diamond G, ZollaPazner SB, Jensen PC, Hawkes C, Oster C, Gordin F, Labriola AM, Spivey P, Matthews T, Weinhold K, Drusano G, Egorin MJ. N. Engl. J. Med. 1996;334:426–431. doi: 10.1056/NEJM199602153340703. [DOI] [PubMed] [Google Scholar]
- 6.PAHO Technical Advisory Committee. Selection and Procurement of HIV/AIDS Diagnostics [Accessed August 1, 2008]; Available at: http://www.paho.org/english/ad/fch/ai/Clinton%20HIV%20Initiative-Selection%20&;%20Procurement.pdf.
- 7.Centers for Disease Control and Prevention MMWR Morbidity and Mortality Weekly Report. 1992. pp. 1–19. [PubMed]
- 8.Crowe S, Turnbull S, Oelrichs R, Dunne A. Clin. Infect. Dis. 2003;37:S25–S35. doi: 10.1086/375369. [DOI] [PubMed] [Google Scholar]
- 9.Cheng X, Irimia D, Dixon M, Sekine K, Demirci U, Zamir L, Tompkins RG, Rodriguez W, Mehmet T. Lab Chip. 2006;7:170–178. doi: 10.1039/b612966h. [DOI] [PMC free article] [PubMed] [Google Scholar]
- 10.Cheng X, Liu YS, Irimia D, Demirci U, Yang LJ, Zamir L, Rodriguez WR, Toner M, Bashir R. Lab Chip. 2007;7:746–755. doi: 10.1039/b705082h. [DOI] [PMC free article] [PubMed] [Google Scholar]
- 11.Cheng XH, Irimia D, Dixon M, Ziperstein JC, Demirci U, Zamir L, Tompkins RG, Toner M, Rodriguez WR. Jaids-Journal of Acquired Immune Deficiency Syndromes. 2007;45:257–261. doi: 10.1097/QAI.0b013e3180500303. [DOI] [PubMed] [Google Scholar]
- 12.Usami S, Chen HH, Zhao YH, Chien S, Skalak R. Ann. Biomed. Eng. 1993;21:77–83. doi: 10.1007/BF02368167. [DOI] [PubMed] [Google Scholar]
- 13.Murthy SK, Sin A, Tompkins RG, Toner M. Langmuir. 2004;20:11649–11655. doi: 10.1021/la048047b. [DOI] [PubMed] [Google Scholar]
- 14.Rodriguez WR, Christodoulides N, Floriano PN, Graham S, Mohanty S, Dixon M, Hsiang M, Peter T, Zavahir S, Thior I, Romanovicz D, Bernard B, Goodey AP, Walker BD, McDevitt JT. PLoS Med. 2005;2:663–672. doi: 10.1371/journal.pmed.0020182. [DOI] [PMC free article] [PubMed] [Google Scholar]
- 15.Sekine K, Revzin A, Tompkins RG, Toner M. J. Immunol. Methods. 2006;313:96–109. doi: 10.1016/j.jim.2006.03.017. [DOI] [PubMed] [Google Scholar]
- 16.Wintergerst ES, Jelk J, Asmis R. Histochem. Cell Biol. 1998;110:231–241. doi: 10.1007/s004180050285. [DOI] [PubMed] [Google Scholar]
- 17.Murphy FJ, Reen DJ. Immunology. 1996;89:587–591. doi: 10.1046/j.1365-2567.1996.d01-788.x. [DOI] [PMC free article] [PubMed] [Google Scholar]
- 18.Fernandez J, Kurowski P, Petitjeans P, Meiburg E. J. Fluid Mech. 2002;451:239–260. [Google Scholar]
- 19.Nittmann J, Daccord G, Stanley HE. Nature. 1985;314:141–144. [Google Scholar]


