

Abstract
The prevalence of adverse childhood experiences (ACEs) among Hawai‘i adults and their impact on the health of affected individuals are unknown. Aiming to provide Hawai‘i State baseline information on ACEs and their associations with health conditions and risk behaviors, the 2010 Hawai‘i Behavioral Risk Factor Surveillance System (BRFSS) included the ACE module. Using 5,928 survey respondents who completed the module, demographic attributes were estimated and multivariate logistic regression analysis was performed to examine the association between ACEs and sixteen selected health indicators. In 2010, approximately 57.8% of Hawai‘i adults reported experiencing at least one ACE. Native Hawaiians had the highest prevalence followed by Whites. Adults aged ≥ 65 years had the lowest prevalence on all ACEs. The prevalence of ACEs was inversely related to education and household income levels. Compared to those without ACEs, adults with ACEs had higher odds for a number of health conditions and risk behaviors. Moreover, as the number of ACEs increased, the odds for these health conditions and risk behaviors increased. Hawai‘i adults with ACEs were more likely to report dissatisfaction with life compared to those without ACEs. Men were more likely to report having a family member in prison, while women were more likely to report experiencing sexual abuse. Recommendations include further research on the unbiased contributions of ACEs to diseases and risk behaviors, and the development of culturally-appropriate interventions to reduce the prevalence of ACEs in Hawai‘i.
Keywords: Adverse childhood experiences, BRFSS, risk factors for chronic disease
Introduction
Adverse childhood experiences (ACEs) refer to a range of negative life experiences that a person may encounter during childhood. These include, but are not limited to, physical, verbal, or sexual abuse, as well as factors associated with familial dysfunction, such as growing up with a mentally ill, substance abusing, or incarcerated family member; parental separation/divorce; or witnessing domestic violence.1,2 Studies have shown that ACEs are common among adults. Kaiser Permanente, in collaboration with the Centers for Disease Control and Prevention (CDC), conducted an ACE study on over 17,000 adult members of a Health Maintenance Organization (HMO) between 1995 and 1997.3 This study found that approximately two-thirds of the participants had at least one ACE. In 2002, the Texas Behavioral Risk Factor Surveillance System (BRFSS) included the ACE survey questions derived from the Kaiser-CDC ACE study and found that 46% of Texan adults reported at least one ACE.4
Research suggests that ACEs may affect child development and are associated with a variety of behavioral and health problems later in life.3,5 ACEs have been linked to a number of medical conditions, such as autoimmune disease, frequent headaches, ischemic heart disease (IHD), liver disease, chronic obstructive pulmonary disease (COPD), and lung cancer.6–11 People with ACEs are at increased risk of smoking, alcohol or drug abuse, and obesity.12–19 ACEs are strongly associated with many indicators of poor mental health such as depression, anxiety, hallucinations, a history of suicide attempts, and an increased utilization of psychotropic medications.14,20–23 People with ACEs are more likely to engage in high risk sexual behaviors, which in turn contribute to an increased risk of teen pregnancy and sexually transmitted diseases.24–27 Moreover, the presence of ACEs is also associated with early initiation of smoking, substance abuse, and sexual activity.12,15,24,28 Finally, people with ACEs tend to be less educated, earn less, and are more likely to be unemployed; and, as a result, they also possess many social risk factors for poor health.4,29 In sum, research has unequivocally established a strong association between experiencing ACEs and multiple indicators of poor health; the greater the number of ACEs one reports, the poorer one's health.1,30
ACEs have been recognized as important risk factors for adult behavioral and health problems. In 2006, ACE questions were incorporated into an optional module of the BRFSS questionnaire. The 2009 BRFSS ACE module consisted of eleven questions adapted from the Kaiser-CDC ACE study. Five states, (Arkansas, Louisiana, New Mexico, Tennessee, and Washington), included the ACE module in their 2009 BRFSS surveys. These population-based ACE surveys yielded results consistent with prior studies.3,4 The report published by CDC in 2010 concluded that approximately 59.4% of respondents in the five states reported one or more ACEs, and 8.7% reported five or more ACEs.2 These findings confirmed that ACEs are common among adults. Furthermore, since ACEs are interrelated, exposure to one ACE substantially increases one's probability of exposure to another.1, 31
The prevalence of ACEs among Hawai‘i adults and their impact on the behavior and health of affected individuals is unknown. The optional ACE module was included for the first time in the 2010 Hawai‘i BRFSS survey to provide baseline information on the prevalence of ACEs in Hawai‘i, and their associations with health conditions and risk behaviors.
Methods
The Hawai‘i BRFSS, sponsored by CDC and implemented by the Hawai‘i State Department of Health, is part of the nationwide BRFSS. The BRFSS is a telephone-based survey conducted by trained interviewers who use a standardized questionnaire and computer-assisted telephone interview system to collect data from a probability sample of non-institutionalized adults residing in Hawai‘i in households with a landline telephones. The 2010 survey, which included the ACE module, had a response rate of 50%.
The 2010 ACE module consisted of 11 questions, which asked survey participants about events that happened before they were 18 years old (Table 1). Of the 6,552 participants who responded to the 2010 BRFSS survey, 5,928 (90.5%) answered all 11 ACE questions and were included in the analysis.
Table 1.
Groups and Categories of ACEs
| Groups and Categories | Questions | Possible Answers | |
| Family dysfunction | |||
| Family member with mental illness | 1. | Did you live with anyone who was depressed, mentally ill, or suicidal? | 1=Yes, 2=No, 7=Don't know / Not sure, 9=Refused |
| Family member with substance abuse Drinking problem |
2. | Did you live with anyone who was a problem drinker or alcoholic? | 1=Yes, 2=No, 7=Don't know / Not sure, 9=Refused |
| Drug abuse | 3. | Did you live with anyone who used illegal street drugs or who abused prescription medications? | 1=Yes, 2=No, 7=Don't know / Not sure, 9=Refused |
| Family member in prison | 4. | Did you live with anyone who served time or was sentenced to serve time in a prison, jail, or other correctional facility? | 1=Yes, 2=No, 7=Don't know / Not sure, 9=Refused |
| Parental separation or divorce | 5. | Were your parents separated or divorced? | 1=Yes, 2=No, 3=Parents not married, 7=Don't know /Not sure, 9=Refused |
| Witnessing domestic violence | 6. | How often did your parents or adults in your home ever slap, hit, kick, punch or beat each other up? | 1=Never, 2=Once, 3=More than once, 7=Don't know /Not sure, 9=Refused |
| Abuse | |||
| Physical abuse | 7. | Before age 18, how often did a parent or adult in your home ever hit, beat, kick, or physically hurt you in any way? Do not include spanking. |
1=Never, 2=Once, 3=More than once, 7=Don't know /Not sure, 9=Refused |
| Verbal abuse | 8. | How often did a parent or adult in your home ever swear at you, insult you, or put you down? | 1=Never, 2=Once, 3=More than once, 7=Don't know /Not sure, 9=Refused |
| Sexual abuse Touched by someone |
9. | How often did anyone at least 5 years older than you or an adult, ever touch you sexually? | 1=Never, 2=Once, 3=More than once, 7=Don't know /Not sure, 9=Refused |
| Made to touch someone | 10. | How often did anyone at least 5 years older than you or an adult, try to make you touch them sexually? | 1=Never, 2=Once, 3=More than once, 7=Don't know /Not sure, 9=Refused |
| Forced to have sex | 11. | How often did anyone at least 5 years older than you or an adult, force you to have sex? | 1=Never, 2=Once, 3=More than once, 7=Don't know /Not sure, 9=Refused |
Questions 2 and 3 were collapsed into an alcohol and drug abuse category, as were questions 9, 10, and 11 into a sexual abuse category. Therefore, the 11 questions yielded eight ACE categories.2 In addition, survey completers who responded with either “Once” or “More than once” to questions 6–11 were collapsed into an “at least once” category. Thus, the analysis for these questions compared individuals who had never experienced these ACEs to those who had experienced them at least once. Using SAS version 9.3 and SUDAAN release 11.0.0,32,33 stratification analysis was performed to assess the prevalence of eight ACEs among Hawai‘i adults by selected demographic characteristics, including sex, age, ethnicity, education level, and annual household income level. Respondents' ethnicities were based on their answer to the question, “Which group best describes you?” Consistent with the State of Hawai‘i's methodology for assigning race-ethnicity, part Native Hawaiians were included in the “Native Hawaiians” category. Age is known to be associated with many risk behaviors and health problems. The association between ACEs and sixteen selected health indicators (Table 2) was examined using multivariate logistic regression analysis, after adjusting for age (18–49, 50–64, and 65 years and older). These three age categories included imputed age for 42 survey respondents with unreported age; the imputation method was developed and validated by CDC, and provided as a calculated variable to the State of Hawai‘i. All percentages reported are weighted to the adult population of the state (ages 18 years and older). For all comparative analyses, an alpha (α) of 0.05 was used for tests of significance.
Table 2.
Selected Health Indicators
| Physical health conditions | Heart attack (or myocardial infarction) Angina (or coronary heart disease) Stroke Chronic obstructive pulmonary disease (COPD) Diabetes |
| Mental health conditions | Lifetime anxiety Lifetime depression Current depression Frequent mental distress (FMD) |
| Risk behaviors | Current smoking Heavy alcohol consumption (heavy drinking) Binge drinking Physical inactivity |
| Self-reported general health | Fair or poor general health |
| Disability | Activity limitation due to health problems |
| Self-reported life satisfaction | Dissatisfied or very dissatisfied with life |
Results
Prevalence of ACEs
Over half (57.8%) of Hawai‘i adults reported at least one ACE, and 8.3% reported five or more ACEs (Figure 1). Among adults with one or more ACEs (524,583), only 8.4% reported experiencing ACE once. The prevalence of individual ACEs ranged from 7.1% to 35.0% (Figure 2). Men and women reported similar prevalence of one or more ACEs (Table 3). However, men were twice as likely as women to have a family member in prison (9.7% vs 4.5%), while women were nearly twice as likely to report having ever been sexually abused (13.1% vs 6.7%; Table 4). The prevalence of ACEs decreased with age, from 65.7% among 18–49 year olds to 37.7% among those aged 65 and older. Adults aged ≥ 65 years were also less likely to report multiple ACEs compared to adults at younger ages (Table 3). The prevalence of individual ACEs varied among ethnic groups, with Native Hawaiians having the highest rates in 4 of the 8 ACEs categories (Table 4). Native Hawaiians had the highest prevalence of ACEs overall (74.9%), followed by Whites (63.8 %) and Filipinos (52.0%; Table 3). Adults with lower education or annual household income levels reported more ACEs in almost every ACE category (Tables 3 and 4).
Figure 1.
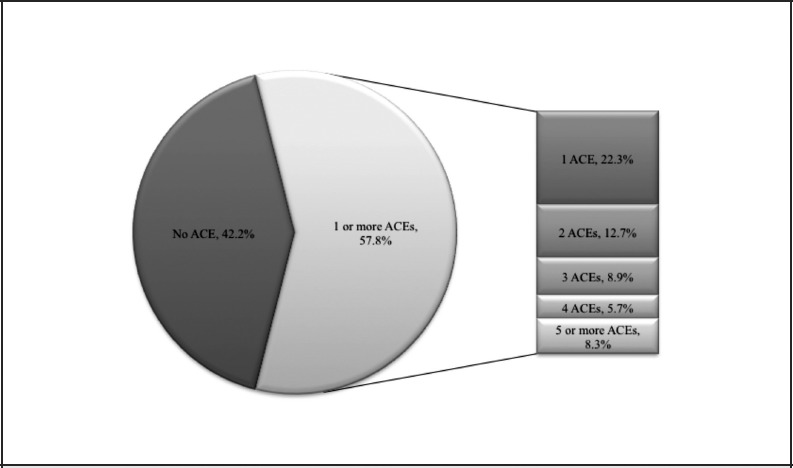
Percentage of Hawai‘i Adults Aged ≥18 Years Reporting ACEs by Total ACEs and Number of ACEs.
Figure 2.
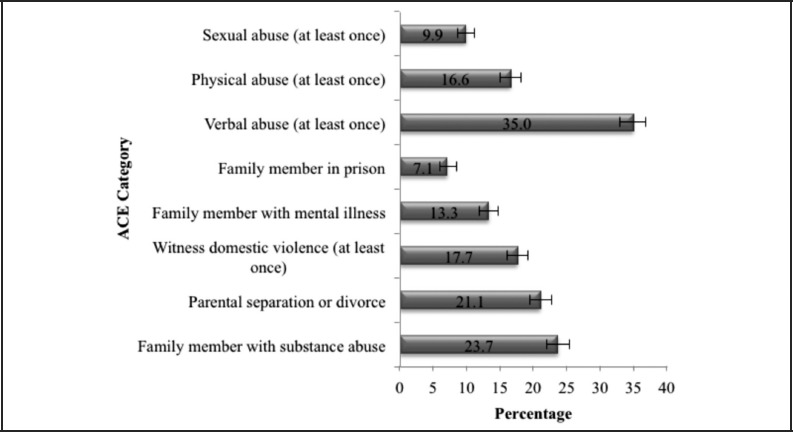
Percentage of Hawai‘i Adults Aged ≥18 Years Reporting ACEs by ACE Category.
Table 3.
Percentage of Adults Aged ≥18 Years Reporting Adverse Childhood Experiences (ACEs), by Number of ACEs Reported and Selected Demographic Characteristics, Hawai‘i Behavioral Risk Factor Surveillance System, 2010
| Demographic characteristics | Number of respondents included in the analysis N |
no ACEs % (95% CI) |
Overall prevalence One or more ACEs % (95% CI) |
Number of ACEs (ACE score) | ||||
| 1 ACE % (95% CI) |
2 ACEs % (95% CI) |
3 ACEs % (95% CI) |
4 ACEs % (95% CI) |
≥5 ACEs % (95% CI) |
||||
| Total | 5928 | 42.2 (40.3–44.1) | 57.8 (55.9–59.7) | 22.3 (20.7–23.9) | 12.7 (11.4–14.1) | 8.9 (7.7–10.1) | 5.7 (4.8–6.6) | 8.3 (7.1–9.5) |
| Sex | ||||||||
| Men | 2407 | 40.8 (38.0–43.8) | 59.2 (56.2–62.0) | 21.8 (19.4–24.3) | 13.5 (11.5–15.7) | 9.6 (7.9–11.7) | 5.4 (4.2–7.0) | 8.8 (7.1–11.0) |
| Women | 3521 | 43.5 (41.1–45.9) | 56.5 (54.1–58.9) | 22.8 (20.7–24.9) | 11.9 (10.4–13.7) | 8.1 (6.9–9.6) | 5.9 (4.9–7.2) | 7.8 (6.5–9.3) |
| Age group (in years) | ||||||||
| 18–49 | 1863 | 34.3 (31.5–37.3) | 65.7 (62.7–68.5) | 22.3 (19.9–25.0) | 14.7 (12.6–17.0) | 10.7 (9.0–12.7) | 6.9 (5.5–8.5) | 11.1 (9.2–13.3) |
| 50–64 | 2088 | 44.2 (41.4–47.1) | 55.8 (52.9–58.6) | 23.4 (21.0–26.0) | 12.1 (10.4–14.0) | 7.5 (6.2–9.1) | 5.8 (4.7–7.2) | 7.0 (5.7–8.4) |
| = 65 | 1977 | 62.3 (59.5–65.0) | 37.7 (35.0–40.5) | 20.7 (18.3–23.2) | 7.7 (6.4–9.3) | 5.4 (4.3–6.7) | 2.1 (1.4–3.1) | 1.9 (1.3–2.9) |
| Ethnicity | ||||||||
| Native Hawaiian | 687 | 25.1 (21.0–29.7) | 74.9 (70.3–79.0) | 22.4 (17.7–27.8) | 14.3 (10.9–18.5) | 13.2 (9.6–17.8) | 10.7 (7.4–15.1) | 14.5 (10.2–20.0) |
| White | 2434 | 36.2 (33.5–39.0) | 63.8 (61.0–66.5) | 21.1 (18.8–23.5) | 13.7 (11.8–15.8) | 10.5 (8.9–12.5) | 7.2 (5.8–8.9) | 11.3 (9.6–13.3) |
| Filipino | 690 | 48.0 (42.4–53.6) | 52.0 (46.4–57.6) | 21.2 (17.0–26.1) | 14.0 (10.2–18.9) | 6.6 (4.4–9.6) | 4.6 (2.8–7.4) | 5.7 (3.3–9.6) |
| Japanese | 1407 | 55.2 (51.4–58.9) | 44.8 (41.1–48.6) | 25.7 (22.5–29.2) | 10.4 (8.1–13.3) | 4.8 (3.4–6.8) | 1.4 (0.8–2.3) | 2.5 (1.5–4.1) |
| Chinese | 296 | 59.7 (52.2–66.9) | 40.3 (33.1–47.8) | 20.3 (15.1–26.6) | 9.6 (6.0–15.0) | 5.8 (2.7–12.2) | 4.1 (1.8–8.9) | 0.5 (0.1–2.2) |
| Others | 414 | 32.2 (25.7–39.5) | 67.8 (60.5–74.3) | 20.6 (15.4–27.2) | 12.8 (8.9–17.9) | 13.5 (9.0–19.8) | 7.5 (4.7–11.8) | 13.4 (8.9–19.8) |
| Education | ||||||||
| High school or less | 1837 | 38.6 (35.3–42.1) | 61.4 (57.9–64.7) | 19.9 (17.3–22.8) | 12.6 (10.4–15.4) | 10.7 (8.5–13.3) | 6.0 (4.5–8.1) | 12.1 (9.8–14.9) |
| Some college | 1647 | 40.8 (37.2–44.4) | 59.2 (55.6–62.8) | 22.3 (19.3–25.6) | 13.4 (11.0–16.2) | 9.0 (7.1–11.3) | 5.6 (4.3–7.3) | 9.0 (6.8–11.8) |
| College and above | 2440 | 46.4 (43.6–49.2) | 53.6 (50.8–56.4) | 24.4 (21.9–27.0) | 12.2 (10.4–14.3) | 7.2 (5.9–8.7) | 5.4 (4.3–6.9) | 4.4 (3.5–5.4) |
| Annual household income | ||||||||
| < $35,000 | 1897 | 38.9 (35.4–42.5) | 61.1 (57.5–64.6) | 21.8 (18.7–25.2) | 11.8 (9.4–14.6) | 11.2 (8.9–14.0) | 5.0 (3.8–6.6) | 11.4 (8.9–14.4) |
| $35,000–$74,999 | 1883 | 42.4 (39.3–45.7) | 57.6 (54.3–60.7) | 20.6 (18.1–23.3) | 13.4 (11.2–15.9) | 9.5 (7.7–11.7) | 6.6 (5.1–8.5) | 7.5 (5.9–9.6) |
| ≥ $75,000 | 1722 | 44.7 (41.5–48.0) | 55.3 (52.0–58.5) | 24.5 (21.8–27.5) | 12.5 (10.5–14.8) | 6.4 (5.2–8.0) | 5.4 (4.1–7.1) | 6.5 (5.1–8.3) |
| Unknown | 426 | 42.8 (35.9–49.9) | 57.2 (50.1–64.1) | 21.6 (16.3–27.9) | 14.2 (9.6–20.5) | 8.2 (4.7–14.1) | 5.8 (2.8–11.8) | 7.5 (3.7–14.4) |
CI=confidence interval.
Table 4.
Percentage of Adults Aged ≥18 Years Reporting Adverse Childhood Experiences (ACEs), by ACE Category and Selected Demographic Characteristics, Hawai‘i Behavioral Risk Factor Surveillance System, 2010
| Demographic characteristics | Number of respondents included in the analysis N |
ACE category | |||||||
| Family member with mental illness % (95% CI) |
Family member with substance abuse % (95% CI) |
Family member in prison % (95% CI) |
Parental separation or divorce % (95% CI) |
Witness domestic violence % (95% CI) |
Physical abuse % (95% CI) |
Verbal abuse % (95% CI) |
Sexual abuse % (95% CI) |
||
| Total | 5928 | 13.3 (12.0–14.7) | 23.7 (22.1–25.4) | 7.1 (6.0–8.4) | 21.1 (19.5–22.7) | 17.7 (16.2–19.3) | 16.6 (15.1–18.2) | 35.0 (33.1–36.9) | 9.9 (8.8–11.2) |
| Sex | |||||||||
| Men | 2407 | 12.8 (10.8–15.0) | 25.4 (22.8–28.2) | 9.7 (7.8–12.1) | 20.9 (18.6–23.5) | 17.7 (15.5–20.2) | 18.2 (16.0–20.7) | 37.0 (34.1– 40.0) | 6.7 (5.3–8.5) |
| Women | 3521 | 13.8 (12.2–15.7) | 22.0 (20.1–24.1) | 4.5 (3.5–5.8) | 21.2 (19.2–23.4) | 17.6 (15.8–19.7) | 15.0 (13.2–17.0) | 33.0 (30.7–35.4) | 13.1 (11.5–14.9) |
| Age group (years) | |||||||||
| 18–49 | 1863 | 16.8 (14.7–19.3) | 27.5 (24.8–30.3) | 10.0 (8.2–12.3) | 27.0 (24.5–29.8) | 20.4 (18.0–23.0) | 19.5 (17.2–22.1) | 42.7 (39.7–45.8) | 10.8 ( 9.0–12.9) |
| 50–64 | 2088 | 11.8 (10.3–13.6) | 23.4 (21.1–25.9) | 4.7 (3.5–6.2) | 16.5 (14.6–18.6) | 17.3 (15.2–19.5) | 15.5 (13.7–17.5) | 32.6 (30.0–35.2) | 10.6 (9.1–12.4) |
| ≥ 65 | 1977 | 4.9 (3.9–6.2) | 13.2 (11.4–15.2) | 1.7 (1.0–2.7) | 9.7 (8.0–11.7) | 10.3 (8.7–12.2) | 9.4 (7.8–11.3) | 15.6 (13.7–17.7) | 6.5 (5.3–8.0) |
| Ethnicity | |||||||||
| Native Hawaiian | 687 | 15.7 (11.7–20.7) | 39.0 (33.3–45.0) | 13.3 (9.1–18.9) | 30.6 (25.5–36.2) | 31.2 (25.9–37.0) | 25.1 (20.0–31.0) | 47.4 (41.6–53.3) | 12.9 (9.3–17.5) |
| White | 2434 | 19.9 (17.6–22.3) | 29.4 (26.8–32.1) | 6.2 (4.8–8.0) | 27.9 (25.3–30.7) | 16.9 (14.9–19.1) | 19.3 (17.2–21.7) | 38.5 (35.7–41.3) | 13.9 (12.1–15.9) |
| Filipino | 690 | 9.9 (6.7–14.2) | 17.2 (13.4–21.8) | 7.5 (4.9–11.3) | 13.7 (10.2–18.2) | 18.7 (14.5–23.8) | 17.4 (13.4–22.3) | 31.3 (26.1–37.0) | 5.1 (3.1–8.1) |
| Japanese | 1407 | 6.8 (5.0–9.1) | 11.8 (9.7–14.2) | 2.1 (1.1–4.0) | 10.3 (8.1–13.1) | 10.0 (8.0–12.4) | 7.2 (5.5–9.3) | 27.0 (23.6–30.7) | 4.7 (3.2–6.9) |
| Chinese | 296 | 5.1 (3.0–8.8) | 11.1 (6.8–17.5) | 2.0 (0.7–6.2) | 8.9 (5.4–14.4) | 11.3 (6.8–18.1) | 7.5 (4.3–12.9) | 27.0 (23.6–30.7) | 4.7 (3.2–6.9) |
| Others | 414 | 15.7 (10.7–22.3) | 32.5 (25.9–39.9) | 16.0 (10.7–23.3) | 32.3 (25.7–39.6) | 22.8 (17.4–29.4) | 23.3 (17.6–30.2) | 39.7 (32.8–47.0) | 16.1 (11.0–22.8) |
| Education | |||||||||
| High school or less | 1837 | 14.5 (11.9–17.6) | 28.8 (25.5–32.3) | 10.9 (8.6–13.8) | 26.7 (23.5–30.1) | 21.7 (18.8–24.9) | 20.6 (17.8–23.7) | 36.3 (32.8–39.9) | 11.3 (9.0–14.1) |
| Some college | 1647 | 14.2 (11.7–17.0) | 24.0 (21.0–27.3) | 8.2 (6.0–11.2) | 23.3 (20.2–26.6) | 17.8 (15.0–21.0) | 16.8 (13.9–20.1) | 36.4 (32.8–40.1) | 9.1 (7.3–11.3) |
| College and above | 2440 | 11.6 (10.0–13.4) | 18.9 (16.9–21.2) | 2.8 (1.9–4.1) | 14.4 (12.5–16.5) | 13.9 (12.1–16.0) | 12.9 (11.2–14.8) | 32.7 (30.0–35.5) | 9.3 (8.0–10.9) |
| Annual household income | |||||||||
| <$35,000 | 1897 | 15.9 (13.1–19.2) | 26.7 (23.4–30.2) | 9.8 (7.6–12.7) | 25.4 (22.1–29.0) | 20.2 (17.2–23.6) | 19.7 (16.8–22.9) | 36.2 (32.5–40.1) | 12.4 (9.8–15.5) |
| $35,000–$74,999 | 1883 | 14.4 (12.2–17.0) | 23.4 (20.7–26.3) | 5.9 (4.2–8.1) | 19.5 (17.0–22.3) | 18.9 (16.4–21.7) | 17.1 (14.7–20.0) | 35.4 (32.2–38.7) | 9.3 (7.7–11.3) |
| ≥$75,000 | 1722 | 11.1 (9.3–13.2) | 20.7 (18.3–23.4) | 3.9 (2.8–5.5) | 18.0 (15.6–20.6) | 14.9 (12.8–17.3) | 13.6 (11.5–16.0) | 34.3 (31.3–37.5) | 10.0 (8.2–12.1) |
| Unknown | 426 | 9.3 (5.4–15.5) | 25.6 (19.0–33.6) | 13.4 (8.0–21.7) | 23.3 (17.5–30.3) | 15.4 (10.3–22.4) | 15.7 (10.4–23.0) | 32.0 (25.1–39.7) | 4.1 (2.5–6.9) |
CI=confidence interval.
Association of ACEs with selected health indicators
The associations of ACEs with sixteen health indicators, including physical health conditions, mental health conditions, risk behaviors, disability, general health, as well as life satisfaction are shown as adjusted odds ratios (AOR) in Tables 5 and 6. When compared to those with no ACEs, adults with one or more ACEs had significantly higher odds for 11 out of the 16 poor health outcomes, including COPD, lifetime anxiety, lifetime depression, current depression, frequent mental distress (FMD), current smoking, heavy drinking, binge drinking, activity limitation (due to physical, mental or emotional problems), fair or poor general health, and general life dissatisfaction. As the number of ACEs increased, the odds for these adverse health outcomes increased (Table 6). By ACE category, adults with a mentally ill household member, or parents separated/divorced, were more likely to report angina than those with no ACEs (Table 5), but there was no clear pattern by number of ACEs reported (Table 6). Similarly, the odds for heart attack were significant when four ACEs were reported.
Table 5.
Association of ACEs with Health Conditions and Unhealthy Behaviors by ACE Category, Hawai‘i Behavioral Risk Factor Surveillance System, 2010
| Health conditions or unhealthy behaviors | Number of respondents included in the analysis with health conditions or unhealthy behaviors N |
ACE categorya | |||||||
| Family member with mental illness AOR (95% CI) |
Family member with substance abuse AOR (95% CI) |
Family member in prison AOR (95% CI) |
Parental separation or divorce AOR (95% CI) |
Witness domestic violence AOR (95% CI) |
Physical abuse AOR (95% CI) |
Verbal abuse AOR (95% CI) |
Sexual abuse AOR (95% CI) |
||
| Physical health conditions | |||||||||
| Heart attack | 265 | 1.8 (0.8–3.9) | 1.7 (1.0–2.7) | 2.7 (0.9–8.2) | 1.1 (0.7–1.9) | 1.6 (1.0–2.5) | 1.6 (1.0–2.5) | 1.3 (0.8–2.0) | 1.5 (0.9–2.5) |
| Angina | 225 | 2.1 (1.1–3.8) | 1.5 (1.0–2.4) | 1.1 (0.5–2.6) | 2.0 (1.1–3.8) | 1.6 (1.0–2.6) | 1.7 (1.0–2.7) | 1.5 (1.0–2.3) | 1.6 (0.9–2.7) |
| Stroke | 226 | 1.5 (0.8–2.8) | 1.5 (0.9–2.4) | 0.7 (0.3–1.8) | 1.5 (0.9–2.5) | 1.5 (0.9–2.5) | 1.9 (1.2–3.1) | 1.4 (0.9–2.1) | 1.1 (0.6–1.9) |
| COPD | 250 | 2.3 (1.4–3.6) | 1.9 (1.2–2.8) | 3.1 (1.6–6.1) | 1.8 (1.1–2.8) | 2.1 (1.4–3.3) | 2.3 (1.5–3.5) | 2.1 (1.4–3.2) | 2.5 (1.6–4.0) |
| Diabetes | 640 | 0.5 (0.4–0.8) | 0.8 (0.6–1.1) | 0.8 (0.4–1.5) | 0.8 (0.6–1.2) | 1.1 (0.7–1.5) | 1.0 (0.7–1.4) | 0.8 (0.6–1.1) | 0.5 (0.3–0.9) |
| Mental health conditions | |||||||||
| Lifetime anxiety | 570 | 7.7 (5.3–11.1) | 4.4 (3.1–6.2) | 4.5 (2.6–8.1) | 3.7 (2.6–5.3) | 3.5 (2.4–5.0) | 4.8 (3.4–6.9) | 4.1 (3.0–5.7) | 7.4 (5.1–10.7) |
| Lifetime depression | 649 | 11.3 (7.8–6.4) | 5.1 (3.6–7.2) | 5.9 (3.4–10.4) | 4.0 (2.8–5.8) | 4.2 (3.0–6.1) | 5.9 (4.1–8.3) | 4.7 (3.4–6.6) | 9.2 (6.4–13.4) |
| Current depression | 307 | 10.1 (6.6–5.5) | 5.8 (3.9–8.6) | 9.7 (5.4–17.4) | 4.8 (3.1–7.5) | 5.5 (3.6–8.4) | 7.8 (5.0–12.0) | 6.4 (4.4–9.4) | 7.4 (4.8–11.5) |
| FMD | 414 | 5.0 (3.3–7.5) | 3.7 (2.6–5.4) | 4.0 (2.2–7.1) | 3.0 (2.0–4.6) | 3.4 (2.2–5.1) | 4.7 (3.2–7.0) | 3.4 (2.3–4.8) | 4.3 (2.8–6.8) |
| Unhealthy behaviors | |||||||||
| Current smoking | 764 | 2.5 (1.8–3.5) | 2.9 (2.2–3.8) | 3.8 (2.4–5.9) | 3.1 (2.3–4.1) | 3.0 (2.2–4.0) | 3.2 (2.4–4.3) | 2.5 (2.0–3.3) | 2.7 (1.9–3.8) |
| Heavy drinking | 413 | 2.6 (1.6–4.2) | 2.9 (1.9–4.2) | 4.4 (2.4–8.1) | 1.6 (1.1–2.4) | 2.2 (1.5–3.4) | 2.3 (1.5–3.5) | 2.0 (1.4–3.0) | 1.8 (1.0–3.1) |
| Binge drinking | 807 | 2.0 (1.4–2.8) | 2.2 (1.7–2.9) | 2.8 (1.8–4.4) | 1.5 (1.1–2.0) | 1.8 (1.3–2.5) | 1.6 (1.1–2.2) | 1.8 (1.4–2.3) | 1.5 (1.0–2.2) |
| Physical inactivity | 1104 | 0.9 (0.6–1.2) | 0.9 ( 0.7–1.1) | 0.9 (0.6–1.4) | 0.9 (0.7– 1.2) | 1.0 (0.7–1.3) | 1.0 (0.7–1.3) | 0.9 ( 0.7–1.2) | 1.1 (0.8–1.6) |
| General health | |||||||||
| Fair or poor general health | 950 | 1.9 (1.4–2.6) | 1.5 ( 1.2–2.0) | 2.8 (1.7– 4.6) | 1.5 (1.1–1.9) | 1.6 (1.2–2.2) | 3.2 (2.4–4.2) | 1.7 (1.3–2.1) | 1.9 (1.3–2.7) |
| Disability | |||||||||
| Activity limitation due to health problem | 1221 | 3.8 (2.8–5.1) | 2.8 (2.1–3.6) | 3.4 (2.2–5.4) | 2.4 (1.8–3.2) | 2.6 (2.0–3.4) | 2.0 (1.4– 2.7) | 2.8 (2.2–3.6) | 4.3 (3.1–5.9) |
| Life satisfaction | |||||||||
| Dissatisfied or very dissatisfied life | 213 | 8.6 ( 4.9–15.1) | 5.7 (3.4–9.6) | 10.7 (5.1–22.8) | 4.4 (2.6– 7.6) | 4.0 (2.3–7.0) | 6.5 (3.9–10.8) | 5.2 (3.2–8.3) | 5.6 (3.2–9.6) |
AOR=adjusted odds ratio (odds ratio was adjusted for age group in years: 18–49, 50–64, and ≥65.)
CI=confidence interval.
COPD=Chronic Obstructive Pulmonary Disease.
FMD=frequent mental distress.
Bolded numbers indicate significant difference compared to referent.
Reference group is individuals with no ACEs.
Table 6.
Association of ACEs with Health Conditions and Unhealthy Behaviors by Number of ACEs Reported, Hawai‘i Behavioral Risk Factor Surveillance System, 2010
| Health conditions or unhealthy behaviors | Number of respondents included in the analysis with health conditions or unhealthy behaviors N |
Number of ACEs (ACE score)a | |||||
| Over all One or more ACEs AOR (95% CI) |
1 ACE (respondents reported 1 ACE) AOR (95% CI) |
2 ACEs (respondents reported 2 ACEs) AOR (95% CI) |
3 ACEs (respondents reported 3 ACEs) AOR (95% CI) |
4 ACEs (respondents reported 4 ACEs) AOR (95% CI) |
≥ 5 ACEs (respondents reported 5 or more ACEs) AOR (95% CI) |
||
| Physical health conditions | |||||||
| Heart attack | 265 | 1.2 (0.8–1.7) | 0.7 (0.4–1.1) | 1.5 (0.9–2.6) | 0.8 (0.5–1.5) | 3.3 (1.2–9.0) | 2.1 (1.0–4.3) |
| Angina | 225 | 1.4 (1.0–2.1) | 1.0 (0.5–1.9) | 1.8 (1.1–3.2) | 1.3 (0.7–2.5) | 1.7 (0.8–3.7) | 2.7 (1.3–5.6) |
| Stroke | 226 | 1.3 (0.9–1.9) | 1.0 (0.6–1.7) | 1.6 (0.9–2.9) | 1.2 (0.6–2.5) | 2.0 (0.9–4.5) | 1.8 (0.9–3.5) |
| COPD | 250 | 1.7 (1.2–2.4) | 1.1 (0.6–2.2) | 1.5 (0.9–2.6) | 2.8 (1.6–4.6) | 2.6 (1.3–5.1) | 2.7 (1.5–4.8) |
| Diabetes | 640 | 0.9 (0.7–1.2) | 1.0 (0.8–1.4) | 0.7 (0.4–1.0) | 1.1 (0.6–1.8) | 0.8 (0.4–1.4) | 0.7 (0.4–1.2) |
| Mental health conditions | |||||||
| Lifetime anxiety | 570 | 3.4 (2.5–4.5) | 1.8 (1.2–2.6) | 3.3 (2.1–5.2) | 3.2 (2.0–5.3) | 6.8 (4.1–11.2) | 7.1 (4.7–10.7) |
| Lifetime depression | 649 | 4.0 (3.0–5.5) | 2.0 (1.4–3.0) | 4.2 (2.8–6.3) | 4.6 (2.9–7.3) | 6.5 (3.9–10.9) | 9.1 (6.0–13.8) |
| Current depression | 307 | 4.6 (3.2–6.6) | 2.2 (1.4–3.6) | 4.7 (2.7–8.2) | 3.8 (2.1–6.8) | 6.9 (3.7–12.9) | 12.8 (8.0–20.6) |
| FMD | 414 | 2.8 (2.0–3.9) | 1.5 (0.9–2.3) | 3.3 (2.0–5.3) | 2.4 (1.3–4.6) | 5.6 (3.2–9.8) | 5.0 (3.2–8.0) |
| Unhealthy behaviors | |||||||
| Current smoking | 764 | 2.3(1.8–2.9) | 1.7 (1.2–2.3) | 1.9 (1.3–2.7) | 2.2 (1.5–3.3) | 3.3 (2.1–5.2) | 4.4 (3.0–6.4) |
| Heavy drinking | 413 | 1.9 (1.3–2.7) | 1.4 (0.9–2.1) | 1.4 (0.9–2.3) | 2.8 (1.6–4.9) | 2.4 (1.2–4.8) | 3.1 (1.8–5.2) |
| Binge drinking | 807 | 1.7 (1.3–2.3) | 1.6 (1.2–2.2) | 1.1 (0.7–1.6) | 2.2 (1.5–3.3) | 2.3 (1.5–3.6) | 2.0 (1.4–3.0) |
| Physical inactivity | 1104 | 1.0 (0.8–1.2) | 1.1 (0.9–1.5) | 0.8 (0.6–1.2) | 0.8 (0.6–1.2) | 0.9 (0.6–1.4) | 1.0 (0.6–1.4) |
| General health | |||||||
| Fair or poor general health | 950 | 1.5 (1.2–1.9) | 1.2 (0.9–1.7) | 1.6 (1.1–2.2) | 1.9 (1.3–2.8) | 1.4 (0.9–2.2) | 2.3 (1.5–3.5) |
| Disability | |||||||
| Activity limitation due to health problem | 1221 | 2.3 (1.8–2.8) | 1.7 (1.3–2.3) | 2.0 (1.5–2.8) | 2.5 (1.7–3.6) | 3.3 (2.2–4.9) | 4.6 (3.1–6.6) |
| Life satisfaction | |||||||
| Dissatisfied or very dissatisfied life | 213 | 4.5 (2.9–7.1) | 2.9 (1.6–5.3) | 3.8 (2.0–7.2) | 6.6 (3.3–13.4) | 5.0 (1.8–14.1) | 8.8 (4.9–15.8) |
AOR=adjusted odds ratio (odds ratio was adjusted for age group in years: 18–49, 50–64, and ≥65.)
CI=confidence interval
COPD=Chronic Obstructive Pulmonary Disease
FMD=frequent mental distress
Bolded numbers indicate significant difference compared to referent
Reference group is individuals with no ACEs
Discussion
Consistent with the findings from the 2009 BRFSS surveys in the five states and by others,2–4 this study demonstrated that ACEs, including multiple ACEs, were common among Hawai‘i adults. Gender differences have been reported on the prevalence of ACEs. Sexual abuse was the most common ACE to have gender differences, with women being more likely to report having suffered sexual abuse during their childhood than men.2,34 Gender differences in the prevalence of physical abuse have not been uniformly reported. While one study suggested that gender is not a risk factor for physical abuse,34 another found that men were more likely to report experiencing physical abuse in childhood than women.35 In Hawai‘i, the prevalence of childhood physical abuse in men was significantly higher than that in women. Interestingly, Hawai‘i men were twice as likely to report having lived with a family member in prison than women. Findings from the 2009 BRFSS surveys in five states did not demonstrate such a gender difference.2
Hawai‘i adults who self-identified as Asian, including Filipinos, Japanese, and Chinese, tended to have lower prevalence of ACEs in most ACE categories compared to Native Hawaiians or Whites. Cultural influences may affect parenting practices and the occurrence of ACEs, as well as the perception and reporting of ACEs, which in turn, may explain the variation of ACE prevalence by ethnic groups. For instance, physical punishment, yelling, and shaming are common and acceptable ways for parents to discipline their children in some countries, including Philippines and China.36–41 Descendants from these countries may not perceive such parenting practices as child abuse and consequently may not report them.39–41 The fear of social stigma may cause some people to deny having experienced certain ACEs. In Chinese culture, maintaining social composure is very important, and openness about familial conflict or shameful events is generally frowned upon.42,43
ACEs decrease with age, with a sharp drop among Hawai‘i adults aged 65 years and older. In addition to having the lowest prevalence for all ACEs, adults aged ≥ 65 years were less likely to report multiple ACEs. These findings were similar to those reported by others and could be the result of premature death among adults age 65 years or older with multiple ACEs.1,2 In fact, one study showed that adults with six or more ACEs were 2.4 times more likely to die at age 65 years or younger, and they died nearly 20 years earlier on average than those without ACEs.28 The low prevalence of ACEs for this age group could also be the result of recall bias secondary to memory decline associated with normal aging processes or changes in perception of one's past life experiences associated with aging.
ACEs have been linked to socioeconomic disadvantages in adulthood. A higher prevalence of ACEs has been observed among people with lower educational achievement, lower household income and those unable to work.4 Consistent with these findings, a higher prevalence of ACEs was observed among Hawai‘i adults with less than a college education and among Hawai‘i adults with household incomes less than $75,000. Socially disparate groups were also more likely to have multiple ACEs. Previous studies have found that ACEs were associated with a number of health conditions. For instance, people with four or more ACEs have a higher odds for diabetes than those without ACEs.1 There is a significant dose-response relationship between ACEs and IHD,1,8 with all but one ACE increasing the risk of IHD.8 People with four or more ACEs are more than twice as likely to have a stroke than those with none.1 In contrast to the findings by others, this study found no relationship between having one ACE and experiencing a heart attack, angina, stroke, or diabetes among Hawai‘i adults. However, the presence of multiple ACEs was associated with increased odds of experiencing a heart attack or angina. COPD showed a strong relationship with ACEs, which was consistent with findings by others.1
The literature has consistently linked ACEs to mental health problems in adulthood. People with a history of childhood physical abuse have significantly higher lifetime rates of anxiety disorders than those without such a history.14 ACEs have been strongly associated with lifetime depression and recent depression and in a significant dose-response manner.20 Similarly, this study found that reports of lifetime anxiety, lifetime depression, and current depression were significantly higher among Hawai‘i adults with ACEs than those without ACEs. Increasing numbers of ACEs were associated with increased odds of having these mental health conditions.
Studies have found that ACEs are strongly associated with smoking.1,12,13 Compared to those without ACEs, people with multiple ACEs had a significantly increased risk for several smoking behaviors, including early smoking initiation, a history of smoking, current smoking, and heavy smoking,1,12,13 Similarly, this study found that ACEs were strongly associated with current smoking. As the number of ACEs increased, the risk for current smoking also increased.
This study also found that adults with ACEs were at an increased risk for heavy and binge drinking, compared to those with no ACEs; moreover, the corresponding AORs were significantly higher among those with three or more ACEs. One ACE study reported that people with four or more categories of ACEs had an increased risk for physical inactivity, compared to those with none.1 This study failed to demonstrate a relationship between ACEs and physical inactivity among Hawai‘i adults.
An overwhelming body of evidence demonstrates that people with ACEs are more likely to report poor general health compared to those without ACEs.4,30,44 In a study of the long-term health effects of physical, sexual, and emotional abuse during childhood in women, researchers found that abused women reported lower ratings of their overall health compared to those with no abuse history.30 Their results showed that the greater the amount of childhood abuse, the poorer one's adult health. Another study also found a significant dose-response relationship between the number of ACEs and poor self-rated health.1 Consistent with these, this study found that Hawai‘i adults with ACEs were significantly more likely to report fair or poor general health, compared to those with no ACEs. In addition, adults with ACEs were at significantly higher odds for activity limitations due to health problems, compared to adults without ACEs. A higher number of ACEs significantly increased the odds for experiencing activity limitations. Furthermore, adults with ACEs were significantly more likely to report dissatisfied lives. The AOR for dissatisfaction increased as the number of ACEs reported increased.
Limitations
This study is subject to several limitations. First, the 2010 BRFSS survey was a random telephone survey of residential households with landlines. Therefore, adults who had no landline telephone access and people who were institutionalized were not represented in the sample. Second, severely impaired adults might have failed to participate or complete the survey, consequently affecting the estimates. Third, responses to BRFSS questions were a self-report of retrospective events, subject to recall bias, with no validation of the exposures. Fourth, due to the sensitivity of ACE topics, underreporting of exposures was a likely but immeasurable confounder. Fifth, some associations with ACEs may have been missed due to small sample size for some chronic conditions. Sixth, because ACE responses of “Once” and “More than once” were combined into an “at least once” category; this study failed to address the differential impact of more persistent experiences of ACEs, compared to one-time events. Nevertheless, fewer than 9% of adults reporting one or more ACEs had only experienced one ACE. Because of these limitations, the prevalence of ACEs in this report may have underestimated the true prevalence of ACEs among Hawai‘i adults. The findings of this study may not be generalizable to the other populations due to the state's diverse population. Additionally, because BRFSS is a cross-sectional survey, no causal relationships can be inferred from this study. The data here should be interpreted as associations only. Despite many potential confounders in the association between ACEs and health conditions, the odds ratios were only adjusted for age, as age was assessed to be the most impactful confounder. Additional variables were not adjusted for to maximize the power of the associations.
It is known that genetic makeup and lifestyle may play important roles in the development of diseases and contribute to certain behaviors among ethnic groups. However, the role of ACEs as a modifier in the development of diseases and risk behaviors among ethnic groups is unclear and beyond the scope of the BRFSS survey. Moreover, a number of studies have shown that some of the ACEs are culturally dependent. 37–41 Further research is warranted to clarify the specific roles of ACEs in the development of health problems and risk behaviors, so that appropriate prevention and intervention can be implemented. Also, given the diversity of the state's population, culturally appropriate approaches must be considered when implementing interventions to prevent ACEs.
Conclusion
Based on the results of the BRFSS 2010 survey, ACEs are common among Hawai‘i adults. Having an ACE, and reporting multiple ACEs, is more prevalent among Native Hawaiians and Whites, younger age groups, those with less education and those with a lower annual household income. ACEs are strongly associated with a number of health conditions and risk behaviors, including COPD, lifetime anxiety, lifetime depression, current depression, FMD, activity limitation, sub-optimal general health, current smoking, heavy drinking, and binge drinking. A higher number of ACEs significantly increases the odds for having these health conditions and risk behaviors. No relationship exists between ACE scores and stroke, diabetes, and physical inactivity. Compared to those without ACEs, Hawai‘i adults with ACEs were more likely to report being dissatisfied with their lives, with a strong relationship between the number of ACEs and life dissatisfaction. Given potential biases in reporting by age and ethnicity and recall bias, more longitudinal studies are needed to tease out the true contributions of ACEs to the development of diseases.
Acknowledgments
The authors would like to thank Tonya Lowery St. John, Ranjani Starr, Donald Hayes, Lola Irvin, and James Ronald Salvail for thoughtful comments on draft of this manuscript. The 2010 Hawai‘i Behavioral Risk Factor Surveillance System (BRFSS) survey is sponsored by the Centers for Disease Control and Prevention and implemented by the Hawai‘i State Department of Health. The ACE module included in the 2010 Hawai‘i BRFSS survey was supported by a grant from the Association of State and Territorial Chronic Disease Program Directors.
Disclaimer
The findings and conclusions in this manuscript are those of the authors and do not necessarily reflect the opinion of the Hawai‘i State Department of Health and the Centers for Disease Control and Prevention.
Conflict of Interest
None of the authors identify a conflict of interest.
References
- 1.Felitti VJ, Anda RF, Nordenberg D, et al. Relationship of childhood abuse and household dysfunction to many of the leading causes of death in adults. The Adverse Childhood Experiences (ACE) Study. Am J Prev Med. 1998 May;14(4):245–258. doi: 10.1016/s0749-3797(98)00017-8. [DOI] [PubMed] [Google Scholar]
- 2.Centers for Disease Control and Prevention, author. Adverse childhood experiences reported by adults-five state, 2009. MMWR Morb Mortal Wkly Rep. 2010 Dec;59(49):1609–1613. [PubMed] [Google Scholar]
- 3.Anda RF, Felitti VJ, Bremner JD, et al. The enduring effects of abuse and related experiences in childhood: a convergence of evidence from neurobiology and epidemiology. Eur Arch Psychiatry Clin Neurosci. 2006;256:174–186. doi: 10.1007/s00406-005-0624-4. [DOI] [PMC free article] [PubMed] [Google Scholar]
- 4.Dube SR, Cook ML, Edwards VJ. Health-related outcomes of adverse childhood experiences in Texas, 2002. Prev Chronic Dis. 2010;7(3):A52. [PMC free article] [PubMed] [Google Scholar]
- 5.Springer KW, Sheridan J, Kuo D, Carnes M. The long-term health outcomes of childhood abuse. An overview and a call to action. J Gen Intern Med. 2003 Oct;18(10):864–870. doi: 10.1046/j.1525-1497.2003.20918.x. [DOI] [PMC free article] [PubMed] [Google Scholar]
- 6.Dube SR, Fairweather D, Pearson WS, Felitti VJ, Anda RF, Croft JB. Cumulative childhood stress and autoimmune disease. Psychom Med. 2009 Feb;71:243–250. doi: 10.1097/PSY.0b013e3181907888. [DOI] [PMC free article] [PubMed] [Google Scholar]
- 7.Anda R, Tietjen G, Schulman E, Felitti V, Croft J. Adverse childhood experiences and frequent headaches in adults. Headache. 2010 Oct;50(9):1473–1481. doi: 10.1111/j.1526-4610.2010.01756.x. [DOI] [PubMed] [Google Scholar]
- 8.Dong M, Giles WH, Felitti VJ, et al. Insights into causal pathways for ischemic heart disease: adverse childhood experiences study. Circulation. 2004 Sep;110(13):1761–1766. doi: 10.1161/01.CIR.0000143074.54995.7F. [DOI] [PubMed] [Google Scholar]
- 9.Dong M, Dube SR, Felitti VJ, Giles WH, Anda RF. Adverse childhood experiences and self-reported liver disease: new insights into the causal pathway. Arch Intern Med. 2003 Sep;163(16):1949–1956. doi: 10.1001/archinte.163.16.1949. [DOI] [PubMed] [Google Scholar]
- 10.Anda RF, Brown DW, Dube SR, Bremner JD, Felitti VJ, Giles WH. Adverse childhood experiences and chronic obstructive pulmonary disease in adults. Am J Prev Med. 2008 May;34(5):396–403. doi: 10.1016/j.amepre.2008.02.002. [DOI] [PMC free article] [PubMed] [Google Scholar]
- 11.Brown DW, Anda RF, Felitti VJ, et al. Adverse childhood experiences are associated with the risk of lung cancer: a prospective cohort study. BMC Public Health. 2010 Jan;10:20. doi: 10.1186/1471-2458-10-20. [DOI] [PMC free article] [PubMed] [Google Scholar]
- 12.Anda RF, Croft JB, Felitti VJ, et al. Adverse childhood experiences and smoking during adolescence and adulthood. JAMA. 1999 Nov;282(17):1652–1658. doi: 10.1001/jama.282.17.1652. [DOI] [PubMed] [Google Scholar]
- 13.Ford ES, Anda RF, Edwards VJ, et al. Adverse childhood experiences and smoking status in five states. Prev Med. 2011 Sep;53(3):188–193. doi: 10.1016/j.ypmed.2011.06.015. [DOI] [PubMed] [Google Scholar]
- 14.MacMillan HL, Fleming JE, Streiner DL, et al. Childhood abuse and lifetime psychopathology in a community sample. Am J Psychiatry. 2001 Nov;158(11):1878–1883. doi: 10.1176/appi.ajp.158.11.1878. [DOI] [PubMed] [Google Scholar]
- 15.Dube SR, Miller JW, Brown DW, et al. Adverse childhood experiences and the association with ever using alcohol and initiating alcohol use during adolescence. J Adolesc Health. 2006 Apr;38(4):444.e1–444.10. doi: 10.1016/j.jadohealth.2005.06.006. [DOI] [PubMed] [Google Scholar]
- 16.Dube SR, Anda RF, Felitti VJ, Edwards VJ, Croft JB. Adverse childhood experiences and personal alcohol abuse as an adult. Addict Behav. 2002 Sep-Oct;27(5):713–725. doi: 10.1016/s0306-4603(01)00204-0. [DOI] [PubMed] [Google Scholar]
- 17.Dube SR, Felitti VJ, Dong M, Chapman DP, Giles WH, Anda RF. Childhood abuse, neglect, and household dysfunction and the risk of illicit drug use: the adverse childhood experiences study. Pediatrics. 2003 Mar;111(3):564–572. doi: 10.1542/peds.111.3.564. [DOI] [PubMed] [Google Scholar]
- 18.Williamson DF, Thompson TJ, Anda RF, Dietz WH, Felitti VJ. Body weight and obesity in adults and self-reported abuse in childhood. Int J Obes Relat Metab Disord. 2002 Aug;26(8):1075–1082. doi: 10.1038/sj.ijo.0802038. [DOI] [PubMed] [Google Scholar]
- 19.Felitti VJ. Childhood sexual abuse, depression, and family dysfunction in adult obese patients: a case control study. South Med J. 1993 Jul;86(7):732–736. doi: 10.1097/00007611-199307000-00002. [DOI] [PubMed] [Google Scholar]
- 20.Chapman DP, Whitfield CL, Felitti VJ, Dube SR, Edwards VJ, Anda RF. Adverse childhood experiences and the risk of depressive disorders in adulthood. J Affect Disord. 2004 Oct;82(2):217–225. doi: 10.1016/j.jad.2003.12.013. [DOI] [PubMed] [Google Scholar]
- 21.Whitfield CL, Dube SR, Felitti VJ, Anda RF. Adverse childhood experiences and hallucinations. Child Abuse Negl. 2005 Jul;29(7):797–810. doi: 10.1016/j.chiabu.2005.01.004. [DOI] [PubMed] [Google Scholar]
- 22.Dube SR, Anda RF, Felitti VJ, Chapman DP, Williamson DF, Giles WH. Childhood abuse, household dysfunction, and the risk of attempted suicide throughout the life span: findings from the Adverse Childhood Experiences Study. JAMA. 2001 Dec;286(24):3089–3096. doi: 10.1001/jama.286.24.3089. [DOI] [PubMed] [Google Scholar]
- 23.Anda RF, Brown DW, Felitti VJ, Bremner JD, Dube SR, Giles WH. Adverse childhood experiences and prescribed psychotropic medications in adults. Am J Prev Med. 2007 May;32(5):389–394. doi: 10.1016/j.amepre.2007.01.005. [DOI] [PMC free article] [PubMed] [Google Scholar]
- 24.Hillis SD, Anda RF, Felitti VJ, Marchbanks PA. Adverse childhood experiences and sexual risk behaviors in women: a retrospective cohort study. Fam Plann Perspect. 2001 Sep-Oct;33(5):206–211. [PubMed] [Google Scholar]
- 25.Hillis SD, Anda RF, Dube SR, Felitti VJ, Marchbanks PA, Marks JS. The association between adverse childhood experiences and adolescent pregnancy, long-term psychosocial consequences, and fetal death. Pediatrics. 2004 Feb;113(2):320–327. doi: 10.1542/peds.113.2.320. [DOI] [PubMed] [Google Scholar]
- 26.Anda RF, Chapman DP, Felitti VJ, et al. Adverse childhood experiences and risk of paternity in teen pregnancy. Obstet Gynecol. 2002 Jul;100(1):37–45. doi: 10.1016/s0029-7844(02)02063-x. [DOI] [PubMed] [Google Scholar]
- 27.Hillis SD, Anda RF, Felitti VJ, Nordenberg D, Marchbanks PA. Adverse childhood experiences and sexually transmitted diseases in men and women: a retrospective study. Pediatrics. 2000 Jul;106(1):E11. doi: 10.1542/peds.106.1.e11. [DOI] [PubMed] [Google Scholar]
- 28.Brown DW, Anda RF, Tiemeier H, et al. Adverse childhood experiences and the risk of premature mortality. Am J Prev Med. 2009 Nov;37(5):389–396. doi: 10.1016/j.amepre.2009.06.021. [DOI] [PubMed] [Google Scholar]
- 29.Liu Y, Croft JB, Chapman DP, Perry GS, Greenlund KJ, Zhao G, Edwards VJ. Relationship between adverse childhood experiences and unemployment among adults from five U.S. states. Soc Psychiatry Psychiatr Epidemiol. 2013 Mar;48(3):357–369. doi: 10.1007/s00127-012-0554-1. [DOI] [PMC free article] [PubMed] [Google Scholar]
- 30.Moeller TP, Bachmann GA, Moeller JR. The combined effects of physical, sexual, and emotional abuse during childhood: long-term health consequences for women. Child Abuse Negl. 1993 Sep-Oct;17(5):623–640. doi: 10.1016/0145-2134(93)90084-i. [DOI] [PubMed] [Google Scholar]
- 31.Dong M, Anda RF, Felitti VJ, et al. The interrelatedness of multiple forms of childhood abuse, neglect, and household dysfunction. Child Abuse Negl. 2004 Jul;28(7):771–784. doi: 10.1016/j.chiabu.2004.01.008. [DOI] [PubMed] [Google Scholar]
- 32.SAS version 9.3. Cary, NC: SAS Institute Inc.; 2010. [Google Scholar]
- 33.SUDAAN release 11.0.0. Research Triangle Park, NC: SUDAAN Statistical Software Center; 2012. [Google Scholar]
- 34.Cappelleri JC, Eckenrode J, Powers JL. The epidemiology of child abuse: findings from the Second National Incidence and Prevalence Study of Child Abuse and Neglect. Am J Public Health. 1993 Nov;83(11):1622–1624. doi: 10.2105/ajph.83.11.1622. [DOI] [PMC free article] [PubMed] [Google Scholar]
- 35.MacMillan HL, Fleming JE, Trocmé N, et al. Prevalence of child physical and sexual abuse in the community. Results from the Ontario Health Supplement. JAMA. 1997 Jul 9;278(2):131–135. [PubMed] [Google Scholar]
- 36.Lansford JE, Chang L, Dodge KA, et al. Physical discipline and children's adjustment: cultural normativeness as a moderator. Child Dev. 2005 Nov-Dec;76(6):1234–1246. doi: 10.1111/j.1467-8624.2005.00847.x. [DOI] [PMC free article] [PubMed] [Google Scholar]
- 37.Gershoff ET, Grogan-Kaylor A, Lansford JE, et al. Parent discipline practices in an international sample: associations with child behaviors and moderation by perceived normativeness. Child Dev. 2010 Mar-Apr;81(2):487–502. doi: 10.1111/j.1467-8624.2009.01409.x. [DOI] [PMC free article] [PubMed] [Google Scholar]
- 38.Runyan DK, Shankar V, Hassan F, et al. International variations in harsh child discipline. Pediatrics. 2010 Sep;126(3):e701–e711. doi: 10.1542/peds.2008-2374. http://pediatrics.aappublications.org/content/126/3/e701.full.html. Accessed August 26, 2013. [DOI] [PubMed] [Google Scholar]
- 39.Zhao Y. Cultural divide over parental discipline. The New York Times. 2002. May 29, [August 21, 2013]. http://www.nytimes.com/2002/05/29/nyregion/cultural-divide-over-parental-discipline.html.
- 40.Yu J. Chinese families charged with child abuse. World Journal. 2002. May 20, [August 21, 2013]. http://www.gothamgazette.com/citizen/june02/chinese-child-abuse.shtml.
- 41.Misconception of child abuse and discipline in the United States: excerpts from an essay by Kieu Tran, undergraduate, University of Colorado at Boulder. [August 21, 2013]. http://www.colorado.edu/journals/standards/V6N1/EDUCATION/ktran.html.
- 42.The cult of face. [August 26, 2013]. China Mike.com web site. http://www.china-mike.com/chinese-culture/understanding-chinese-mind/cult-of-face.
- 43.Li J, Wang L, Fischer KW. The organization of Chinese shame concepts: revised manuscript submitted to Cognition and Emotion. 2003. Jan 3, [August 26, 2013]. http:www.gse.harvard.edu/~ddl/articlesCopy/ShameRevisnFinalFigs.pdf.
- 44.Lang AJ, Laffaye C, Satz LE, et al. Relationships among childhood maltreatment, PTSD, and health in female veterans in primary care. Child Abuse Negl. 2006 Nov;30(11):1281–1292. doi: 10.1016/j.chiabu.2006.06.005. [DOI] [PubMed] [Google Scholar]