Abstract
Current methods for clinical estimation of total body skeletal muscle mass have significant limitations. We tested the hypothesis that creatine (methyl-d3) dilution (D3-creatine) measured by enrichment of urine D3-creatinine reveals total body creatine pool size, providing an accurate estimate of total body skeletal muscle mass. Healthy subjects with different muscle masses [n = 35: 20 men (19–30 yr, 70–84 yr), 15 postmenopausal women (51–62 yr, 70–84 yr)] were housed for 5 days. Optimal tracer dose was explored with single oral doses of 30, 60, or 100 mg D3-creatine given on day 1. Serial plasma samples were collected for D3-creatine pharmacokinetics. All urine was collected through day 5. Creatine and creatinine (deuterated and unlabeled) were measured by liquid chromatography mass spectrometry. Total body creatine pool size and muscle mass were calculated from D3-creatinine enrichment in urine. Muscle mass was also measured by magnetic resonance imaging (MRI), dual-energy x-ray absorptiometry (DXA), and traditional 24-h urine creatinine. D3-creatine was rapidly absorbed and cleared with variable urinary excretion. Isotopic steady-state of D3-creatinine enrichment in the urine was achieved by 30.7 ± 11.2 h. Mean steady-state enrichment in urine provided muscle mass estimates that correlated well with MRI estimates for all subjects (r = 0.868, P < 0.0001), with less bias compared with lean body mass assessment by DXA, which overestimated muscle mass compared with MRI. The dilution of an oral D3-creatine dose determined by urine D3-creatinine enrichment provides an estimate of total body muscle mass strongly correlated with estimates from serial MRI with less bias than total lean body mass assessment by DXA.
Keywords: muscle mass, lean body mass, creatine, creatinine
current methods for clinical estimation of muscle mass have significant limitations. These methods include computerized tomography (CT), magnetic resonance imaging (MRI), dual-energy x-ray absorptiometry (DXA), deuterated water (D2O), and bioelectric impedance (BIA). These methods are expensive (CT, MRI, and DXA), have limited accuracy (BIA), and may be difficult to perform in a clinical trial with a large sample size (CT, MRI, and DXA). More fundamentally, none of these methods measure skeletal muscle mass directly (2, 5, 14, 21, 30), and each method becomes less accurate as a measure of muscle mass if body water content changes (29), a condition that is quite common in many illnesses, which result in muscle wasting. Among the biochemical methods, measurement of 24-h urinary creatinine excretion has been shown to correlate fairly well with muscle mass (13, 34), consistent with the known biochemistry of creatine and creatinine. However, this method relies on the accurate collection of all urine over a 24-h period. While this can be achieved in a specialized unit, missed samples and inexact timing increase variability and reduce accuracy, especially in an out-patient setting.
Creatine is present predominantly (∼95%) in skeletal muscle (1). Roughly 2% of creatine is converted to creatinine per day, via an irreversible, nonenzymatic mechanism, so that ∼2 g per day of creatine are replaced in the whole body. Based on the assumption that conversion of creatine to creatinine is constant among and within subjects, the daily excretion rate of creatinine has been used as a metric of whole body creatine pool size (6). Reviews of this method show that a relatively broad range of muscle mass per gram urinary creatinine (17–22 kg) has been used to estimate muscle mass, leading to large variability in muscle mass estimates between studies, and further suggest limitations to this method in certain patient groups, such as those affected by renal failure (13, 29). Furthermore, there are inherent limitations to this method (in addition to the problem of making 24-h urine collections accurate): pH and temperature affect the nonenzymatic conversion rate of creatine to creatinine, and there is degradation and metabolic removal of creatinine in the body, so all creatinine produced is not excreted in the urine (39).
We tested and validated a direct method in rodents to measure creatine pool size and assess total body skeletal muscle mass (32). The method takes advantage of a number of unique aspects of creatine and creatinine biology. While muscle contains ∼95% of the body creatine pool, it has no capacity to synthesize creatine. Hepatic- and renally synthesized creatine is actively transported into skeletal muscle. Oral creatine is also digested, absorbed, and transported against a concentration gradient into muscle; therefore, the dilution of a stable isotope-labeled creatine taken orally provides an opportunity to measure skeletal muscle creatine enrichment and creatine pool size. Because creatine is converted to creatinine by an irreversible reaction and excreted in urine (39), enrichment of urine creatinine provides a measure of skeletal muscle creatine enrichment and thus whole body creatine pool size and skeletal muscle mass. In cross-sectional studies of both skeletal muscle accrual and atrophy in rats, we demonstrated that an oral dose of creatine (methyl-d3) dilution (D3-creatine) is 100% bioavailable, and the enrichment of D3-creatinine in urine provided an estimate of muscle mass that was strongly correlated with independent estimates of lean mass (32). We further demonstrated that the method can be applied repeatedly to monitor skeletal muscle mass change in longitudinal studies in growing rats (31).
The primary objective of this pilot study was to determine the time course for urine D3-creatinine enrichment to reach isotopic steady state. Additional objectives were as follows: 1) to determine the lowest useful oral dose of D3-creatine to estimate creatine pool size; 2) to determine whether any of the oral tracer dose was excreted into urine and not transported into muscle; and 3) to evaluate this method for estimating muscle mass in humans by comparison with whole body MRI, DXA, and 24-h urine creatinine excretion. These objectives were explored in subjects of both sexes over a range of different muscle masses and age.
MATERIALS AND METHODS
This study was performed at a single site, Pennington Biomedical Research Center (PBRC) (Baton Rouge, LA). The study protocol and informed consent form were approved by the PBRC Institutional Review Board. A written, signed, informed consent was obtained from each subject. Subjects were housed on the in-patient unit for the full 5-day study. Subjects were admitted on day −1, for baseline evaluation and acclimation. After an overnight fast, subjects were given a single oral tracer dose of D3-creatine at 8 AM on day 1 and followed for blood and urine sampling for 5 days.
For the primary objective, urine was collected continuously beginning at baseline, day 1, through day 5 of the study in timed intervals. On day −1, subjects entered the clinic before noon (12 PM), and timed urine collections (0–4, 4–8, 8–12, 12–20 h) began at 12 PM, with 12 PM being time 0, and were completed at 8 AM the next day (day 1). Urine samples were collected on days 1–5 (0–4, 4–8, 8–12, 12–16, and 16–24 h) beginning at 8 am: time 0.
For the secondary objectives, the optimal tracer dose of D3-creatine was assessed in subgroups with varying muscle mass: 13 young men (19–30 yr), 7 older men (70–84 yr), 10 postmenopausal women (51–62 yr), and 5 older women (70–84 yr). The tracer dose of D3-creatine was prepared the day before dosing, under specified temperature and humidity conditions, within a weight range of ±2.0%. The goal was to give the lowest tracer dose so as not to disturb creatine pool/plasma/urine concentrations and allow good assay quantitation. We started with doses of 100 mg in seven young men and four postmenopausal women. Subsequently, doses of 60 mg in six of the young men, 30 mg in six postmenopausal women, and 30 mg in all of the older men and women were administered. The 30-mg tracer dose provided an adequate amount of D3-creatine for assay quantitation, and lower doses were not explored. On day 1, following the single oral dose of D3-creatine at 8 AM, breakfast was provided at 10 AM. Subsequently, meals were provided for breakfast at 8 AM, lunch at 1 PM, and dinner at 6 PM. The calorie content of each meal was as follows: 25% in breakfast, 30% in lunch, and 45% in dinner, with a stable macronutrient content of 45% carbohydrate, 35% fat, and 25% protein (animal and vegetable), to maintain stable ingestion of creatine and creatinine during the in-house portion of the study.
Serial plasma samples were collected for measurement of D3-creatine for the first 12 h after dose in all subjects (0.25, 0.5, 1.0, 1.5, 2.0, 2.5, 3, 4, 5, 6, 8, 10, and 12 h). In the older subjects, sampling was extended to 72 h (24, 36, 48, and 72 h).
Measurement of plasma D3-creatine and urine D3-creatine, D3-creatinine, and unlabeled creatine and creatinine was performed by liquid chromatography/mass spectrometry with a validated, precise assay conforming to industry standards (20, 31). Total body creatine pool size and muscle mass were calculated from D3-creatinine enrichment in urine. Total body muscle mass was measured by MRI (serial cross sections), and total lean body mass (LBM) and appendicular lean mass (ALM) were measured by DXA (15–17), during the subjects' stay at the in-patient unit. The DXA machine was a GE Lunar iDXA, with a software system validated for both bone density and body composition measurements (coefficient of variation ±0.5%). Muscle mass was also estimated from 24-h urine creatinine excretion (13, 34) based on the complete 24-h urine collections done in-house.
Pharmacokinetic methods.
Pharmacokinetic (PK) analysis of D3-creatine plasma concentration-time data was performed using noncompartmental analysis (Phoenix 6.3 WinNonlin 6.3 Pharsight, Certara). The PK parameters included the area under the plasma concentration vs. time curve from time 0 to 24 h [AUC(0–24)] and extrapolation to AUC from time 0 to infinity [AUC(0-∞)], maximum observed plasma concentration (Cmax), time to Cmax, and plasma half-life (T1/2) (initial and terminal). In addition, the systemic clearance of D3-creatine was calculated as dose divided by AUC(0-∞), and renal clearance (CLr) of D3-creatine was calculated as the amount of D3-creatine excreted in the first 24 h postdose divided by the plasma AUC(0–24).
Statistical methods.
The data were analyzed in SAS version 9.2 (SAS Institute, Cary, NC), and the graphs were produced in either SAS or Tibco Spotfire Clinical Graphics. Results are presented as means ± SD, unless noted otherwise. There were no adjustments for multiplicity.
The cumulative amount of D3-creatine in urine represents the amount of the dose not taken up in the body creatine pool. For use in the calculation of creatine pool size and muscle mass, the cumulative amount of D3-creatine excreted in urine and percent of dose excreted over 120 h postdose was calculated.
Total creatinine for each urine collection interval was calculated from the sum of unlabeled creatinine and D3-creatinine after converting the results into molar units. The D3-creatinine enrichment ratio was calculated as D3-creatinine/total creatinine, where both D3 and total creatinine were in molar units. Achievement of steady-state enrichment was determined by a combination of visual inspection and linear regression. To allow for complete distribution of the D3-creatine dose and for the enrichment ratio to reach its maximum, the first 24 h of urine collections postdose were excluded from assessment of steady-state. Linear regression of the enrichment ratio to the midpoint of the urine collection interval was performed separately for each subject. If the slope was statistically significantly different from 0 using α = 0.10, the earliest time point was dropped, and the regression was performed again. This process was repeated until the slope was not statistically significantly different from zero. The earliest time point included in the final regression was defined as the time to achievement of steady state.
Mean enrichment during steady state was calculated for each subject and used in the calculation of creatine pool size and muscle mass. Creatine pool size (g) for each subject was calculated as indicated below, where 131.1/134.1 is the ratio of the molecular weights of unlabeled creatine to D3-creatine.
Muscle mass was estimated by dividing the creatine pool size estimate by 4.3 g/kg, which represents the concentration of creatine in whole wet muscle mass (19).
Muscle mass was also estimated from 24-h urine creatinine excretion (34). For each subject, the mean muscle mass from the first 3 days of urine collections was reported. Estimates of the fractional turnover rate of muscle creatine used in the equation have ranged from 0.014 to 0.018 (33). A value of 0.0169 was used for all subjects in this study (it should be noted that, although this estimate of fractional turnover rate appears to be a reasonable estimate for healthy young men, it is unknown whether it is appropriate for postmenopausal women and older subjects).
Linear regression and Pearson's correlation coefficients were used to examine linear relationships between methods of estimating muscle mass and the strength of the relationship. Because clustering of groups can artificially inflate correlation coefficients, partial correlation coefficients adjusted for sex were computed.
To assess the agreement between MRI and the creatine dilution method and between MRI and DXA total LBM, plots of the difference between the two methods vs. the mean of the two methods were produced using Bland-Altman methodology to ascertain agreement (3).
RESULTS
Subject demographics.
Thirty-five healthy subjects were enrolled from diverse groups to provide a range of muscle mass: 13 young men (19–30 yr), 10 postmenopausal women (51–62 yr), and 7 older men and 5 older women (70–84 yr). Demographics of these subjects are shown in Table 1. Of the 35 subjects enrolled, all received a single oral dose of D3-creatine, and 33 subjects completed the study. One subject, a postmenopausal woman, experienced nausea and emesis shortly after receiving the oral dose of D3-creatine, and a second subject, an older man, withdrew consent from the study on day 3. Both of these subjects were excluded from analyses.
Table 1.
Characteristics of subjects summarized by sex and age
| Postmenopausal Women | Older Women | Young Men | Older Men | Total | |
|---|---|---|---|---|---|
| n | 10 | 5 | 13 | 7 | 35 |
| Age, yr | |||||
| Mean ± SD | 57 ± 3.4 | 76 ± 3.7 | 23 ± 3.6 | 75 ± 4.7 | 51 ± 23 |
| Median (range) | 57 (51–62) | 76 (70–79) | 22 (19–30) | 74 (71–84) | 57 (19–84) |
| Weight, kg | |||||
| Mean ± SD | 79 ± 14 | 67 ± 8.0 | 81 ± 8.1 | 92 ± 6.9 | 81 ± 12 |
| Median (range) | 84 (57–98) | 71 (56–75) | 78 (72–99) | 94 (83–102) | 82 (56–102) |
| Height, cm | |||||
| Mean ± SD | 168 ± 7.0 | 160 ± 8.4 | 178 ± 8.2 | 179 ± 5.3 | 173 ± 10 |
| Median (range) | 166 (156–180) | 164 (150–168) | 176 (165–189) | 179 (171–187) | 173 (150–189) |
| BMI, kg/m2 | |||||
| Mean ± SD | 28 ± 3.7 | 26 ± 3.4 | 26 ± 3.1 | 29 ± 2.0 | 27 ± 3.2 |
| Median (range) | 29 (23–33) | 27 (23–32) | 25 (22–32) | 28 (26–32) | 27 (22–33) |
Values are means ± SD and median (range); n, no. of subjects. BMI, body mass index.
PK of D3-creatine.
The D3-creatine was rapidly absorbed and cleared from plasma (∼80%) within 24 h of the oral tracer dose and essentially cleared by 72 h. Blood levels of D3-creatine were observed at 15 min following a single dose with peak plasma concentrations by 2.5–3.0 h. D3-creatine concentration time profiles for all subjects in the 30-mg dose group are shown in Fig. 1. When blood was sampled up to 72 h postdose, plasma concentrations were measurable at varying times out to 72 h, below or near the lower limits of quantitation (5 ng/ml).
Fig. 1.
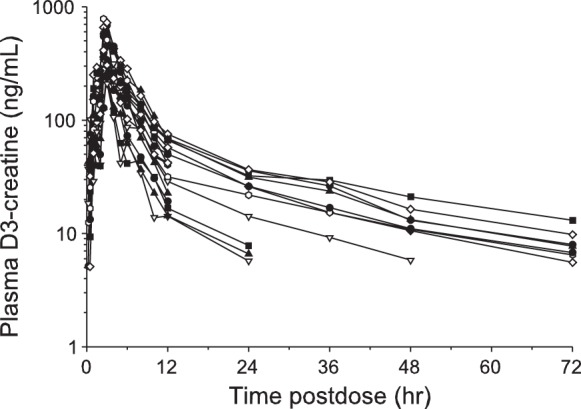
Plasma D3-creatine concentration time profiles for all subjects in the 30-mg dose group. Each individual line represents an individual subject. D3, deuterated.
Comparisons of Cmax and AUC(0–24) between low and high doses in the postmenopausal women and young men indicate dose proportionality, leading to the conclusion that there was no tracer dose effect, and that 30–100 mg is an appropriate dose range for use in our method. The PK parameters are summarized in Table 2.
Table 2.
Summary of plasma and urine D3-creatine pharmacokinetic parameters
| Postmenopausal Women (30-mg Dose) | Older Women (30-mg Dose) | Older Men (30-mg Dose) | Young Men (60-mg Dose) | Young Men (100-mg Dose) | Postmenopausal Women (100-mg Dose) | |
|---|---|---|---|---|---|---|
| n | 6 | 5 | 6 | 6 | 7 | 3 |
| Cmax, ng/ml | ||||||
| Geometric mean | 373 | 668 | 335 | 576 | 1,018 | 1,700 |
| Coefficient of variation, % | 25 | 13 | 12 | 42 | 37 | 20 |
| Tmax, median (range), h | 3.0 (2.5–3.1) | 2.5 (2.5–3.0) | 2.5 (2.5–3.0) | 2.5 (2.5–2.6) | 2.5 (2.5–3.0) | 3.0 (3.0–3.0) |
| AUC(0–24), ng·h−1·ml−1 | ||||||
| Geometric mean | 1,690 | 3,042 | 1,376 | 1,706 | 3,446 | 7,658 |
| Coefficient of variation, % | 35 | 18 | 43 | 18 | 32 | 28 |
| CLs, ml/min | ||||||
| Geometric mean | 293 | 177 | 388 | 581 | 480 | 217 |
| Coefficient of variation, % | 35 | 18 | 41 | 18 | 31 | 30 |
| CLr, ml/min | ||||||
| Geometric mean | 10.7 | 17.7 | 3.1 | 0.58 | 1.71 | 42.6 |
| Coefficient of variation, % | 447 | 69 | 619 | 77 | 350 | 25 |
| Range | 0.72–42 | 6.5–36 | 0.26–28 | 0.38–2.3 | 0.35–39 | 35–56 |
| T1/2†, h | ||||||
| Geometric mean | 3.1 | 3.2 | 3.4 | 2.7 | 3.0 | 2.9 |
| Coefficient of variation, % | 22 | 14 | 19 | 14 | 24 | 12 |
| T1/2‡, h | ||||||
| Geometric mean | NA | 22 | 12.5 | NA | NA | NA |
| Coefficient of variation, % | 17 | 47 | ||||
| Dose urine, median (range), %dose recovered in urine from 0–24 h postdose | 12.6 (0.2–13.5) | 12.1 (3.0–26.5) | 2.06 (0.0–12.6) | 0.08 (0.1–0.4) | 0.37 (0.1–11.6) | 21.0 (13.6–26.4) |
| Dose urine, median (range), %dose recovered in urine from 0–120 h postdose | 16.1 (0.3–18.3) | 17.5 (6.0–34.2) | 3.29 (0.1–17.7) | 0.15 (0.1–0.8) | 0.50 (0.1–14.9) | 25.3 (17.4–33.3) |
n, No. of subjects. D3, deuterated; Cmax, maximum plasma concentration; Tmax, time to Cmax; AUC(0–24), area under curve (plasma exposure 0–24 h); CLs, oral systemic clearance; CLr, renal clearance; T1/2, plasma half-life; NA, not available.
Initial T1/2 calculated and extrapolated using a 12-h timeframe to appropriately compare across groups.
Terminal T1/2 calculated and extrapolated from a 72-h timeframe.
The mean initial T1/2 parameter representing the first phase of decline of the plasma concentration profiles ranged from 2.7 to 3.4 h across all groups. These values are similar to the T1/2 values previously reported (22). The mean terminal T1/2, a second phase of CL and redistribution, ranged from 12.5 to 22 h, and this was measured only in the older group of men and women.
The percentage of D3-creatine recovered in urine over 120 h ranged from 0.1 to 34%, reflecting a broad range of CLr that is related to both age and sex. CLr varied, ranging from 0.05 to 26% of the dose, or 0.26 to 56 ml/min. The renal excretion was lowest in young men, with only 1 of 13 subjects excreting more than 2% of the dose over 5 days. In contrast, one-half of the older men (3/6) excreted >5% of the dose in urine. The women excreted the greatest percentage of their dose in urine (medians at 30-mg dose: 16.1% in the postmenopausal women and 17.5% in the older women). The majority of postmenopausal women (7/9) and all of the older women excreted >5%. In all subjects, the majority of D3-creatine was excreted in urine in the first 24 h postdose (Fig. 2).
Fig. 2.
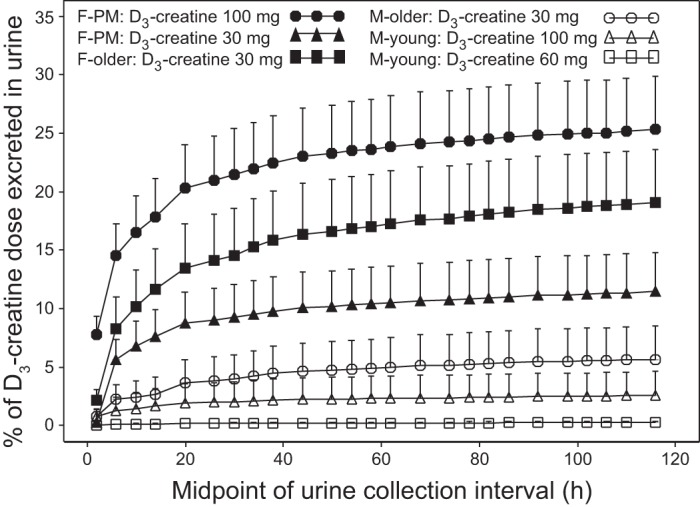
Mean cumulative percentage D3-creatine dose excreted in urine over 5 days. Values are means ± SE. F, female; M, male; PM, postmenopausal.
In an effort to predict D3-creatine urinary excretion, the relationship was examined between the 5-day cumulative excretion of D3-creatine and the ratio of urine unlabeled creatine to urine unlabeled creatinine (Cr/Crn). A log-log plot of the cumulative proportion of the D3-creatine dose excreted after 5 days (Fig. 3) shows a strongly positive relation to unlabeled Cr/Crn [correlation (r) = 0.924, P < 0.0001]. The Cr/Crn in Fig. 3 is from day 4 (0–4 h) and was selected to be in the same time frame as steady-state D3-creatinine enrichment. This relationship also exists when other collection intervals for Cr/Crn are examined, and variability increases with greater D3-creatine urinary excretion (data not shown).
Fig. 3.
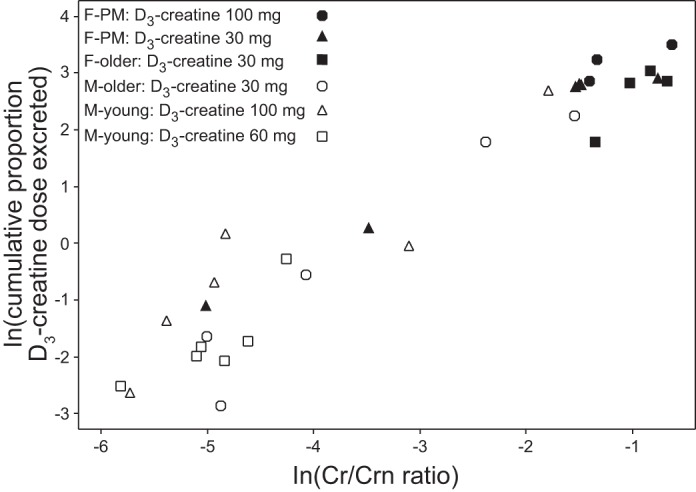
Cumulative proportion of D3-creatine dose excreted in urine over 5 days vs. the ratio of urine unlabeled creatine to urine unlabeled creatinine (Cr/Crn) on day 4, 0–4 h. Both parameters are natural log (ln)-transformed.
Isotopic enrichment of urine.
The mean urine D3-creatinine enrichment ratio for each group is plotted over time in Fig. 4. By comparing enrichment between sexes in the same dose group, enrichment was greater in postmenopausal women than in young men and greater in older women than in older men.
Fig. 4.
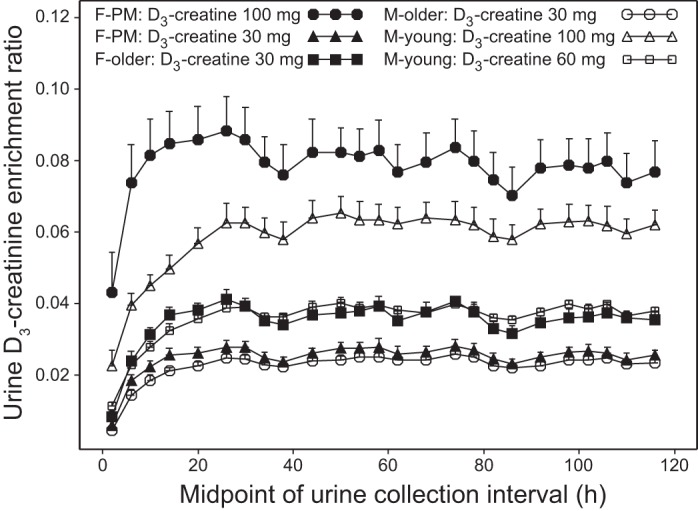
Mean urine D3-creatinine enrichment ratio vs. time (sample intervals for urine collections). Values are means ± SE.
An apparent circadian variation was observed for urinary creatinine enrichment (Fig. 4). The enrichment in urine varied in a wave pattern with an ∼24-h periodicity, with the highest values seen in the overnight fasted time points and lower values observed during the daytime. These findings are consistent with dilution of urinary creatinine by dietary (unlabeled) creatinine.
The time to achievement of steady-state enrichment across all subjects was 30.7 ± 11.33 h. Steady state was observed in the majority of subjects (67%) by 24–28 h postdose, with another 24% achieving steady-state by 32–36 h. It took considerably longer (56–76 h) for three of the women to achieve steady state (Table 2).
Comparison of methods.
The creatine dilution method estimates of creatine pool size and muscle mass or LBM estimates from all methods are summarized in Table 3 and displayed in Fig. 5. Creatine pool size estimates ranged from a low of 66.9 ± 8.4 g in the older women to a high of 158.6 ± 26.9 g in the young men. Similarly, muscle mass estimates from all methods are lowest in older women, followed by postmenopausal women and older men, with highest estimates in young men.
Table 3.
Summary of creatine pool size by D3-creatine dilution method and muscle mass estimates by all methods
| Postmenopausal Women | Older Women | Young Men | Older Men | |
|---|---|---|---|---|
| n | 9 | 5 | 13 | 6 |
| Enrichment method creatine pool size, g | 101.5 ± 17.18 | 66.9 ± 8.43 | 158.6 ± 26.86 | 119.9 ± 13.48 |
| Enrichment method muscle mass, kg | 23.6 ± 4.0 | 15.6 ± 1.96 | 36.9 ± 6.25 | 27.9 ± 3.13 |
| MRI muscle mass, kg | 21.9 ± 3.62 | 16.8 ± 0.52 | 35.4 ± 4.73 | 30.2 ± 2.03 |
| DXA total LBM, kg | 41.1 ± 5.24 | 36.2 ± 1.79 | 58.3 ± 7.43 | 55.3 ± 3.7 |
| DXA ALM, kg | 18.4 ± 2.98 | 15.0 ± 0.50 | 28.3 ± 4.12 | 25.3 ± 2.23 |
| 24-h Urine creatinine method muscle mass, kg | 19.7 ± 4.08 | 13.0 ± 1.52 | 29.7 ± 3.96 | 24.0 ± 2.56 |
Values are means ± SD; n, no. of subjects. MRI, magnetic resonance imaging; DXA, dual X-ray absorptiometry; LBM, lean body mass; ALM, appendicular lean mass.
Fig. 5.
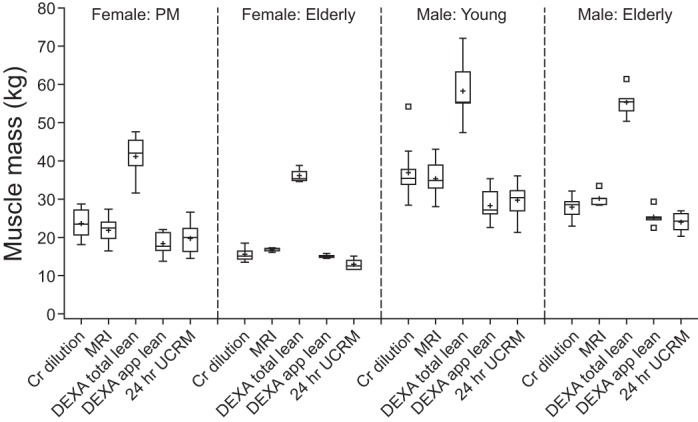
Boxplots of muscle or lean mass estimates by method for each subgroup of subjects. Cr, creatine; DEXA, dual-energy X-ray absorptiometry; MRI, magnetic resonance imaging; UCRM, urine creatinine method.
There is a strong correlation (r = 0.868, P < 0.0001) between MRI total muscle mass and the creatine dilution method estimate of muscle mass (Fig. 6). Differences between MRI and dilution method estimates of muscle mass were plotted against the mean of the two methods (figure not shown). The mean difference (bias) between the two methods is low and indicates that the creatine dilution method yields a higher estimate than MRI by 0.72 kg. Approximately 95% of subjects could be expected to have a muscle measurement by MRI that is within 5.33 kg greater than and 6.77 kg less than that of the creatine dilution method (mean ± 2 SD). All subjects were combined for analysis; it should be noted that the variability appears greater in the men than in the women (data not shown).
Fig. 6.
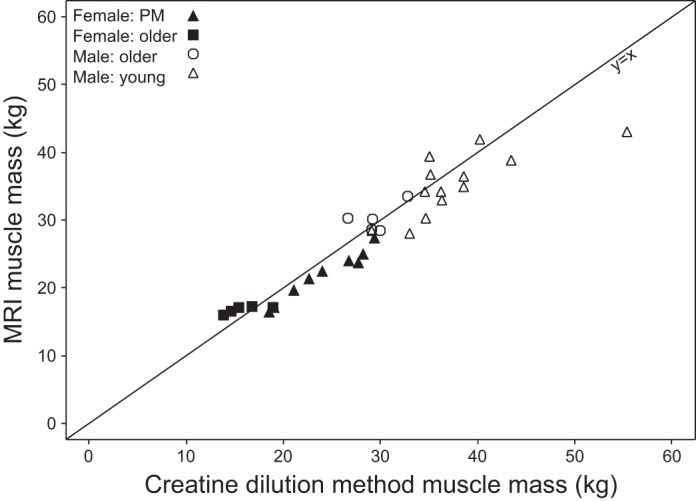
Total muscle mass from MRI vs. muscle mass from the D3-creatine dilution method calculated using mean steady-state D3-creatinine enrichment (r = 0.868, P < 0.0001). r, Pearson's partial correlation coefficient adjusted for sex.
Strong linear relationships were also shown between MRI total muscle mass and both DXA total LBM (r = 0.923, P < 0.0001) and ALM (r = 0.957, P < 0.0001) (Fig. 7). Relative to muscle mass determined by MRI, DXA total LBM consistently overestimated muscle mass with a mean of 21.7 ± 7.02 kg (mean ± 2 SD), and DXA ALM consistently underestimated with a mean of 4.9 ± 4.61 kg (mean ± 2 SD). The correlation between muscle mass determined by MRI and the 24-h urine creatinine method was 0.597 (P = 0.0004) (Fig. 8). The correlation between DXA total LBM and the creatine dilution method was 0.745 (P < 0.0001) (Fig. 9).
Fig. 7.
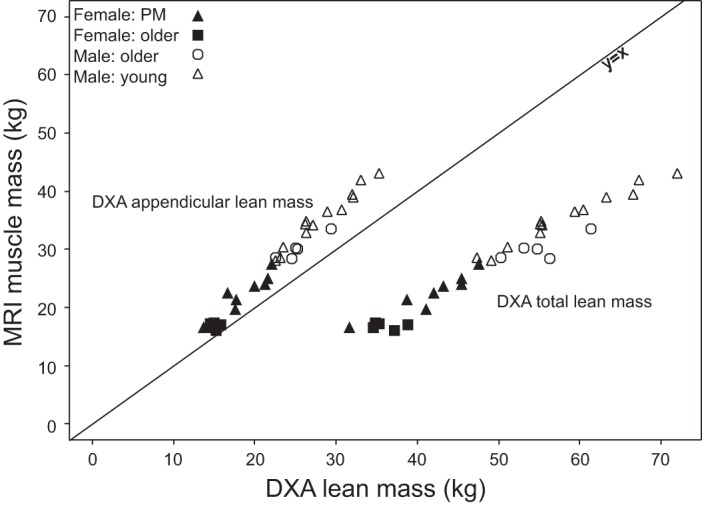
Total muscle mass from MRI vs. dual-energy X-ray absorptiometry (DXA) appendicular lean mass (ALM) (r = 0.957, P < 0.0001) and DXA total lean body mass (LBM) (r = 0.923, P < 0.0001).
Fig. 8.
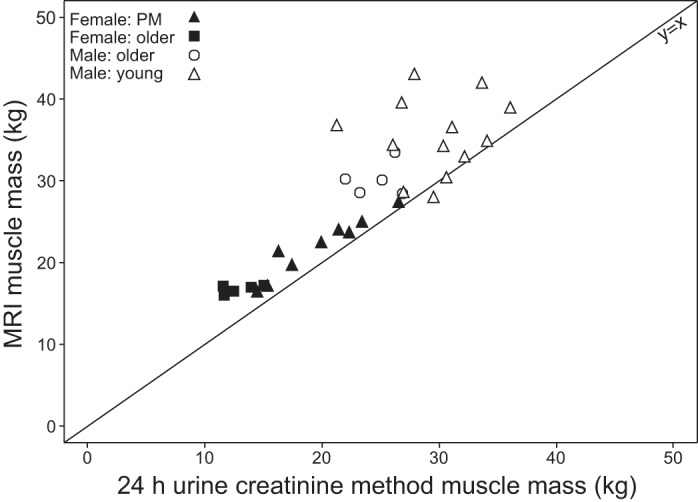
Total muscle mass from MRI vs. muscle mass from 24-h urine creatinine method (r = 0.597, P = 0.0004).
Fig. 9.
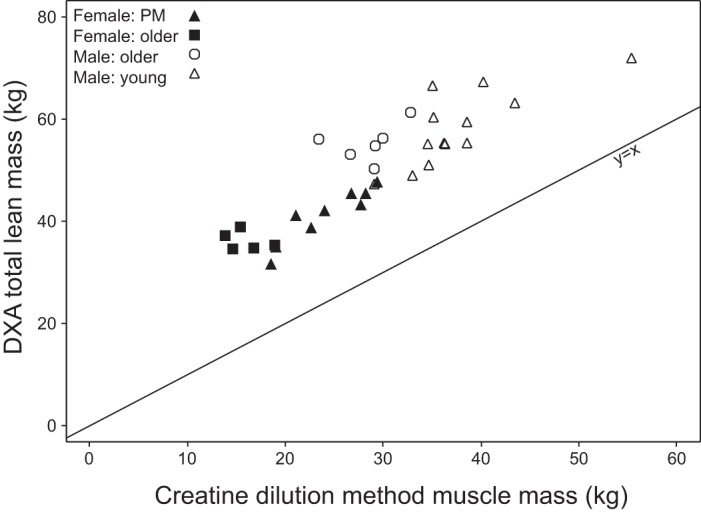
DXA total lean mass vs. muscle mass from the D3-creatine dilution method calculated using mean steady-state D3-creatinine enrichment (r = 0.745, P < 0.0001).
DISCUSSION
This study provides initial validation in humans for the use of this D3-creatine dilution method to measure total body creatine pool size for the determination of total body muscle mass by the enrichment of D3-creatinine in urine. This method takes advantage of the well-described aspects of creatine biology. Up to 95% of total body creatine is found in skeletal muscle, which has no mechanism for creatine synthesis. Creatine synthesized in the kidney and liver is actively transported across a large concentration gradient into muscle. Therefore, an oral dose of tracer quantities of creatine is distributed to all skeletal muscle, and dilution of the tracer can, in principle, be used to determine creatine pool size. Our laboratory's previous study demonstrated that, in the rat, the enrichment of D3-creatinine in urine predicted total body creatine pool size and muscle mass, using an oral dose of D3-creatine (32). There were four main objectives in the present study to facilitate translation of the method to clinical use. First, we measured the amount of time it took to achieve isotopic steady-state levels for urinary D3-creatinine. Second, we determined whether there is an optimal dose of D3-creatine to achieve reproducibly measurable enrichments of urinary D3-creatinine. Third, we determined whether the D3-creatine dose was lost in urine and not transported into muscle, and, if so, how much. Fourth, we compared the estimates of skeletal muscle mass determined from the dilution of an oral dose of D3-creatine with independent measures of amount of muscle [whole body MRI, LBM (DXA), and traditional 24-h urine creatinine excretion]. For the study population, we used four subgroups of subjects with a wide range of muscle mass: large in young men to small in elderly women.
Isotopic steady-state of urinary D3-creatinine enrichment was demonstrated, achieved by 30.7 ± 11.2 h and remaining at steady-state for the duration of the 120-h study. The turnover of the total body creatine pool is slow, and this allows for flexibility in the precise urine sampling time within a 3- to 5-day period after achievement of isotopic steady state. All subjects demonstrated a daily cyclic pattern of enrichment during this steady-state period. Because there is no source of labeled creatinine other than skeletal muscle, making it unlikely that variable entry of labeled molecules can explain systematic variations in enrichment, the daily variability is most likely due to input from unlabeled molecules, i.e., the consumption of food containing unlabeled creatinine. Dietary creatinine is excreted in urine and would dilute the enrichment of labeled creatinine derived from intramuscular creatine. These data suggest that the use of a urine sample collected in the postabsorptive state may reduce this variability.
We examined doses of D3-creatine that ranged from an initial dose of 100 mg to the final dose of 30 mg used in the older subjects. The selection of the initial dose was based on the dose used in the previously published rodent study on a milligram per kilogram basis (32). Subsequently, the dose was reduced to 30 mg, which retained good analytic accuracy and precision for the analysis by liquid chromatography/mass spectrometry.
The study of Stimpson et al. (32) in rats demonstrated that a minimal amount (usually <1%) of orally administered D3-creatine was lost in urine and not transported into skeletal muscle. Loss of the label before mixing with the creatine pool would lead to an overestimate of muscle mass, if this loss were significant and unaccounted. Clearance of D3-creatine is predominantly by entry into skeletal muscle via active transport (19, 22, 33) against a large concentration gradient. However, observed CLr in the present study was variable, ranging from 0.1 to 34% of the dose, or 0.26 to 56 ml/min, comparable to other estimates of renal creatine clearance (12, 23, 24). With the use of the D3-creatine tracer, this is the first definitive measurement of renal creatine clearance. All urine was collected from each subject for the entire period of the study. In this way, we were able to account for any D3-creatine lost in urine. Large intersubject variability in creatine excretion over 24 h was observed, leading to variation in losses of orally delivered deuterium-labeled creatine across the different groups of healthy subjects.
We predicted that D3-creatine would be completely taken up and rapidly mixed with the whole body creatine pool via active transport into sarcoplasm, as observed in the rat. We also expected that once creatine is sequestered in the muscle cell, turnover is based on conversion to creatinine and urinary excretion and not creatine diffusion out of the sarcoplasm. Consistent with these assumptions, the young men in this study showed minimal urinary losses of labeled creatine, save one exception. However, in the other subjects studied (postmenopausal women, older men and women), a greater amount of D3-creatine in urine was observed, until 72 h. Approximately 75% of these subjects showed loss of the D3-creatine tracer in urine exceeding 5% of the tracer dose. The increased excretion of the tracer dose in women and older subjects is a reflection of both CLr and circulating plasma levels of total creatine. Less enrichment (greater dilution) of the tracer in the male subjects is consistent with our hypothesis that urinary creatinine dilution reflects a larger creatine pool size and greater muscle mass in men than in women. However, there is no clear explanation for the differences in these populations. In this study, with complete collection of all urine for the full observational period, the loss of the tracer dose was determined and used for correction of the estimation of the creatine pool size, which allowed an accurate calculation of the creatine pool size.
Figure 3 shows the relationship between the loss of the D3-creatine tracer to the ratio of unlabeled Cr/Crn. The underlying hypothesis here is that subjects who tend to excrete creatine into the urine under basal conditions will excrete more labeled D3-creatine during the study period. The positive nature of the correlation suggests that measuring this ratio may provide a correction for the loss of the D3-creatine tracer in urine. For example, the men in this study who had only trivial loss of D3-creatine also showed the lowest unlabeled Cr/Crn. Also, increased D3-creatine urinary excretion is associated with greater variability. We are currently evaluating the use of this ratio in a fasting 4-h urine collection as a means of correcting for urinary excretion of D3-creatine dose, to eliminate the need for extended urine collections to measure tracer dose recovery.
Several methods are used to estimate muscle mass in humans: DXA, BIA, MRI, CT, total body potassium by 40K, D2O, and 24-h urine creatinine (5, 15, 17, 21, 26, 27, 34). However, with the exception of 24-h creatinine excretion, none provide a direct measure of skeletal muscle mass. Of these methods, whole body MRI provides the most accurate estimate of total body muscle mass. However, MRI requires complex analyses of serial sections across the entire body and is expensive, making it difficult to use in patients other than as a research tool. DXA is readily available, is relatively inexpensive, and has a minimal radiation dose. While many clinical research studies have used DXA to provide an estimate of total LBMs or ALM, the present study shows that DXA overestimates muscle mass considerably compared with MRI and the D3-creatine dilution method, by a roughly twofold factor (Table 3). This overestimation of muscle mass results from the inclusion of organ tissue mass and body water, with the latter being subject to variability, especially in compromised patient populations and in older individuals (17, 26, 30). While BIA is relatively easy to perform, the method provides an estimate of total body water and requires population-specific algorithms for estimates of fat-free mass, and the measurements are highly variable (11, 21, 27). Similarly, D2O provides an estimate of total body water that is dependent on hydration status and shows considerable variability (5). CT scans provide a segmental estimate of cross-sectional area that is not an estimate of whole body skeletal muscle mass. Multiple cross sections to provide an estimate of total body muscle expose a subject to relatively high levels of ionizing radiation (21, 25). Total body potassium provides an accurate assessment of active cell mass through the measurement of total 40K, but this method can only be performed in very few facilities set up for this measurement and is used only for research purposes (35). Also, 24-h urine collection has inherent variability and is dependent on complete subject compliance in the collection process (13, 34).
To convert the calculated creatine pool size to a more understandable measure of muscle mass and to allow a more direct comparison to independent measures of muscle mass used in this study (MRI, DXA, 24-h urine creatinine), we chose a constant of 4.3 g creatine/kg muscle mass. This value was taken from a study that used a creatine-14C dilution method to estimate muscle mass based on 14C retained in body, subtracting urine loss, compared with 14C enrichment in muscle biopsies (19). While their estimate was based on wet muscle mass, the creatine content in muscle was not directly measured in the Kreisberg et al. study (19). More recent literature expresses creatine content on a muscle dry weight basis. Using an approximation of muscle being 75% water (9), the conversion constant for grams creatine per kilogram muscle ranges from 4.09 ± 0.12 to 4.18 ± 0.57 (7, 12, 28, 36), very similar to the value used by Kreisberg et al. (19).
We recognize that there may be variability in the creatine content of muscle among different population subgroups based on sex and age, body mass index, or underlying conditions (1, 10). Among healthy subjects, the largest changes arise from dietary differences or creatine supplementation. Muscle creatine content can be as much as 15% lower among strict vegetarians (35) or 15% higher with high-dose creatine supplementation (28), whereas muscle creatine content is more consistent based on sex and age (1, 10). Information on muscle creatine content in stable chronic diseases is limited, but suggests this may be relatively unaffected (7, 37, 38), except in acute exacerbations (1) and in primary diseases of muscle tissue as muscular dystrophy (8). In this study, we selected subjects from well-defined populations who were in good health, not vegetarians, not using protein or creatine supplements, and on relatively stable diets.
The results of this pilot study suggest the use of the D3-creatine dilution method may provide an alternate method to determine skeletal muscle mass, especially if the method can be applied to a spot urine sample. The method as described in this study shows good accuracy, comparable to MRI, with less bias than DXA. We have further ongoing studies to understand the observed variability and to evaluate methods to reduce variability, using, e.g., fasting spot urine samples, and the application of a correction factor for excretion of dose based on the Cr/Crn. The potential for the latter was demonstrated in this study, where a strong correlation (Fig. 3; r = 0.924, P < 0.0001) was shown between the loss of D3-creatine in urine and the unlabeled Cr/Crn. This method requires further validation in a larger variety of populations, including body mass index, obesity, and patients with chronic conditions. The potential for its use is significant, especially in patients with chronic conditions, where associated muscle loss can impair physical function and result in poor outcomes. Since this method relies on detection of an enrichment ratio of tracer to endogenous creatinine and not quantitative recovery of urine creatinine, we anticipate that the method will also be applicable to patients with impaired renal function. A growing body of literature demonstrates a strong association between reduced muscle mass and adverse outcomes, e.g., association of muscle wasting with increased morbidity, hospitalization, and mortality in elderly people and in patients with cancer, congestive heart failure, and chronic renal failure (4, 18, 25). Furthermore, an easily accessible measure of muscle mass will allow the evaluation of the response to anabolic therapies designed to treat muscle wasting and improve physical function.
In conclusion, we have described the initial clinical study for the validation of a method to estimate muscle mass using a tracer dose of D3-creatine that results in steady-state isotopic enrichment of D3-creatinine, from urine samples taken 3–5 days after ingestion of the tracer. This estimate of total body muscle mass based on creatine pool size showed a strong relationship with estimates from serial MRI cross sections. This method has potential applications for the measurement of skeletal muscle mass in patients experiencing muscle wasting in a variety of conditions, including sarcopenia, as well as evaluating response to anabolic therapy.
GRANTS
Editorial assistance in formatting of this article was provided by Dr. David Griffiths of Fishawack Indicia Ltd., funded by GlaxoSmithKline. W. T. Cefalu is supported in part by one U54 GM104940 from the National Institute of General Medical Sciences of the National Institutes of Health, which funds the Louisiana Clinical and Translational Science Center.
DISCLOSURES
M. K. Hellerstein is chief of SAB and consultant for KineMed Inc., which discovers and markets diagnostic tests. S. M. Turner is employed by KineMed Inc. and has received payment or services from GlaxoSmithKline for a research services agreement. M. K. Hellerstein also has a planned, pending, or issued patent for muscle mass by creatine dilution. W. T. Cefalu has received a research grant from GlaxoSmithKline which was paid to his institute to conduct the research, and other research grants from Johnson & Johnson, AstraZeneca, Lexicon, Mannkind Corp., Sanofi, Intarcia, Bristol-Myers Squibb, Eli Lilly and Co., GlaxoSmithKline, New Chapter, and Nutrition 21. W. J. Evans has been named as an inventor on a patent application related to this research, but will assign his rights to GlaxoSmithKline LLC and KineMed Inc., as required by contractual agreement. A. C. Walker, M. S. Leonard, R. L. O'Connor-Semmes, R. R. Miller, R. V. Clark, S. A. Stimpson are employed by and hold stock/stock options in GlaxoSmithKline. W. J. Evans is a former employee and stockholder of GlaxoSmithKline, and he is now an employee of KineMed Inc. E. Ravussin has no conflicts of interest.
AUTHOR CONTRIBUTIONS
Author contributions: R.V.C., A.C.W., R.L.O.-S., M.S.L., R.R.M., S.A.S., S.M.T., E.R., W.T.C., M.K.H., and W.J.E. conception and design of research; R.V.C., A.C.W., R.L.O.-S., M.S.L., S.M.T., E.R., and W.T.C. analyzed data; R.V.C., A.C.W., R.L.O.-S., M.S.L., R.R.M., S.A.S., S.M.T., E.R., W.T.C., M.K.H., and W.J.E. interpreted results of experiments; R.V.C., A.C.W., and R.L.O.-S. prepared figures; R.V.C., A.C.W., R.L.O.-S., and W.J.E. drafted manuscript; R.V.C., A.C.W., R.L.O.-S., M.S.L., R.R.M., S.A.S., S.M.T., E.R., W.T.C., M.K.H., and W.J.E. edited and revised manuscript; R.V.C., A.C.W., R.L.O.-S., M.S.L., R.R.M., S.A.S., S.M.T., E.R., W.T.C., M.K.H., and W.J.E. approved final version of manuscript; M.S.L. performed experiments.
REFERENCES
- 1.Balsom PD, Söderlund K, Ekblom B. Creatine in humans with special reference to creatine supplementation. Sports Med 18: 268–280, 1994 [DOI] [PubMed] [Google Scholar]
- 2.Baracos V, Caserotti P, Earthman CP, Fields D, Gallagher D, Hall KD, Heymsfield SB, Müller MJ, Rosen AN, Pichard C, Redman LM, Shen W, Shepherd JA, Thomas D. Advances in the science and application of body composition measurement. JPEN J Parenter Enteral Nutr 36: 96–107, 2012 [DOI] [PMC free article] [PubMed] [Google Scholar]
- 3.Bland JM, Altman DG. Statistical methods for assessing agreement between two methods of clinical measurement. Lancet 1: 307–310, 1986 [PubMed] [Google Scholar]
- 4.Cawthon PM, Fox KM, Gandra SR, Delmonico MJ, Chiou CF, Anthony MS, Sewall A, Goodpaster B, Satterfield S, Cummings SR, Harris TB; Health, Aging, and Body Composition Study. Do muscle mass, muscle density, strength, and physical function similarly influence risk of hospitalization in older adults? J Am Geriatr Soc 57: 1411–1419, 2009 [DOI] [PMC free article] [PubMed] [Google Scholar]
- 5.Chumlea WC, Guo SS, Zeller CM, Reo NV, Baumgartner RN, Garry PJ, Wang J, Pierson RN, Jr, Heymsfield SB, Siervogel RM. Total body water reference values and prediction equations for adults. Kidney Int 59: 2250–2258, 2001 [DOI] [PubMed] [Google Scholar]
- 6.Crim MC, Calloway DH, Margen S. Creatine metabolism in men: urinary creatine and creatinine excretions with creatine feeding. J Nutr 105: 428–438, 1975 [DOI] [PubMed] [Google Scholar]
- 7.Fiaccadori E, Del Canale S, Vitali P, Coffrini E, Ronda N, Guariglia A. Skeletal muscle energetics, acid-base equilibrium and lactate metabolism in patients with severe hypercapnia and hypoxemia. Chest 92: 883–887, 1987 [DOI] [PubMed] [Google Scholar]
- 8.Fitch C, Sinton D. A study of creatine metabolism in diseases causing muscle wasting. J Clin Invest 43: 444–452, 1964 [DOI] [PMC free article] [PubMed] [Google Scholar]
- 9.Flear C, Carpenter R, Florence I. Variability in the water, sodium, potassium, and chloride content of human skeletal muscle. J Clin Pathol 18: 74–81, 1965 [DOI] [PMC free article] [PubMed] [Google Scholar]
- 10.Forsberg A, Nilsson E, Werneman J, Bergstrom J, Hultman E. Muscle composition in relation to age and sex. Clin Sci (Lond) 81: 249–256, 1991 [DOI] [PubMed] [Google Scholar]
- 11.Genton L, Karsegard VL, Kyle UG, Hans DB, Michel JP, Pichard C. Comparison of four bioelectrical impedance analysis formulas in healthy elderly subjects. Gerontology 47: 315–323, 2001 [DOI] [PubMed] [Google Scholar]
- 12.Harris RC, Söderlund K, Hultman E. Elevation of creatine in resting and exercised muscle of normal subjects by creatine supplementation. Clin Sci (Lond) 83: 367–374, 1992 [DOI] [PubMed] [Google Scholar]
- 13.Heymsfield SB, Arteaga C, McManus C, Smith J, Moffitt S. Measurement of muscle mass in humans: validity of the 24-hour urinary creatinine method. Am J Clin Nutr 37: 478–494, 1983 [DOI] [PubMed] [Google Scholar]
- 14.Heymsfield SB, Wang J, Lichtman S, Kamen Y, Kehayias J, Pierson RN., Jr Body composition in elderly subjects: a critical appraisal of clinical methodology. Am J Clin Nutr 50: 1167–1175, 1989 [DOI] [PubMed] [Google Scholar]
- 15.Kim J, Heshka S, Gallagher D, Kotler DP, Mayer L, Albu J, Shen W, Freda PU, Heymsfield SB. Intermuscular adipose tissue-free skeletal muscle mass: estimation by dual-energy X-ray absorptiometry in adults. J Appl Physiol 97: 655–660, 2004 [DOI] [PubMed] [Google Scholar]
- 16.Kim J, Shen W, Gallagher D, Jones A, Jr, Wang ZM, Wang J, Heshka S, Heymsfield SB. Total-body skeletal muscle mass: estimation by dual X-ray absorptiometry in children and adolescents. Am J Clin Nutr 84: 1014–1020, 2006 [DOI] [PMC free article] [PubMed] [Google Scholar]
- 17.Kim J, Wang ZM, Heymsfield SB, Baumgartner RN, Gallagher D. Total-body skeletal muscle mass: estimation by a new dual-energy X-ray absorptiometry method. Am J Clin Nutr 76: 378–383, 2002 [DOI] [PubMed] [Google Scholar]
- 18.Kommuri NV, Johnson ML, Koelling TM. Six-minute walk distance predicts 30-day readmission in hospitalized heart failure patients. Arch Med Res 41: 363–368, 2010 [DOI] [PubMed] [Google Scholar]
- 19.Kreisberg RA, Bowdoin B, Meador CK. Measurement of muscle mass in humans by isotopic dilution of creatine-14C. J Appl Physiol 28: 264–267, 1970 [DOI] [PubMed] [Google Scholar]
- 20.Leonard MS, Dunn J, Smith G. Clinical biomarker assay for the quantification of D3-creatine and creatinine using LC-MS/MS. Bioanalysis 6: 745–759, 2014 [DOI] [PubMed] [Google Scholar]
- 21.Lustgarten MS, Fielding RA. Assessment of analytical methods used to measure changes in body composition in the elderly and recommendations for their use in phase II clinical trials. J Nutr Health Aging 15: 368–375, 2011 [DOI] [PMC free article] [PubMed] [Google Scholar]
- 22.Persky AM, Brazeau GA, Hochhaus G. Pharmacokinetics of the dietary supplement creatine. Clin Pharmacokinet 42: 557–574, 2003 [DOI] [PubMed] [Google Scholar]
- 23.Persky AM, Müller M, Derendorf H, Grant M, Brazeau GA, Hochhaus G. Single- and multiple-dose pharmacokinetics of oral creatine. J Clin Pharmacol 43: 29–37, 2003 [DOI] [PubMed] [Google Scholar]
- 24.Poortsman JR, Francaux M. Long-term creatine supplementation does not impair renal function in healthy athletes. Med Sci Sports Exerc 31: 1108–1110, 1999 [DOI] [PubMed] [Google Scholar]
- 25.Prado CM, Lieffers JR, McCargar LJ, Baracos VE, Reiman T, Sawyer MB, Martin L, Baracos VE. Prevalence and clinical implications of sarcopenic obesity in patients with solid tumors of the respiratory and gastrointestinal tracts: a population-based study. Lancet Oncol 9: 629–635, 2008 [DOI] [PubMed] [Google Scholar]
- 26.Proctor DN, O'Brien PC, Atkinson EJ, Nair KS. Comparison of techniques to estimate total body skeletal muscle mass in people of different age groups. Am J Physiol Endocrinol Metab 277: E489–E495, 1999 [DOI] [PubMed] [Google Scholar]
- 27.Roubenoff R, Baumgartner RN, Harris TB, Dallal GE, Hannan MT, Economos CD, Stauber PM, Wilson PW, Kiel DP. Application of bioelectrical impedance analysis to elderly populations. J Gerontol A Biol Sci Med Sci 52: M129–M136, 1997 [DOI] [PubMed] [Google Scholar]
- 28.Sadfar A, Yardley N, Snow R, Melov S, Tarnapolsky M. Global and targeted gene expression and protein content in skeletal muscle of young men following short-term creatine monohydrate supplementation. Physiol Genomics 32: 219–228, 2008 [DOI] [PubMed] [Google Scholar]
- 29.Sarkar SR, Kuhlmann MK, Khilnani R, Zhu F, Heymsfield SB, Kaysen GA, Levin NW. Assessment of body composition in long-term hemodialysis patients: rationale and methodology. J Ren Nutr 15: 152–158, 2005 [DOI] [PubMed] [Google Scholar]
- 30.Soriano JM, Ioannidou E, Wang J, Thornton JC, Horlick MN, Gallagher D, Heymsfield SB, Pierson RN. Pencil-beam vs fan-beam dual-energy X-ray absorptiometry comparisons across four systems: body composition and bone mineral. J Clin Densitom 7: 281–289, 2004 [DOI] [PubMed] [Google Scholar]
- 31.Stimpson SA, Leonard MS, Clifton LG, Poole JC, Turner SM, Shearer TW, Remlinger KS, Clark RV, Hellerstein MK, Evans WJ. Longitudinal changes in total body creatine pool size and skeletal muscle mass using the D3-creatine dilution method. J Cachexia Sarcopenia Muscle 4: 217–223, 2013 [DOI] [PMC free article] [PubMed] [Google Scholar]
- 32.Stimpson SA, Turner SM, Clifton LG, Poole JC, Mohammed HA, Shearer TW, Waitt GM, Hagerty LL, Remlinger KS, Hellerstein MK, Evans WJ. Total-body creatine pool size and skeletal muscle mass determination by creatine-(methyl-D3) dilution in rats. J Appl Physiol 112: 1940–1948, 2012 [DOI] [PubMed] [Google Scholar]
- 33.Tarnopolsky MA, Parshad A, Walzel B, Schlattner U, Wallimann T. Creatine transporter and mitochondrial creatine kinase protein content in myopathies. Muscle Nerve 24: 682–688, 2001 [DOI] [PubMed] [Google Scholar]
- 34.Wang Z, Gallagher D, Nelson ME, Matthews DE, Heymsfield SB. Total-body skeletal muscle mass: evaluation of 24-h urinary creatinine excretion by computerized axial tomography. Am J Clin Nutr 63: 863–869, 1996 [DOI] [PubMed] [Google Scholar]
- 35.Wang Z, Zhu S, Wang J, Pierson RN, Jr, Heymsfield SB. Whole-body skeletal muscle mass: development and validation of total-body potassium prediction models. Am J Clin Nutr 77: 76–82, 2003 [DOI] [PubMed] [Google Scholar]
- 36.Watt K, Garnham A, Snow R. Skeletal muscle total creatine content and creatine transporter gene expression in vegetarians prior to and following creatine supplementation. Int J Sport Nutr Exerc Metab 14: 517–531, 2004 [DOI] [PubMed] [Google Scholar]
- 37.Weber MA, Krakowski-Roosen H, Schroder L, Kinscherf R, Krix M, Kopp-Schneider A, Essig M, Bachert P, Kauczor HU, Hildebrandt W. Morphology, metabolism, microcirculation, and strength of skeletal muscles in cancer-related cachexia. Acta Oncol 48: 116–124, 2009 [DOI] [PubMed] [Google Scholar]
- 38.Willer B, Stucki G, Hoppeler H, Bruhlman P, Krahenbuhl S. Effects of creatine supplementation on muscle weakness in patients with rheumatoid arthritis. Rheumatology (Oxford) 39: 293–298, 2000 [DOI] [PubMed] [Google Scholar]
- 39.Wyss M, Kaddurah-Daouk R. Creatine and creatinine metabolism. Physiol Rev 80: 1107–1213, 2000 [DOI] [PubMed] [Google Scholar]


