

Abstract
Directionally selective (DS) neurons are found in the retina and lateral geniculate nucleus (LGN) of rabbits and rodents, and in rabbits, LGN DS cells project to primary visual cortex. Here, we compare visual response properties of LGN DS neurons with those of layer 4 simple cells, most of which show strong direction/orientation selectivity. These populations differed dramatically, suggesting that DS cells may not contribute significantly to the synthesis of simple receptive fields: 1) whereas the first harmonic component (F1)-to-mean firing rate (F0) ratios of LGN DS cells are strongly nonlinear, those of simple cells are strongly linear; 2) whereas LGN DS cells have overlapped ON/OFF subfields, simple cells have either a single ON or OFF subfield or two spatially separate subfields; and 3) whereas the preferred directions of LGN DS cells are closely tied to the four cardinal directions, the directional preferences of simple cells are more evenly distributed. We further show that directional selectivity in LGN DS neurons is strongly enhanced by alertness via two mechanisms, 1) an increase in responses to stimulation in the preferred direction, and 2) an enhanced suppression of responses to stimuli moving in the null direction. Finally, our simulations show that these two consequences of alertness could each serve, in a vector-based population code, to hasten the computation of stimulus direction when rabbits become alert.
Keywords: direction selectivity, LGN, alert brain state
in rabbits and rodents, computing the direction of visual motion begins in the retina, where directionally selective (DS) ganglion cells project to brainstem targets and the visual thalamus (Huberman et al. 2009; Simpson 1984; Stewart et al. 1971). Whereas most DS ganglion cells respond in spatially overlapping zones to both light onset and offset, some respond only to light onset (Barlow et al. 1964). Mechanisms underlying directional selectivity in retinal ganglion cells (Demb 2007) have been studied intensively in rabbits (e.g., Fried et al. 2002, 2005; Oesch et al. 2005) and more recently in mice (Huberman et al. 2009; Weng et al. 2005; Yoshida et al. 2001). Whereas brainstem projections of retinal DS neurons control aspects of eye position (Cavanaugh et al. 2012; Dhande et al. 2013; Simpson 1984; Yonehara et al. 2009), little is known about the function of the projections of retinal DS neurons to thalamocortical circuits. We have previously shown (Swadlow and Weyand 1985) that DS neurons in rabbit LGN do project to the primary visual cortex (V1), that their axons are fast conducting (similar to those of concentrically organized LGN cells), and that LGN DS neurons are much more prevalent in the representation of the upper visual field (dorsal portion of the LGN) than in the representation the visual streak (the region of high receptor and ganglion cell density representing vision along the horizon; Hughes 1971). However, the manner in which LGN DS neurons contribute to the processing of information in V1 is unknown.
Here, we target DS neurons in the LGN representation of the visual streak of awake rabbits and compare their properties with layer 4 cortical neurons recently studied in the corresponding region of primary visual cortex (V1; Zhuang et al. 2013). The representation of the visual streak is located roughly midway along the dorso-ventral axis within the rabbit LGN, whereas the upper visual field is represented dorsally (Holcombe and Guillery 1984; Hughes 1971). We examined the visual response properties of LGN DS neurons and showed that their responses are highly nonlinear, that they consist of highly overlapping ON and OFF subfields, and that their preferred directions are, like their counterparts in the retina (Oyster and Barlow 1967), restricted to the four cardinal directions. Notably, each of these visual response properties are dramatically distinct from those of V1 layer 4 simple cells studied in the same preparation using identical methods (Zhuang et al. 2013), suggesting that LGN DS neurons do not contribute strongly to the synthesis of the direction/orientation selectivity seen in V1 simple cells. Next, we show that the visual responses of LGN DS cells are strongly modulated by alertness, which increases responses in the preferred direction and suppresses responses in the null direction, making them more directional selective. Finally, we present a simple model and simulations that show how the response changes seen in LGN DS cells during alertness could result in faster computation of stimulus direction by a vector-based population code.
MATERIALS AND METHODS
Extracellular single unit recordings were made in the LGN from five awake adult female Dutch-Belted rabbits. The general surgical procedures have been reported previously (Bereshpolova et al. 2007, 2011; Stoelzel et al. 2008; Swadlow et al. 1998; Zhuang et al. 2013) and are briefly described here. All experiments were conducted under the approval of the University of Connecticut Animal Care and Use Committee in accordance with National Institutes of Health Guidelines.
Animal preparation.
Initial surgery was performed while the animals were under ketamine-acepromazine anesthesia using aseptic procedures. Stainless steel screws were installed on the dorsal surface of the skull and fused together with acrylic cement after removing skin and fascia. A stainless steel rod oriented in a rostrocaudal direction was cemented to the acrylic mass. This rod held the rabbit rigidly during electrode implantation and recording sessions. Silicone rubber was used to buffer the wound margins from the acrylic cement on the skull. After at least 10 days of recovery, neuronal activity recordings were obtained from awake rabbit through a small hole in the skull.
Electrophysiological recordings.
All the electrophysiological recordings were acquired by Plexon data acquisition system (Plexon, Dallas, TX). Single unit recordings from the LGN of awake rabbit were obtained using a chronically implanted seven-channel system with seven quartz-insulated platinum/tungsten (1.5–3 MΩ) electrodes organized concentrically with a spacing of ∼200 μm and each independently controlled by a miniature microdrive (Swadlow et al. 2005). Microelectrodes had a maximum diameter of 40 μm and were pulled to a fine tip and sharpened. Multiunit recordings from superficial layers of superior colliculus (SC) were obtained using a three-channel system similar to the LGN system but with low impedance (<1.5 MΩ) electrodes. Hippocampal EEG and cortical EEG were simultaneously recorded with platinum-iridium microwires for monitoring brain states (Bereshpolova et al. 2007, 2011; Bezdudnaya et al. 2006; Zhuang et al. 2013).
Receptive field and visual stimulation.
Receptive fields were plotted for the LGN cells under study and mapped by reverse correlation (Jones and Palmer 1987; Stoelzel et al. 2008) using sparse noise stimuli made of white and black squares (1–2°; 13.2–19.8 ms), which were pseudorandomly presented on a primary monitor (40 × 30 cm, 48 cd/m2 mean luminance, and 160-Hz refresh rate). Eye movements were monitored by constant tracking of SC multiunit activity and using an infrared eye camera system (see Monitoring eye position for details). Receptive field properties of the cells were tested using sine-wave drifting gratings with optimal parameters (size, temporal frequency, spatial frequency, orientation/direction, and contrast). The orientation/directional tuning was measured with gratings drifting in 1 of the 8, 12, or 24 randomly interleaved directions while keeping other parameters optimal. Spatial frequency tuning was tested from 0.00825 to 1.32 cycles per degree (cpd) while keeping other parameters optimal. Each presentation lasted 3–8 s with 2-s gaps in between (mid-luminance screen was shown to the animal during the gaps). The mean presentation number per condition was 190.4 ±7.68. For some cells, spontaneous activity was also recorded using a screen with mid-luminance.
Cell classification.
After an LGN cell was identified, circular drifting gratings were used to determine if a cell was directionally selective, based on their selectivity to the direction of motion. A direction-selective index (DSI; see below for definition) was calculated, and only cells with DSI >0.4 were considered as DS cells.
We generally studied only DS neurons, but in some cases we compared DS neurons with concentrically organized LGN cells. Concentric cells showed strong surround inhibition with no or very poor orientation/direction selectivity. They were further classified as sustained or transient concentric cells based on their responses to stationary white or black spots, which were presented on the receptive field center of the cell for 2 s with 2-s gaps between stimulation. The spots were chosen to match the size and sign of the receptive field center.
Data from layer 4 simple cells were obtained from reanalysis of the population studied by Zhuang et. al. (2013), and the methods for identifying and studying these cells can be found there.
Search strategy for LGN DS cells.
All LGN cells studied here had receptive fields in the monocular region of visual space, 20–110° from the midline (0° being in front of the animal), at an elevation of +15 to −5° from the horizon. This retinotopic region roughly corresponds to the region of maximal receptor and ganglion cell density in rabbit retina (the visual streak; Hughes 1971), and DS neurons are relatively rare in this retinotopic region of the LGN. Thus Stoelzel et al. (2008) reported only 2/83 (2.4%) DS neurons with receptive fields in this region of visual space. Similarly, Swadlow and Weyand (1985) found only 3.4% LGN DS neurons at elevations of −5 to +15° but found 17.8% DS neurons at elevations >15° (recalculated from the original data set presented in Fig. 5 of Swadlow and Weyand 1985). Nevertheless, we chose to limit our analysis of DS neurons to the representation of visual streak to be able to compare these cells with V1 simple cells studied in this region of visual space (Zhuang et al. 2013, 2014). To achieve this, our strategy was to limit, as much as possible, recordings to DS neurons. This was accomplished by quickly abandoning non-DS neurons following brief visual testing (i.e., neurons that showed roughly equivalent responses to movement in multiple directions around the 4 cardinal directions were discarded).
Fig. 5.
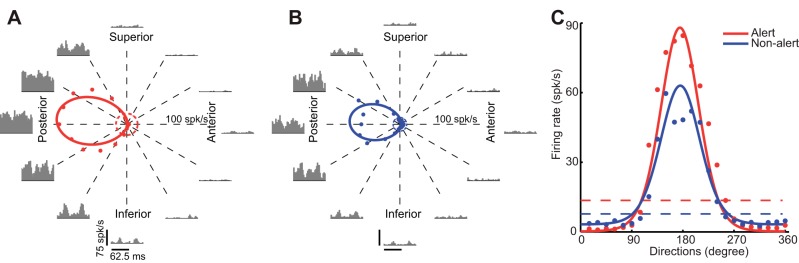
Brain state and orientation/directional tuning. The effects of brain state on 1 DS cell are shown. A and B: tuning curves in alert (A) and nonalert (B) state with PSTHs shown for 12 different directions. Spontaneous rates are shown in dashed circles (alert in red, nonalert in blue). C: superimposed fitted tuning curves in alert (red) and nonalert (blue) state. Spontaneous firing rates are also shown in dashed lines.
Monitoring eye position.
The rabbits generally have very stable eyes and often keep their eye position within ±0.5° for up to several minutes (Bezdudnaya et al. 2006; Collewijn 1971; Swadlow and Weyand 1985). During each recording session, the SC multiunit receptive field positions were mapped with sparse noise stimuli on a secondary LCD monitor (Acer AL1515, 23 × 20 cm, 36 cd/m2 mean luminance, and 75-Hz refresh rate). The relationship between the SC and LGN receptive field center positions was set up during the mapping process when the rabbit's eye was stable. Once an eye movement occurred during the visual stimulation, the stimulus was dynamically moved to be centered on the LGN receptive field center based on this relationship. At the same time, for most cells, the pupil position and size were monitored by an infrared camera system (ViewPoint EyeTracker System; Arrington Research), which was ∼40 cm away from the rabbit eye. Data recorded ±15 s of an eye movement were discarded during offline analysis, and only data recorded during eye stable periods are reported here.
EEG brain states.
The data were segmented into two distinct brain states, alert state and nonalert state, based on the simultaneously recorded hippocampal EEG and cortical EEG activity. The alert state was defined as hippocampal theta activity (5–7 Hz) and cortical desynchronization, while nonalert state was defined as high-voltage irregular hippocampal activity and cortical synchronization. Sometimes, novel nonvisual stimulations (e.g., random sounds and tactile stimulation) were applied to arouse the animal from nonalert to alert states. Power spectrum density graphs were generated for each cell to verify the states separation. Data reported here for alert state range from 14 to 65% of the time that the cells were studied (mean: 33 ± 2.4%) and for nonalert state from 13 to 54% (mean: 31 ± 2.1%). The remaining portions of the data sets (36%, on average) could not be classified unambiguously as either alert or nonalert and were not included in the state analyses.
Data analysis.
Spike waveforms were identified online and verified offline by Plexon cluster analysis software. All data were then analyzed by Plexon NeuroExplorer (Nex Technologies) and MATLAB (The MathWorks).
Data of the first two cycles of each presentation were removed to discard transient responses to stimulus onset. Then, with the use of Fourier analysis, the mean firing rate (F0) and first harmonic component (F1) of peristimulus time histograms (PSTH) graphs were calculated for further analysis. Unlike concentric cells in the LGN, which respond to a drifting grating with strong modulations of the temporal frequency tested (F1 modulation), the DS cells responded mainly with an increase in the mean firing rate (F0). F1 modulations were hardly seen in LGN DS cells (see below for one exception). Therefore, except for measurements of spatial frequency tuning, all other measurements are reported as F0 responses only (total firing rate, spontaneous rate was not subtracted).
Burst is defined as a cluster of at least 2 spikes with an interspike interval ≤4 ms and with the first spike of the burst having a preceding interspike interval of ≥100 ms (Bezdudnaya et al. 2006; Lu et al. 1992).
Statistical significance was determined by independent sample t-test, unless otherwise stated. Means ± SE are represented for figures with bar graphs (*P < 0.05; **P < 0.01; ***P < 0.001).
Receptive field structure.
The receptive field structure was measured by reverse correlation (Jones and Palmer 1987; Stoelzel et al. 2008) with sparse noise stimuli, and ON/OFF receptive field matrices were generated with a 20-ms time window around the peak response. The matrices were smoothed with a Gaussian filter, and a 30% threshold was applied. Contour plot lines were fitted using bicubic interpolation, and each line represents a 10% decrement. To measure the overlap between ON and OFF responses, the local similarity index (LSI) was calculated as follows:
RFON and RFOFF are the ON and OFF receptive field matrices after applying the filter and threshold. The values of LSI range from 0 to 1. LSI equals 1 when ON and OFF receptive fields totally overlap with each other and equals 0 when they are entirely separated.
Directional tuning.
Directional tuning for each cell was measured as the average of F0 responses measured with gratings pseudorandomly drifting in 8, 12, or 24 directions. For each cell, the preferred direction, DSI, and orientation-selective index (OSI) were calculated. In addition, we calculated direction selectivity based on circular variance (CVd) and orientation selectivity based on circular variance (CVo) (Piscopo et al. 2013). The preferred direction was computed as the vector sum of the responses in all the directions. The DSI, OSI, CVd, and CVo were calculated as follows:
where Rpref is the F0 response in the measured preferred direction, which was defined as the stimulus direction closest to the vector sum of responses across all directions. Rnull is the F0 response in the stimulus direction 180° opposite of the preferred direction; Rorth is the averaged F0 response in the stimulus directions 90° away from the preferred direction; j represents all the directions tested; and Rj and θj are the F0 responses and angles (in radians) in jth direction. DSI, OSI, CVd, and CVo range from 0 to 1; all of them approach 1 in neurons with strong direction or orientation selectivity and approach 0 in neurons with poor direction or orientation selectivity. DSI and OSI only take the responses from two or three points of the tuning curve into account, while CVd and CVo measure the index from all the points of the tuning curve and are more robust. Only cells with DSI >0.4 were considered as DS cells.
The tuning curve of each cell was fitted by the von Mises distribution, modified from Elstrott et al. (2008):
where R is the F0 response in any given direction x; Rmax is the maximum F0 response; μ is the preferred direction in radians; and k is the concentration parameter for tuning width. The half-tuning width at half height (HWHH) of the fitted tuning curve was measured as follows:
This HWHH parameter shows the sharpness of the orientation/directional tuning.
Spatial frequency and response linearity.
Spatial frequency tuning responses were measured with the spatial frequency of the grating ranging from 0.00825 to 1.32 cpd (for some cells: 0.05 to 1.32 cpd). For measuring the response linearity, the spatial frequency tuning of both F0 and F1 responses was measured and analyzed. The tuning curves were fitted by Gaussian model:
where y is the F0 or F1 response to each spatial frequency (x) tested; R0 is the baseline activity; SFpeak is the spatial frequency that elicits the maximum response (Rsf); and σsf is the standard deviation of the spatial tuning curve (the width of the Gaussian function). Here, the sum of R0 and Rsf was considered as the peak F0 or peak F1 response.
To measure the response linearity of the cell, the F1/F0 ratio was calculated. Since the spatial frequencies that elicited the strongest F0 and F1 responses were not always the same, we implemented a previously described method (Chen et al. 2009; De Valois et al. 1982) to calculate it. First, we selected the three spatial frequencies that generated the largest combined F1 and F0 responses. Then, we obtained the F1/F0 ratio by averaging the F1 and F0 responses for these three spatial frequencies. Therefore, the F1/F0 ratio is represented by F1 average/F0 average ratio.
LGN DS simulation.
To further understand the effect of alertness on LGN DS cells, a simple model of vector summation was constructed that uses LGN DS responses to predict stimulus direction in the alert and nonalert states. Then, we asked what changes in LGN DS response contribute to minimizing the prediction error. To build the model, the tuning curve of each LGN DS cell was normalized in both alert and nonalert states by the maximum mean firing rate in the alert state. Then, the normalized tuning curves were aligned by their preferred directions to obtain population averages for the four cardinal directions of movement: anterior, superior, posterior, and inferior. These population averages were used as the tuning of the four simulated LGN DS cells that we used in the model.
The mean firing rates of the four simulated DS cells to a given stimulus direction were extracted from their tuning curves. Then, the four mean firing rates were used to generate four spike trains by Poisson process and the four spike trains were integrated within a certain time window and fed to a vector sum detector. The resulting angle from the vector sum, the predicted stimulus direction, was compared with the stimulus direction to calculate the prediction error. The differences between the stimulus direction and predicted stimulus direction were plotted for the alert, nonalert, and nonalert scaled (the nonalert state tuning curve was scaled to the maximum firing rate of the alert state) states. The integration time ranged from 0 to 0.5 s with 10-ms increments. A thousand simulation iterations were performed for each cell in each condition.
RESULTS
Nineteen DS cells were studied in five awake Dutch-Belted rabbits. One additional DS cell was found but was held for only a short period of time, and the data from this cell are not included here. In these same microelectrode penetrations, we studied 264 other neurons that did not meet the criterion (see materials and methods) for being DS. In addition, we tested other non-DS neurons in these penetrations that were quickly abandoned after brief testing (see Search strategy for LGN DS cells) and adequate records for such non-DS cells were not always kept. Therefore, we cannot here provide a precise value for the proportion of all encountered LGN neurons that were DS, except to say that it was <20/284.
Drifting gratings were presented over their receptive field center, and were optimally matched in size, temporal frequency, spatial frequency, and luminance contrast and then the orientation/direction was randomly changed to test 8, 12, or 24 directions. The orientation/directional tuning of one example DS cell is shown in Fig. 1. Black dots represent the F0 responses in the grating directions tested. Solid curve and dashed circle show the fitted tuning curve and spontaneous firing rate, respectively. PSTHs in two cycles of stimulation each are shown for 12 of the tested directions. For this particular example, when the drifting grating was moving from posterior to anterior direction, the cell fired vigorously and maximally, especially compared with the response when the stimulus moved in the opposite direction, the anterior to posterior direction, where the cell showed minimal firing. Note that the response in the anterior direction is lower than the spontaneous firing rate (marked as a small dotted circle at the center of the plot).
Fig. 1.
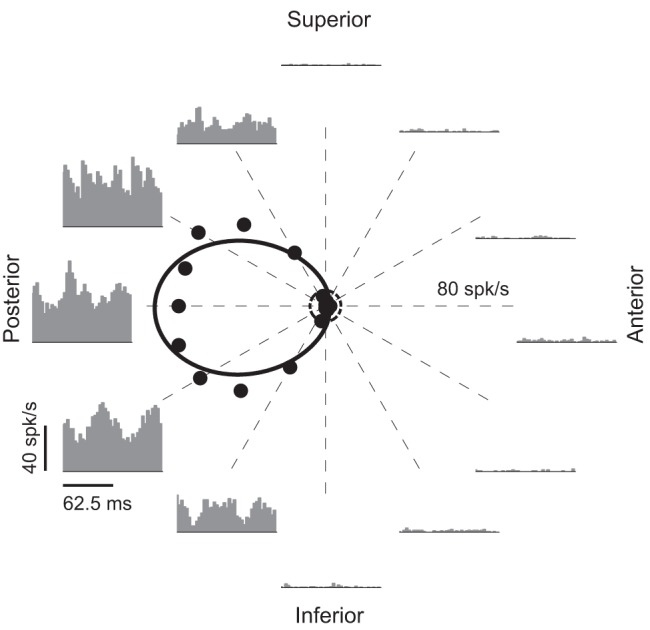
Orientation/directional tuning of 1 lateral geniculate nucleus (LGN) direction selective cell. Each black dot shows the mean firing rate (F0) response for each particular stimulus direction. Solid curve is the fitted curve by von Mises function and dashed circle represents the spontaneous firing rate. Note that the axis limit is 80 spikes/s. Peristimulus time histograms (PSTHs; 2 cycles) are shown for 12 tested directions.
Receptive field properties of DS cells in LGN and comparison with simple cells.
LGN DS cells, have been shown previously to project fast conducting axons to the primary visual cortex (V1) (Swadlow and Weyand 1985), and our recent preliminary data indicate that at least some LGN DS neurons provide a strong input to layer 4 (Hei et al. 2013; however, see Cruz-Martin et al. 2014 for contrary findings in mouse). Since layer 4 in V1 receives a bulk of thalamic input from LGN (Stoelzel et al. 2008) and simple cells, in layer 4 exhibit strong orientation/direction selectivity (Zhuang et al. 2013), we compared the receptive field properties of LGN DS cells and layer 4 simple cells (Fig. 2, B, D, E, and F).
Fig. 2.

Receptive field properties of LGN directionally selective (DS) and concentric cells. A: receptive field map of the DS cell presented in Fig. 1. B: distribution of local similarity index (LSI) for DS cells (LGN_DS, black), concentric cells (LGN_Con, gray) in LGN, and simple cells (CTX_Simple, white) in layer 4 of V1. C: relationship between responses in the preferred direction and null direction of LGN DS cells. Inset: population average. D: distribution of direction-selective index (DSI) of LGN DS cells (LGN_DS, black) and layer 4 simple cells (CTX_Simple, white). Inset: distribution of direction selectivity based on circular variance (CVd). E: distribution of orientation-selective index (LGN DS in black and layer 4 simple cells in white). Inset: distribution of orientation selectivity based on circular variance (CVo). F: distribution of preferred directions of LGN DS cells (black arrow) and layer 4 simple cells (red arrow); 15° around cardinal axes are represented by gray dashed curves. Number of cells fall into those directions is indicated by numbers (LGN DS, black; simple, red). G: normalized population curves for anterior (n = 7, green), superior (n = 2, black), posterior (n = 5, cyan), and inferior (n = 5, magenta) directions. Normalized and averaged data points are represented in dots with standard error represented by error bars. The smoothed curves are fitted curve by von Mises function. H: superimposed directional tuning curves for the 4 directions. Simple cell data reanalyzed from Zhuang et al. (2013). ***P < 0.001.
Unlike LGN cells with concentric receptive fields, which have either pure ON or pure OFF receptive field centers (Swadlow and Weyand 1985), LGN DS cells all had overlapped ON/OFF receptive field subregions (Fig. 2A). To measure the degree of overlapping between ON and OFF receptive field subregions, a LSI was calculated for LGN DS, LGN concentric cells, and layer 4 simple cells. The distribution of LSIs for each class is shown in Fig. 2B. LSI ranges from 0 to 1, with 0 meaning no overlap between ON and OFF subfields and 1 meaning complete overlap (see materials and methods). The distributions of LSI for DS cells and concentric cells are significantly bimodal (Hartigan's test, P < 0.001) with the LSI for all DS cells being >0.35 (mean = 0.75 ± 0.04, Fig. 2B, black) and LSI for concentric cells <0.02 (mean = 0.0009 ± 0.0009, most of them have an LSI of 0, Fig. 2B, grey). Simple cells have pure ON or pure OFF or segregated ON/OFF receptive fields (Zhuang et al. 2013), so it is not surprising to see a significant difference of LSI between LGN DS and layer 4 simple cells (mean: DS vs. simple: 0.75 ± 0.04 vs. 0.03 ± 0.007, P < 0.001, Fig. 2B). The distribution of LSIs for LGN DS and layer 4 simple cells is also significantly bimodal (Hartigan's test, P < 0.01).
DS cells show strong direction selectivity by responding maximally in the preferred direction, and weakly in the null direction (180° opposite of the preferred direction; mean: preferred vs. null: 39.58 ± 4.3 vs. 4.07 ± 1.1 spikes/s, paired t-test, P < 0.001, Fig. 2C, population averages are shown in inset).
To quantify the direction selectivity of the cells, both DSI and CVd were computed. DSIs were calculated based on the preferred and null direction responses (see materials and methods) and were close to 1 in cells with strong direction selectivity and close to 0 in cells with poor direction selectivity. As noted in materials and methods, only LGN cells with DSIs of >0.4 were classified as DS cells, and the distributions of DSIs for all LGN DS (black) and simple (white) cells are shown in Fig. 2D. Note that most of the simple cells are very direction selective (47 out of 56 cells have DSI >0.4). We also calculated the CVd, which is based on the entire orientation/directional tuning curve (see materials and methods) and ranges from 0 to 1, with larger values representing shaper directional tuning. The distribution of CVd of LGN DS cells ranged from 0.2 to 0.8 (mean: 0.56 ± 0.04, Fig. 2D, inset, black) suggesting that some DS cells are relatively more sharply tuned than others. The CVds for simple cells (Fig. 2D, white) are similar to that of LGN DS cells (mean: simple: 0.49 ± 0.03, P = 0.144). OSI and CVo were also computed to quantify the orientation selectivity of the cells. The value of OSI and CVo, as for DSI and CVd, ranged from 0 to 1, with values close to 0 representing poor orientation selectivity and those close to 1 representing strong orientation selectivity. Cortical simple cells had better orientation selectivity than LGN DS cells, as measured by CVo (Fig. 2E, OSI: mean: LGN DS vs. simple: 0.67 ± 0.05 vs. 0.8 ± 0.05, P = 0.072; CVo: mean: LGN DS vs. simple: 0.24 ± 0.03 vs. 0.47 ± 0.03, P < 0.05).
The preferred direction of each cell was calculated by vector sum and the distribution is shown in Fig. 2F. It is very obvious that the distribution of LGN DS cell preferred directions (black) forms four groups (anterior, posterior, superior, and inferior), resembling the distribution of ON_OFF DS ganglion cells in the rabbit retina (Oyster and Barlow 1967). In contrast, the preferred directions of cortical simple cells (red) are more homogeneously distributed. LGN DS cells are much more likely to prefer movement in the directions within 15° of cardinal axes than are simple cells (mean: DS vs. simple: 17 out of 19 vs. 27 out of 54, χ2 test, P = 0.002, Fig. 2F). This suggests that, compared with simple cells, LGN DS cells better code movements in the four directions, anterior, posterior, inferior, and superior.
Normalized and averaged population tuning curves are shown for each of the four cardinal groups (green: anterior population, n = 7; black: superior population, n = 2; cyan: posterior population, n = 5; magenta: inferior population, n = 5; error bar: SE, Fig. 2G). The LGN DS cells are relatively broadly tuned with four prominent peaks in the four cardinal directions (tuning curves from Fig. 2G are superimposed in Fig. 2H).
Linearity of spatial summation.
Spatial frequency tunings of 10 LGN DS cells and 20 concentric cells were tested, and each frequency was examined for both the F0 and F1 responses. A orientation/directional tuning curve for one example DS cell is shown in Fig. 3A, and the corresponding spatial frequency tuning curve in Fig. 3B, respectively. Dots are the responses measured under different spatial frequencies, and solid and dashed curves are the fitted curves of F0 and F1 responses by the Gaussian model (see materials and methods). Nine of 10 LGN DS cells had higher F0 responses than F1 responses at ALL of the spatial frequencies tested (e.g., Fig. 3B); however, one LGN DS cells had higher F0 responses at high spatial frequencies and higher F1 responses at low spatial frequencies (data not shown). In the population of LGN DS cells studied, all but one cell (9 out of 10) had higher peak F0 response than peak F1 response (the exception is indicated by the grey arrow, Fig. 3C). Population averages are shown in Fig. 3C, inset. The preferred spatial frequency of LGN DS cells ranges from 0.34 to 0.98 cpd with a mean of 0.65 cpd (data not shown).
Fig. 3.

Spatial tuning properties and linearity of LGN DS cells and layer 4 simple cells. A: orientation/directional tuning of 1 DS cell. B: spatial frequency tuning curves for cell in A. F0 responses are represented by closed dots and solid fitted curves; first harmonic component (F1) responses are indicated by open dots and dashed fitted curves. C: relationship between peak F0 response (x-axis) of spatial frequency tuning and peak F1 response (y-axis) of LGN DS cells. Inset: peak F0 responses are significantly higher than peak F1 responses. D: distribution of F1/F0 ratios for LNG DS, LGN concentric cells, and simple cells. Gray arrows in C and D indicate an exception cell which has higher F1 responses than F0 responses. Simple cell data reanalyzed from Zhuang et al. (2013). ***P < 0.001.
F1/F0 ratio is a common way to classify simple and complex cells in the cortex with simple cells having a F1/F0 ratio >1 and complex cells a F1/F0 ratio <1 (Movshon et al. 1978). To better compare the linearity of LGN DS, LGN concentric and V1 simple cells, we also calculated the F1/F0 ratios to drifting grating stimulation. We chose the three spatial frequencies that elicited the maximum combined F0 and F1 responses. Then, we calculated the F1/F0 ratio by averaging the F1 and F0 responses for these three spatial frequencies. The F1/F0 ratios for all but one DS cells were <0.4 (mean for all the DS cells with a F1/F0 ratio <1: 0.24 ± 0.029). By contrast, 18 out of 20 LGN concentric cells and 40 out of 44 layer 4 simple cells had a F1/F0 ratio >1 (mean for all LGN concentric cells: 1.41 ± 0.27; mean for all V1 simple cells: 1.46 ± 0.048, LGN DS vs. simple: P < 0.01, LGN DS vs. LGN concentric: P < 0.05, Fig. 3D). The LGN DS cell that has a F1/F0 ratio >1 is indicated by the gray arrow (Fig. 3D). Therefore, LGN DS are much more nonlinear compared with LGN concentric cells and layer 4 simple cells.
Response modulations by brain state.
Awake rabbits shift between alert and nonalert states both spontaneously and in response to diverse sensory stimulation. Notably, this shift in brain state is associated with profound changes in LGN and V1 responses. We have previously shown that LGN concentric cells have higher spontaneous firing rate, lower burst rate, and higher response gain in the alert state than in the nonalert state (Bereshpolova et al. 2011; Bezdudnaya et al. 2006; Cano et al. 2006). Like LGN concentric cells, here we show that DS cells also have significantly higher spontaneous firing rates and lower burst rate in the alert state (mean spontaneous firing rate: alert vs. nonalert: 15.36 ± 1 vs. 9.95 ± 0.95 spikes/s, paired t-test, P < 0.001, Fig. 4A; mean burst rate: alert vs. nonalert: 0.17 ± 0.04 vs. 2.42 ± 0.31 bursts/s, paired t-test, P < 0.001, Fig. 4B). However, unlike concentric LGN cells, alertness increased the visual responses of LGN DS cells selectively around their preferred direction of movement and had an opposite suppressive effect around the null direction (Fig. 5). As concentric LGN cells, LGN DS cells generated stronger responses during the alert (Fig. 5A) than nonalert (Fig. 5B) states and their spontaneous rates were also higher during the alert state (Fig. 5C, dotted lines). However, the response to the nonpreferred direction was weaker in the alert state (Fig. 5C). As a population (Fig. 6), alertness enhanced the visual responses of DS cells in the preferred direction and suppressed them in the null direction (mean response in the preferred direction: alert vs. nonalert: 51.73 ± 5.24 vs. 37.04 ± 6.21 spikes/s, paired t-test, P < 0.01, Fig. 6A; mean response in the null direction: alert vs. nonalert: 1.7 ± 0.62 vs. 4.24 ± 0.6 spikes/s, paired t-test, P < 0.01, Fig. 6B). As a consequence, the direction selectivity measured as both DSI and CVd also increased significantly in the alert state (mean for DSI: alert vs. nonalert: 0.93 ± 0.02 vs. 0.71 ± 0.07, paired t-test, P < 0.01, Fig. 6C; mean for CVd: alert vs. nonalert: 0.64 ± 0.05 vs. 0.52 ± 0.06, paired t-test, P < 0.05, Fig. 6D). Importantly, while the strength of the LGN DS visual responses could be strongly enhanced or suppressed by alertness, the orientation selectivity measured (OSI and CVo) and the tuning HWHH did not change with state (mean for OSI: alert vs. nonalert: 0.66 ± 0.08 vs. 0.64 ± 0.09, paired t-test, P = 0.71, Fig. 6E; mean for CVo: alert vs. nonalert: 0.24 ± 0.04 vs. 0.24 ± 0.05, paired t-test, P = 0.881, Fig. 6F; mean for HWHH: alert vs. nonalert: 56.45 ± 3.97 vs. 52.52 ± 4.49, paired t-test, P = 0.3, Fig. 6G).
Fig. 4.
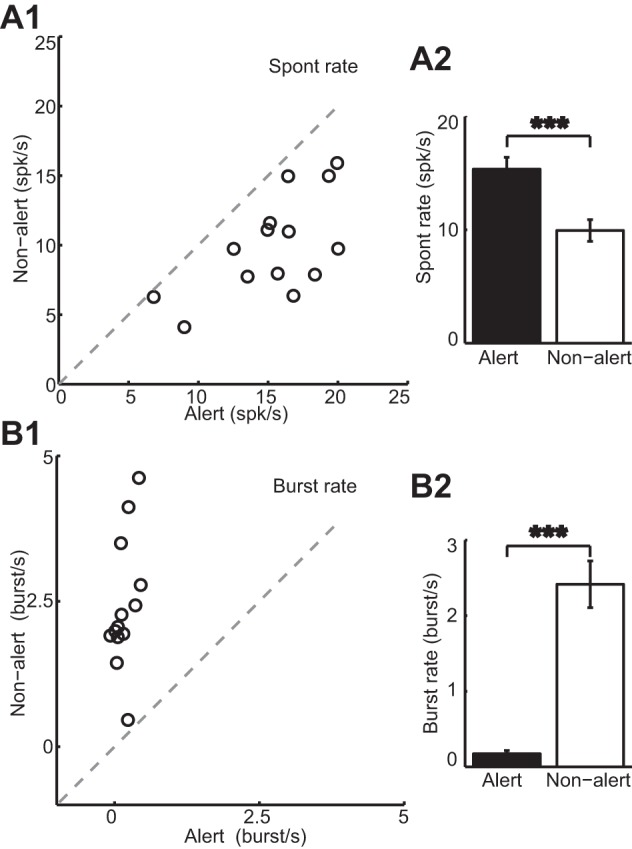
Brain state, spontaneous activity, and bursting of LGN DS cells. Spontaneous firing rate (A) is significantly higher, while burst rate (B) is significantly lower in the alert than in the nonalert state. A2 and B2: population averages (alert in black and nonalert in white). ***P < 0.001.
Fig. 6.

Population data of directional tuning properties of LGN DS cells during alert and nonalert state. Preferred direction responses (A1) are significantly higher, and null direction responses (B1) are significantly lower in the alert state. DSIs (C1) and CVds (D1) are higher in the alert state than in the nonalert state. Orientation-selective indices (OSIs; E1), CVos (F1), and half-tuning width at half height (HWHH; G1) do not change with states. H1: response suppression (reduction) in the null direction from the spontaneous firing rate is greater in the alert state than in the nonalert state. The cell with a negative %suppression had an increase in the null direction response beyond spontaneous rate in the nonalert state. Population averages are shown in the bar graphs in A2–H2 (alert in black and nonalert in white). *P < 0.05 and **P < 0.01.
In both states, visual responses in the null direction were strongly suppressed two to eight times below the spontaneous firing rate (Fig. 6H, mean in the alert state: null vs. spontaneous: 1.85 ± 0.67 vs. 15.18 ± 1.15 spikes/s, P < 0.001; mean in the nonalert state: null vs. spontaneous: 4.51 ± 0.6 vs. 9.32 ± 0.85 spikes/s, P < 0.01). Moreover, this response suppression in the null direction was approximately two times higher in the alert than nonalert states (mean: alert vs. nonalert: 87.98 ± 3.99 vs. 45.45 ± 10.12%, P < 0.001).
LGN DS simulation.
The LGN DS cells code movements in the four cardinal directions with relatively broad and partially overlapped directional tuning curves (Fig. 2H). The main two effects of the alert state on LGN DS cells were the enhancement of visual responses in their preferred direction and the suppression of their responses in the null direction. To investigate the relative contribution of these two effects in the speed at which stimulus direction could be detected, we developed a simple model, which is illustrated in Fig. 7A. The firing rates of four simulated DS cells to a particular stimulus direction (green arrow at left) were extracted from average tuning curves using a Poisson process. Then, the spike rates were integrated over different time windows and fed to a vector sum detector that returned the predicted stimulus direction.
Fig. 7.

Simulation showing faster computation of stimulus direction in the alert state than in the nonalert state. A: diagram of LGN DS model using 4 DS cells with preferred movements in the cardinal axes. Firing rates of the DS cells when presented with a particular stimulus direction were used to generate spike trains by Poisson process. The resulting firing rates provided inputs to a vector sum detector, using firing rates calculated in different integration times, to get the predicted direction. B: population tuning curves in the alert (solid lines) and nonalert (dashed lines) state for 4 cells, each preferring 1 of the 4 cardinal directions. The tuning curve of the inferior direction (black) in the nonalert state was scaled to have the same maximum firing rate of that in the alert state, as shown in the dotted line. C1–C3: relationships between integration time and mean predicted errors for 3 stimulus directions (SD; 90, 112.5, and 135°) in the alert (red), nonalert state (blue), and nonalert scaled state (black). Black arrows on the left show the 20° threshold we used. Arrows in C3 indicate the prolonged integration time due to suppression and gain, respectively. Insets: population averages of integration time in alert, nonalert, and nonalert scaled states. ***P < 0.001.
Figure 7B shows the population tuning curves in the alert (solid lines) and nonalert (dashed lines) states used to predicted three different directions 90° (Fig. 7C1), 112.5° (Fig. 7C2), and 135° (Fig. 7C3), indicated by the gray arrows above the curves. The relationships between the integration time and the mean predicted error (differences between stimulus direction and predicted direction) were obtained from the average tuning curves for the alert state (Fig. 7C, red), nonalert state (Fig. 7C, blue), and a nonalert state scaled to match the maximum response of the alert state (Fig. 7C, black). The contribution of response enhancement (Gain in Fig. 7C3) was estimated by comparing the nonalert and nonalert-scaled conditions (notice that the only difference between them is the increased response gain in the nonalert-scaled state). The contribution of response suppression was estimated by comparing the alert and nonalert-scaled conditions (suppression in Fig. 7C3). Interestingly, although the response enhancement seems more pronounced than the response suppression in our results (e.g., Fig. 5C), the contributions of both response enhancement and suppression were relatively similar. It should be noted that, for all three stimulus directions tested, the integration time to get a 20° mean predicted error was shorter in the alert state than in the nonalert state (mean time for stimulus direction = 90° in the alert vs. nonalert scaled state: 0.099 ± 0.0017 vs. 0.1435 ± 0.0024 s, paired t-test, P < 0.001; nonalert vs. nonalert scaled state: 0.1955 ± 0.0027 vs. 0.1435 ± 0.0024 s, paired t-test, P < 0.001, Fig. 7C1; mean time for stimulus direction = 112.5° in the alert vs. nonalert scaled state: 0.1235 ± 0.0017 vs. 0.1765 ± 0.0022 s, paired t-test, P < 0.001; nonalert vs. nonalert scaled state: 0.2365 ± 0.003 vs. 0.1765 ± 0.0022 s, paired t-test, P < 0.001, Fig. 7C2; mean time for stimulus direction = 135° in the alert vs. nonalert scaled state: 0.1845 ± 0.002 vs. 0.2615 ± 0.0034 s, paired t-test, P < 0.001; nonalert vs. nonalert scaled state: 0.3575 ± 0.0046 vs. 0.2615 ± 0.0034 s, paired t-test, P < 0.001, Fig. 7C3). Also, the detection time was longer when the stimulus direction was least aligned with the cardinal axes for both alert and nonalert state (paired t-test, P < 0.001). Therefore, the results suggest that both the response increase in the preferred direction and response suppression in the null direction are important to enhance the signal to noise ratio and increase the speed of detection of a stimulus direction during the alert state. The simulation also predicts that stimuli moving closer to the direction of the cardinal axes will be detected faster by populations of LGN DS cells.
DISCUSSION
DS cells were first reported in rabbit retina >50 yr ago (Barlow and Hill 1963) and have been also characterized in squirrels (Michael 1966) and mice (Weng et al. 2005; Yoshida et al. 2001). Despite the relative large proportion of retinal DS ganglion cells (18.6–41% in rabbits and mice; Barlow and Hill 1963; Barlow et al. 1964; Sun et al. 2002, 2006; Weng et al. 2005), LGN DS cells are more rare (Levick et al. 1969; Marshel et al. 2012; Montero and Brugge 1969; Piscopo et al. 2013; Swadlow and Weyand 1985), with all but one of these studies reporting <7% of LGN cells to be DS. Furthermore, DS neurons are not uniformly distributed within the LGN. Indeed, in rabbit LGN (Stoelzel et al. 2008; Swadlow and Weyand 1985), DS neurons are much more prevalent in the representation of the upper visual field than in the representation of the visual streak (see materials and methods). Similarly, evidence for nonuniform distribution of DS neurons has been reported in mouse LGN (Marshel et al. 2012; Piscopo et al. 2013), which also has a visual streak-like increase in retinal ganglion cell density along the representation of the horizon (Drager and Olsen 1981). Here, we only studied DS neurons in the LGN representation of the visual streak to compare these cells with V1 simple cells studied, using the same methods, in this region of visual space (Zhuang et al. 2013, 2014).
Axonal projections of LGN DS cells.
The presence of DS cells in the LGN raises questions concerning their cortical targets and the potential role in shaping the well-tuned direction/orientation selectivity seen in rabbit/rodent V1 (Piscopo et al. 2013; Scholl et al. 2013). Previous work (Swadlow and Weyand 1985) showed that LGN DS neurons do project to V1 and that their axons have conduction velocities similar to those of concentric LGN neurons, but the terminal layer of these axons could not be determined with the antidromic methods that were employed. Although our preliminary studies (Hei et al. 2013) indicate that at least some LGN DS neurons provide a strong synaptic impact in layer 4, recent work in mouse (Cruz-Martin et al. 2014) indicates that LGN DS neurons located in the shell region of the LGN selectively target the superficial layers of V1. Future work will resolve this issue.
Which cells in V1 receive input from LGN DS neurons?
Orientation preference in cats and primates is columnar and is believed to originate, in part, from selective LGN inputs with ON or OFF receptive field centers precisely aligned with the cortical receptive field subfields (Alonso et al. 2001; Hubel and Wiesel 1962; Reid and Alonso 1995; Tanaka 1983; but see Mata and Ringach 2005). By contrast, orientation selectivity in rodents and rabbits is not columnar (Bonin et al. 2011; Bousfield 1977; Drager 1975; Girman et al. 1999; Metin et al. 1988; Ohki et al. 2005; Van Hooser et al. 2005) and the mechanism(s) generating sharp orientation/direction tuning may differ (e.g., Scholl et al. 2013). It is tempting to think that the DS input could contribute significantly to the orientation/directional properties of simple cells. Our results and recent findings in the mouse (Piscopo et al. 2013) suggest otherwise (also see Lien and Scanziani 2013). Thus we found that 1) whereas LGN DS neurons have spatially overlapping ON and OFF subfields, those of simple cells are spatially segregated; 2) whereas the F1/F0 ratios of simple cells indicate a linear spatial summation, those of LGN DS cells are highly nonlinear; and 3) whereas LGN DS cells have preferred directions lying on the four cardinal directions, the simple cells have more broadly distributed preferred directions. Together, these differences suggest that LGN DS neurons do not “drive” (Sherman and Guillery 1998) V1 simple cells and convey their receptive field properties upon them.
By contrast, fast-spike inhibitory interneurons [suspected inhibitory interneurons, (SINs); Swadlow 1988; Swadlow and Weyand 1987; Zhuang et al. 2013] are likely targets of LGN DS neurons. These cells, like the LGN DS cells, have spatial receptive fields with overlapping ON/OFF zones and very low (nonlinear) F1/F0 ratios. Notably, V1 SINs lack the directional selectivity seen in LGN DS cells. However, SINs are known to receive a convergent, promiscuous input from topographically aligned thalamic neurons that display a variety of properties. Thus, individual V1 SINs, which have overlapping ON/OFF subfields, may receive input from both ON center and OFF center LGN neurons (Zhuang et al. 2013). Moreover, SINs in layer 4 barrel cortex show little directional preference for whisker movements but receive highly convergent input from ventrobasal thalamic neurons with a diversity of directional preferences (Swadlow and Gusev 2002). Similar results are seen in rat barrel system (Bruno and Simons 2002). Targeting of layer 4 SINs by LGN DS neurons would suggest a role for LGN DS neurons in driving fast and strong feed-forward inhibition that could sharpen sensory tuning of recipient simple cells around the four cardinal directions of motion. Of course, it is also possible that LGN DS terminals in layer 4 target the descending dendrites of layer 2/3 complex cells or ascending apical dendrites of layer 5 complex cells. Indeed, many corticotectal neurons of rabbit layer 5 have complex, DS receptive fields similar to those of LGN DS neurons (Swadlow 1988; Swadlow and Weyand 1987). Cross-correlation studies of retinotopically aligned LGN DS neurons and cortical populations (e.g., Alonso et al. 1996, 2001; Swadlow and Gusev 2002) would be well suited to test these hypotheses.
Effects of brain state on LGN DS neurons.
In awake rabbits, frequent shifts between alert and nonalert brain states are associated with significant changes in spontaneous activity, burst firing (Guido and Weyand 1995; Sherman and Guillery 1996; Weyand et al. 2001), and visually driven responses of LGN concentric neurons (Bezdudnaya et al. 2006; Cano et al. 2006), and some such changes are conveyed to V1 layer 4 simple cells (Bereshpolova et al. 2011; Zhuang et al. 2014). Our results in LGN DS neurons are consistent with the results for LGN concentric cells, in showing higher spontaneous firing rates, lower burst rates, and stronger responses to visual stimulation in the preferred direction when alert. Our results also show that alertness increases response suppression to stimuli moving in the null direction (Levick et al. 1969). Thus the response enhancement (gain) in the preferred direction and the response suppression in the null direction both contribute to an increase of the signal-to-noise ratio when alert, even though there is no change in sharpness of tuning and direction preference (the HWHH, Fig. 6G). The mechanism of the enhanced null-direction suppression when alert could involve feed-forward and/or feed-back inhibition mediated by brainstem or cortical (Briggs and Usrey 2008) inputs. However, since there is little evidence for feed-forward inhibition within rabbit LGN (Lo 1981), the mechanism probably involves enhanced feed-back inhibition, via the thalamic reticular nucleus, and there is evidence for such arousal induced enhancement of feed-back inhibition in LGN projection cells (Swadlow and Weyand 1985). Alternatively, LGN DS neurons could be selectively suppressed by neuromodulatory inputs associated with arousal (e.g., McCormick 1992).
Functional role of LGN DS cells.
Our results show that LGN DS cells provide a dedicated thalamocortical channel to transfer motion signals about the four cardinal directions to the primary visual cortex. The relatively broad and overlapping directional tuning characteristics of LGN DS channels suggest that they could form the core elements of a vector-based population code for extracting directional information. We do not know the function of this thalamocortical directional information, but our simulations show how alertness could allow more rapid extraction of this information. In this regard, it is worth noting that rabbits are frequent targets of birds of prey, that they naturally evade these predators (Pongrácz and Altbäcker 2000), and that DS neurons are most prevalent in the LGN representation of the upper visual field (Swadlow and Weyand 1985). These results and observations suggest that LGN DS cells could be useful in determining the angle of approach of areal predators, and our model and simulations indicate that alertness would hasten this computation. This would allow more rapid decisions about behavioral output (e.g., both go/no-go decisions and the direction of escape responses).
GRANTS
This work was supported by National Eye Institute Grant EY-018251.
DISCLOSURES
No conflicts of interest, financial or otherwise, are declared by the author(s).
AUTHOR CONTRIBUTIONS
Author contributions: X.H., J.-M.A., and H.A.S. conception and design of research; X.H., C.R.S., J.Z., Y.B., and J.M.H. performed experiments; X.H. analyzed data; X.H., J.-M.A., and H.A.S. interpreted results of experiments; X.H. prepared figures; X.H. drafted manuscript; X.H., C.R.S., J.Z., Y.B., J.M.H., J.-M.A., and H.A.S. edited and revised manuscript; X.H., C.R.S., J.Z., Y.B., J.M.H., J.-M.A., and H.A.S. approved final version of manuscript.
ACKNOWLEDGMENTS
We thank Victor Serdyukov for software development and hardware support.
REFERENCES
- Alonso JM, Usrey WM, Reid RC. Precisely correlated firing in cells of the lateral geniculate nucleus. Nature 383: 815–819, 1996 [DOI] [PubMed] [Google Scholar]
- Alonso JM, Usrey WM, Reid RC. Rules of connectivity between geniculate cells and simple cells in cat primary visual cortex. J Neurosci 21: 4002–4015, 2001 [DOI] [PMC free article] [PubMed] [Google Scholar]
- Barlow HB, Hill RM. Selective sensitivity to direction of movement in ganglion cells of the rabbit retina. Science 139: 412–414, 1963 [DOI] [PubMed] [Google Scholar]
- Barlow HB, Hill RM, Levick WR. Retinal ganglion cells responding selectively to direction and speed of image motion in the rabbit. J Physiol 173: 377–407, 1964 [DOI] [PMC free article] [PubMed] [Google Scholar]
- Bereshpolova Y, Amitai Y, Gusev AG, Stoelzel CR, Swadlow HA. Dendritic backpropagation and the state of the awake neocortex. J Neurosci 27: 9392–9399, 2007 [DOI] [PMC free article] [PubMed] [Google Scholar]
- Bereshpolova Y, Stoelzel CR, Zhuang J, Amitai Y, Alonso JM, Swadlow HA. Getting drowsy? Alert/nonalert transitions and visual thalamocortical network dynamics. J Neurosci 31: 17480–17487, 2011 [DOI] [PMC free article] [PubMed] [Google Scholar]
- Bezdudnaya T, Cano M, Bereshpolova Y, Stoelzel CR, Alonso JM, Swadlow HA. Thalamic burst mode and inattention in the awake LGNd. Neuron 49: 421–432, 2006 [DOI] [PubMed] [Google Scholar]
- Bonin V, Histed MH, Yurgenson S, Reid RC. Local diversity and fine-scale organization of receptive fields in mouse visual cortex. J Neurosci 31: 18506–18521, 2011 [DOI] [PMC free article] [PubMed] [Google Scholar]
- Bousfield JD. Columnar organisation and the visual cortex of the rabbit. Brain Res 136: 154–158, 1977 [DOI] [PubMed] [Google Scholar]
- Briggs F, Usrey WM. Emerging views of corticothalamic function. Curr Opin Neurobiol 18: 403–407, 2008 [DOI] [PMC free article] [PubMed] [Google Scholar]
- Bruno RM, Simons DJ. Feedforward mechanisms of excitatory and inhibitory cortical receptive fields. J Neurosci 22: 10966–10975, 2002 [DOI] [PMC free article] [PubMed] [Google Scholar]
- Cano M, Bezdudnaya T, Swadlow HA, Alonso JM. Brain state and contrast sensitivity in the awake visual thalamus. Nat Neurosci 9: 1240–1242, 2006 [DOI] [PubMed] [Google Scholar]
- Cavanaugh J, Monosov IE, McAlonan K, Berman R, Smith MK, Cao V, Wang KH, Boyden ES, Wurtz RH. Optogenetic inactivation modifies monkey visuomotor behavior. Neuron 76: 901–907, 2012 [DOI] [PMC free article] [PubMed] [Google Scholar]
- Chen Y, Anand S, Martinez-Conde S, Macknik SL, Bereshpolova Y, Swadlow HA, Alonso JM. The linearity and selectivity of neuronal responses in awake visual cortex. J Vis 9: 12–12, 2009 [DOI] [PMC free article] [PubMed] [Google Scholar]
- Collewijn H. The optokinetic system of the rabbit. Doc Ophthalmol 30: 205–226, 1971 [DOI] [PubMed] [Google Scholar]
- Cruz-Martin A, El-Danaf RN, Osakada F, Sriram B, Dhande OS, Nguyen PL, Callaway EM, Ghosh A, Huberman AD. A dedicated circuit links direction-selective retinal ganglion cells to the primary visual cortex. Nature 507: 358–361, 2014 [DOI] [PMC free article] [PubMed] [Google Scholar]
- De Valois RL, Albrecht DG, Thorell LG. Spatial frequency selectivity of cells in macaque visual cortex. Vision Res 22: 545–559, 1982 [DOI] [PubMed] [Google Scholar]
- Demb JB. Cellular mechanisms for direction selectivity in the retina. Neuron 55: 179–186, 2007 [DOI] [PubMed] [Google Scholar]
- Dhande OS, Estevez ME, Quattrochi LE, El-Danaf RN, Nguyen PL, Berson DM, Huberman AD. Genetic dissection of retinal inputs to brainstem nuclei controlling image stabilization. J Neurosci 33: 17797–17813, 2013 [DOI] [PMC free article] [PubMed] [Google Scholar]
- Drager UC. Receptive fields of single cells and topography in mouse visual cortex. J Comp Neurol 160: 269–290, 1975 [DOI] [PubMed] [Google Scholar]
- Drager UC, Olsen JF. Ganglion cell distribution in the retina of the mouse. Invest Ophthalmol Vis Sci 20: 285–293, 1981 [PubMed] [Google Scholar]
- Elstrott J, Anishchenko A, Greschner M, Sher A, Litke AM, Chichilnisky EJ, Feller MB. Direction selectivity in the retina is established independent of visual experience and cholinergic retinal waves. Neuron 58: 499–506, 2008 [DOI] [PMC free article] [PubMed] [Google Scholar]
- Fried SI, Munch TA, Werblin FS. Directional selectivity is formed at multiple levels by laterally offset inhibition in the rabbit retina. Neuron 46: 117–127, 2005 [DOI] [PubMed] [Google Scholar]
- Fried SI, Munch TA, Werblin FS. Mechanisms and circuitry underlying directional selectivity in the retina. Nature 420: 411–414, 2002 [DOI] [PubMed] [Google Scholar]
- Girman SV, Sauve Y, Lund RD. Receptive field properties of single neurons in rat primary visual cortex. J Neurophysiol 82: 301–311, 1999 [DOI] [PubMed] [Google Scholar]
- Grabska-Barwinska A, Ng BS, Jancke D. Orientation selective or not? Measuring significance of tuning to a circular parameter. J Neurosci Methods 203: 1–9, 2012 [DOI] [PubMed] [Google Scholar]
- Guido W, Weyand T. Burst responses in thalamic relay cells of the awake behaving cat. J Neurophysiol 74: 1782–1786, 1995 [DOI] [PubMed] [Google Scholar]
- Hei X, Stoelzel CR, Zhuang J, Bereshpolova Y, Huff JM, Alonso JM, Swadlow HA. Directional selective neurons in rabbit LGNd project to layer 4 of V1 and are modulated by brain state. Soc Neurosci Abst Program No 737.13/JJ5: 2013 [Google Scholar]
- Holcombe V, Guillery RW. The organization of retinal maps within the dorsal and ventral lateral geniculate nuclei of the rabbit. J Comp Neurol 225: 469–491, 1984 [DOI] [PubMed] [Google Scholar]
- Hubel DH, Wiesel TN. Receptive fields, binocular interaction and functional architecture in the cat's visual cortex. J Physiol 160: 106–154, 1962 [DOI] [PMC free article] [PubMed] [Google Scholar]
- Huberman AD, Wei W, Elstrott J, Stafford BK, Feller MB, Barres BA. Genetic identification of an on-off direction- selective retinal ganglion cell subtype reveals a layer-specific subcortical map of posterior motion. Neuron 62: 327–334, 2009 [DOI] [PMC free article] [PubMed] [Google Scholar]
- Hughes A. Topographical relationships between the anatomy and physiology of the rabbit visual system. Doc Ophthalmol 30: 33–159, 1971 [DOI] [PubMed] [Google Scholar]
- Jones JP, Palmer LA. The two-dimensional spatial structure of simple receptive fields in cat striate cortex. J Neurophysiol 58: 1187–1211, 1987 [DOI] [PubMed] [Google Scholar]
- Levick WR, Oyster CW, Takahashi E. Rabbit lateral geniculate nucleus: sharpener of directional information. Science 165: 712–714, 1969 [DOI] [PubMed] [Google Scholar]
- Lien AD, Scanziani M. Tuned thalamic excitation is amplified by visual cortical circuits. Nat Neurosci 16: 1315–1323, 2013 [DOI] [PMC free article] [PubMed] [Google Scholar]
- Lo FS. Synaptic organization of the lateral geniculate nucleus of the rabbit: lack of feed-forward inhibition. Brain Res 221: 387–392, 1981 [DOI] [PubMed] [Google Scholar]
- Lu SM, Guido W, Sherman SM. Effects of membrane voltage on receptive field properties of lateral geniculate neurons in the cat: contributions of the low-threshold Ca2+ conductance. J Neurophysiol 68: 2185–2198, 1992 [DOI] [PubMed] [Google Scholar]
- Marshel James H, Kaye Alfred P, Nauhaus I, Callaway EM. Anterior-posterior direction opponency in the superficial mouse lateral geniculate nucleus. Neuron 76: 713–720, 2012 [DOI] [PMC free article] [PubMed] [Google Scholar]
- Mata ML, Ringach DL. Spatial overlap of ON and OFF subregions and its relation to response modulation ratio in macaque primary visual cortex. J Neurophysiol 93: 919–928, 2005 [DOI] [PubMed] [Google Scholar]
- McCormick DA. Neurotransmitter actions in the thalamus and cerebral cortex and their role in neuromodulation of thalamocortical activity. Prog Neurobiol 39: 337–388, 1992 [DOI] [PubMed] [Google Scholar]
- Metin C, Godement P, Imbert M. The primary visual cortex in the mouse: receptive field properties and functional organization. Exp Brain Res 69: 594–612, 1988 [DOI] [PubMed] [Google Scholar]
- Michael CR. Receptive fields of directionally selective units in the optic nerve of the ground squirrel. Science 152: 1092–1095, 1966 [DOI] [PubMed] [Google Scholar]
- Montero VM, Brugge JF. Direction of movement as the significant stimulus parameter for some lateral geniculate cells in the rat. Vision Res 9: 71–88, 1969 [DOI] [PubMed] [Google Scholar]
- Movshon JA, Thompson ID, Tolhurst DJ. Spatial summation in the receptive fields of simple cells in the cat's striate cortex. J Physiol 283: 53–77, 1978 [DOI] [PMC free article] [PubMed] [Google Scholar]
- Oesch N, Euler T, Taylor WR. Direction-selective dendritic action potentials in rabbit retina. Neuron 47: 739–750, 2005 [DOI] [PubMed] [Google Scholar]
- Ohki K, Chung S, Ch'ng YH, Kara P, Reid RC. Functional imaging with cellular resolution reveals precise micro-architecture in visual cortex. Nature 433: 597–603, 2005 [DOI] [PubMed] [Google Scholar]
- Oyster CW, Barlow HB. Direction-selective units in rabbit retina: distribution of preferred directions. Science 155: 841–842, 1967 [DOI] [PubMed] [Google Scholar]
- Piscopo DM, El-Danaf RN, Huberman AD, Niell CM. Diverse visual features encoded in mouse lateral geniculate nucleus. J Neurosci 33: 4642–4656, 2013 [DOI] [PMC free article] [PubMed] [Google Scholar]
- Pongrácz P, Altbäcker V. Ontogeny of the responses of European rabbits (Oryctolagus cuniculus) to aerial and ground predators. Can J Zool 78: 655–665, 2000 [Google Scholar]
- Reid RC, Alonso JM. Specificity of monosynaptic connections from thalamus to visual cortex. Nature 378: 281–284, 1995 [DOI] [PubMed] [Google Scholar]
- Ringach DL, Shapley RM, Hawken MJ. Orientation selectivity in macaque V1: diversity and laminar dependence. J Neurosci 22: 5639–5651, 2002 [DOI] [PMC free article] [PubMed] [Google Scholar]
- Scholl B, Tan AY, Corey J, Priebe NJ. Emergence of orientation selectivity in the mammalian visual pathway. J Neurosci 33: 10616–10624, 2013 [DOI] [PMC free article] [PubMed] [Google Scholar]
- Sherman SM, Guillery RW. Functional organization of thalamocortical relays. J Neurophysiol 76: 1367–1395, 1996 [DOI] [PubMed] [Google Scholar]
- Sherman SM, Guillery RW. On the actions that one nerve cell can have on another: distinguishing “drivers” from “modulators”. Proc Natl Acad Sci USA 95: 7121–7126, 1998 [DOI] [PMC free article] [PubMed] [Google Scholar]
- Simpson JI. The accessory optic system. Annu Rev Neurosci 7: 13–41, 1984 [DOI] [PubMed] [Google Scholar]
- Stewart DL, Chow KL, Masland RH. Receptive-field characteristics of lateral geniculate neurons in the rabbit. J Neurophysiol 34: 139–147, 1971 [DOI] [PubMed] [Google Scholar]
- Stoelzel CR, Bereshpolova Y, Gusev AG, Swadlow HA. The impact of an LGNd impulse on the awake visual cortex: synaptic dynamics and the sustained/transient distinction. J Neurosci 28: 5018–5028, 2008 [DOI] [PMC free article] [PubMed] [Google Scholar]
- Sun W, Deng Q, Levick WR, He S. ON direction-selective ganglion cells in the mouse retina. J Physiol 576: 197–202, 2006 [DOI] [PMC free article] [PubMed] [Google Scholar]
- Sun W, Li N, He S. Large-scale morphological survey of mouse retinal ganglion cells. J Comp Neurol 451: 115–126, 2002 [DOI] [PubMed] [Google Scholar]
- Swadlow HA. Efferent neurons and suspected interneurons in binocular visual cortex of the awake rabbit: receptive fields and binocular properties. J Neurophysiol 59: 1162–1187, 1988 [DOI] [PubMed] [Google Scholar]
- Swadlow HA, Beloozerova IN, Sirota MG. Sharp, local synchrony among putative feed-forward inhibitory interneurons of rabbit somatosensory cortex. J Neurophysiol 79: 567–582, 1998 [DOI] [PubMed] [Google Scholar]
- Swadlow HA, Bereshpolova Y, Bezdudnaya T, Cano M, Stoelzel CR. A multi-channel, implantable microdrive system for use with sharp, ultra-fine “Reitboeck” microelectrodes. J Neurophysiol 93: 2959–2965, 2005 [DOI] [PubMed] [Google Scholar]
- Swadlow HA, Gusev AG. Receptive-field construction in cortical inhibitory interneurons. Nat Neurosci 5: 403–404, 2002 [DOI] [PubMed] [Google Scholar]
- Swadlow HA, Weyand TG. Corticogeniculate neurons, corticotectal neurons, and suspected interneurons in visual cortex of awake rabbits: receptive-field properties, axonal properties, and effects of EEG arousal. J Neurophysiol 57: 977–1001, 1987 [DOI] [PubMed] [Google Scholar]
- Swadlow HA, Weyand TG. Receptive-field and axonal properties of neurons in the dorsal lateral geniculate nucleus of awake unparalyzed rabbits. J Neurophysiol 54: 168–183, 1985 [DOI] [PubMed] [Google Scholar]
- Tanaka K. Cross-correlation analysis of geniculostriate neuronal relationships in cats. J Neurophysiol 49: 1303–1318, 1983 [DOI] [PubMed] [Google Scholar]
- Van Hooser SD, Heimel JA, Chung S, Nelson SB, Toth LJ. Orientation selectivity without orientation maps in visual cortex of a highly visual mammal. J Neurosci 25: 19–28, 2005 [DOI] [PMC free article] [PubMed] [Google Scholar]
- Weng S, Sun W, He S. Identification of ON-OFF direction-selective ganglion cells in the mouse retina. J Physiol 562: 915–923, 2005 [DOI] [PMC free article] [PubMed] [Google Scholar]
- Weyand TG, Boudreaux M, Guido W. Burst and tonic response modes in thalamic neurons during sleep and wakefulness. J Neurophysiol 85: 1107–1118, 2001 [DOI] [PubMed] [Google Scholar]
- Yonehara K, Ishikane H, Sakuta H, Shintani T, Nakamura-Yonehara K, Kamiji NL, Usui S, Noda M. Identification of retinal ganglion cells and their projections involved in central transmission of information about upward and downward image motion. PLoS One 4: e4320, 2009 [DOI] [PMC free article] [PubMed] [Google Scholar]
- Yoshida K, Watanabe D, Ishikane H, Tachibana M, Pastan I, Nakanishi S. A key role of starburst amacrine cells in originating retinal directional selectivity and optokinetic eye movement. Neuron 30: 771–780, 2001 [DOI] [PubMed] [Google Scholar]
- Zhuang J, Bereshpolova Y, Stoelzel CR, Huff JM, Hei X, Alonso JM, Swadlow HA. Brain state effects on layer 4 of the awake visual cortex. J Neurosci 34: 3888–3900, 2014 [DOI] [PMC free article] [PubMed] [Google Scholar]
- Zhuang J, Stoelzel CR, Bereshpolova Y, Huff JM, Hei X, Alonso JM, Swadlow HA. Layer 4 in primary visual cortex of the awake rabbit: contrasting properties of simple cells and putative feedforward inhibitory interneurons. J Neurosci 33: 11372–11389, 2013 [DOI] [PMC free article] [PubMed] [Google Scholar]