

Abstract
Objective
Although recent theories of brain and cognitive aging distinguish among normal, exceptional, and impaired groups, further empirical evidence is required. We adapted and applied standard procedures for classifying groups of cognitively impaired (CI) and cognitively normal (CN) older adults to a third classification, cognitively healthy, exceptional, or elite (CE) aging. We then examined concurrent and two-wave longitudinal performance on composite variables of episodic, semantic, and working memory.
Method
We began with a two-wave source sample from the Victoria Longitudinal Study (VLS) (source n=570; baseline age=53–90 years). The goals were to: (a) apply standard and objective classification procedures to discriminate three cognitive status groups, (b) conduct baseline comparisons of memory performance, (c) develop two-wave status stability and change subgroups, and (d) compare of stability subgroup differences in memory performance and change.
Results
As expected, the CE group performed best on all three memory composites. Similarly, expected status stability effects were observed: (a) stable CE and CN groups performed memory tasks better than their unstable counterparts and (b) stable (and chronic) CI group performed worse than its unstable (variable) counterpart. These stability group differences were maintained over two waves.
Conclusion
New data validate the expectations that (a) objective clinical classification procedures for cognitive impairment can be adapted for detecting cognitively advantaged older adults and (b) performance in three memory systems is predictably related to the tripartite classification.
Keywords: normal cognitive aging, cognitively elite aging, mild cognitive impairment, memory, Victoria Longitudinal Study
We address the issue of whether (a) cognitively and neurologically exceptional (or “healthy”) older adults can be objectively distinguished in terms of initial (and sustained or changing) cognitive status and (b) the objectively classified groups perform differently in actual memory performance across three domains. Our approach merges recent research attention to (a) neurologically or cognitively advantaged, elite, or “superaging” (e.g., de Frias, Dixon, & Strauss, 2009; Dixon, 2010; Harrison et al., 2011a, 2011b; Nyberg et al., 2012; Park & Reuter-Lorenz, 2009), (b) normal cognitive aging (e.g., Craik & Salthouse, 2008), and (c) mild cognitive impairment (MCI; e.g., Albert et al., 2011; Dolcos et al., 2012). To our knowledge, no previous study has included objective classification of these three clinical groups in the context of both concurrent and longitudinal stability classifications and performance across three memory domains. Specifically, using both a baseline and a two-wave stability enrolled sample we (a) classify cognitively elite, cognitively normal, and cognitively impaired groups and (b) compare their relative performance both concurrently and longitudinally on three systems of memory functioning (i.e., episodic, semantic, working).
Recent research on neuropsychological aspects of memory and aging has focused on several key issues: (a) levels of performance across a variety of memory functions and relative to clinical subgroups, (b) slope, timing, extent, and variability in actual memory changes with normal and clinical subgroups, and (c) health, biological markers, and other conditions that predict or modulate group and individual differences in memory aging (e.g., Anstey, 2012; Hertzog, Dixon, Hultsch, & MacDonald, 2003; MacDonald, DeCarlo, & Dixon, 2011; Mungas et al., 2010; Nyberg et al., 2012; St. Laurent, Abdi, Burianova, & Grady, 2011). Cross-sectional comparisons of age groups (e.g., younger and older adults) or clinical groups (e.g., normal and mild cognitively impaired adults) typically reveal predictable group differences on basic memory tasks (e.g., episodic), with relatively moderate differences on semantic memory (Nyberg et al., 2003; cf. Greenberg & Verfaellie, 2010). Longitudinal approaches offer both unique and complementary evaluations of individual- or group-level stabilities, instabilities, trajectories, and transitions (e.g., Anstey, 2012; Hertzog, 2008; Josefsson, de Luna, Pudas, Nilsson, & Nyberg, 2012; Mungas et al., 2010). For example, a recent longitudinal study presented group-level growth curves showing gradual overall episodic and semantic memory decline (Dixon, Small, MacDonald, & McArdle, 2012). Informal inspection of the “spaghetti plots” (tracking individuals’ actual trajectories over time) suggested that three clusters might be recoverable: (a) typical or normal aging, with intermediate levels of performance, moderate variability, and gradual decline across waves, (b) lower levels of concurrent performance and longer-term or steeper longitudinal decline (consistent with amnestic MCI), and (c) sustained high levels of performance over time or into late life (consistent with continuing cognitive or memory health and success). Although promising, these informal memory aging clusters would be more informative if they were linked to prior objective and systematic classification procedures representing underlying clinical neurocognitive status.
The present goal was to examine whether concurrent and four-year memory performance differences were related to continuous but clinically classifiable and objectively separable clusters of neurocognitive status in older adults. We assembled a two-wave data set from the latest VLS sample and compared memory performance (across episodic, semantic, and working memory domains) for three objectively defined neurocognitive status groups: Cognitively Normal (CN), Cognitively Impaired (CI), and Cognitively Exceptional or Elite (CE). Although the literature establishing differences between normal and cognitively impaired groups is growing (e.g., Albert et al., 2011; Cosentino, Brickman, & Manly, 2011), there is very little research on memory performance and change by cognitively advantaged groups. Increasingly, with demographic changes, further information on the characteristics, precursors, and profiles of cognitively healthy, advantaged, or elite older adults is of theoretical, clinical, and even broader interest (Dixon, 2010; Harrison et al., 2011a; Park & Reuter-Lorenz, 2009).
We adapt a perspective that focuses on linking adaptive brain and cognitive aging approaches to available theory, deployable methods, empirical precedents, and demonstrations of potential sustained high levels of neurocognitive performance among older adults (e.g., Nyberg et al., 2012; Park & Reuter-Lorenz, 2009; Royall, Palmer, Chiodo, & Polk, 2005). For example, epidemiological approaches have established that a variety of clusters of risk and protective influences may be associated with differential clinical outcomes, including dementia but also sustained cognitive health (e.g., Dixon, 2010; Fotuhi et al., 2009). In one study of the neuroanatomy of superagers (defined as individuals over 80 who have maintained high memory performance), Harrison and colleagues (2011a) found that indices of cortical atrophy (thinning) were comparable to those of cognitively matched middle-aged controls. In addition, these researchers observed thickening in the anterior cingulate cortex, suggesting the possibility that sustained memory performance may be supported by spared medial executive and attentional processes. Genetic-related examples have also appeared, with early suggestions that protective allelic combinations may influence brain and cognitive maintenance (Nyberg et al., 2012) even in the presence of biohealth risk factors (e.g., McFall et al., in press). At a cognitive level, supportive functions may derive from strategic (e.g., developing awareness and use of memory compensation techniques; Dixon & de Frias, 2007; Garrett, Grady, & Hasher, 2010), relatively intact basic or support processes (e.g., cognitive or brain reserve; Fratiglioni & Wang, 2007; Reuter-Lorenz & Cappell, 2008; Stern, 2007, 2009), and activity or environmental interventions (Brown, Peiffer, & Martins, 2012; Carlson et al., 2012; de Frias & Dixon, in press; Gross, Rebok, Unverzagt, Willis, & Brandt, 2011; Hertzog, Kramer, Wilson, & Lindenberger, 2008; Small, Dixon, McArdle, & Grimm, 2012). In general, attention has been devoted to the concept and potential mechanisms for exceptional or sustained brain and cognitive aging.
In our own recent work, we have explored one cognitive phenotype (executive function) in the context of cognitive status differences. Three main dimensions of executive functions identified in structural analyses with younger adults (Luszcz, 2011; Miyake et al., 2000) appeared to be undifferentiated (possibly de-differentiated) into one global factor in normal older adults (de Frias, Dixon, & Strauss, 2006). However, subsequently using two-wave longitudinal data and three cognitive status groups (CN, CI, and CE), we observed that an undifferentiated (single-factor) structure fit the data for the CN and CI groups, but that a differentiated (3-factor) structure fit the data for a CE group (de Frias, Dixon, & Strauss, 2009). Not only was the CE group structurally more similar to healthy younger adults, but it performed at a level that was superior to its counterparts. More recently, we extended this research to show that lifestyle activities (cognitive, physical, social) moderated some cognitive status effects on executive functions (de Frias & Dixon, press).
Accordingly, from established techniques for classifying normal and impaired groups we derive coordinated techniques for objectively classifying a cognitively exceptional (or elite) group. The three groups are then compared on baseline episodic, semantic, and working memory performance. After a 4-year longitudinal interval, we apply the same and independent procedures to all returning participants. We then evaluate the stability of the tripartite classification (for the CE, CN, and CI groups) and the effect of subsequent stability (or unstable group patterns) on baseline and 2-wave performance. For the CI group, we note that mild cognitive impairment groups may range widely in longitudinal status stability (Albert et al., 2011; Dolcos et al., 2012; Palmer, Bäckman, Small, & Fratiglioni, 2006; Palmer, Wang, Bäckman, Winblad, & Fratiglioni, 2002). Therefore, stability levels in classified cognitive status may modulate both initial memory differences and subsequent memory changes for all status groups. Our brief rationale of expectations for group-related memory performance is as follows. The CN group is intended to represent typical aging, complete with normal and variable brain and cognitive decrements. Because preclinical effects of impending dementia (e.g., in both Alzheimer’s and Parkinson’s diseases) have been observed in apparently normal aging (e.g., de Frias, Dixon, & Camicioli, 2012; Sliwinski, Hofer, & Hall, 2003; Small, Fratiglioni, Viitanen, Winblad, & Bäckman, 2000) both baseline and second-wave confirmation of objective CN status is tested in this study. Using standard and recommended procedures, the CI group is objectively discriminated from the CN group on the basis of provisionally classified mild cognitive impairment, and these classifications occur independently both at baseline and at the follow-up wave. The associated expectation is that the baseline CN (and stable CN) group will perform memory tasks better than the CI (and stable CI) group. Informal and empirical evidence has also indicated that apparent CN groups may include some subset of neurologically and cognitively advantaged older adults (e.g., de Frias & Dixon, in press; Dixon et al., 2012; Harrison et al., 2011a). Therefore, applying parallel classification procedures, we develop an objectively discriminable CE group, as separated from the established CN group. For the cognitively advantaged CE group, the prospective mechanisms noted above (e.g., brain and cognitive reserve; Stern, 2009) could support or buffer against concurrent and 2-wave memory decline, detectable even among older adults. The expectation is that the CE group will perform better than the CN group across the three domains of memory. Four research questions comparing the classified group performances were addressed. First, do CE, CN, and CI groups differ systematically in baseline memory performance? Second, does 2-wave stability of cognitive status modulate memory performance differences at baseline? For example, we expect that the CN-stable group would perform better on memory than the CN-declining (to CI) group. Third, does initial cognitive status predict differential longitudinal change in memory performance? Fourth, does differential cognitive status stability relate to 2-wave changes in memory performance? We emphasize that all research questions and analyses are addressed to the noted group-level differences, with two-wave individualized trajectories not evaluated.
Method
Participants and Classification
The VLS is a multi-cohort longitudinal study of biomedical, health, cognitive, and neuropsychological aspects of aging. Successive cohorts of 55–85-year-old community-dwelling volunteers were initially recruited in the 1980s, 1990s, and 2000s and followed at 3–4-year intervals (see Dixon & de Frias, 2004, for methodological details). The VLS and all present data collection procedures are in full and certified compliance with prevailing human research ethics guidelines and boards. Written informed consent was obtained from all participants. The participants selected for this study were community-dwelling adults from a larger source VLS sample (VLS Sample 3, S3). For general background information, at Wave 1 (W1) the larger source sample (S3) included n = 570 participants (385 women and 185 men) who were aged 53 to 90 years (M age = 68.2 years, SD = 8.6 years). At Wave 2 (W2), n = 399 participants (270 women and 129 men) (M age = 72.2 years, SD = 8.5 years) were tested. The overall average education was 15.6 years (SD = 2.9). All participants attained scores above 23 on the Mini-Mental State Examination (MMSE; Folstein, Folstein, & McHugh, 1975). Only minor differences were observed in selectivity analyses comparing age, education, and MMSE scores for 2-wave continuers and dropouts. Specifically, the returnees were (a) slightly younger (M = 67.47, SE = .47) than dropouts, (b) somewhat more schooled (M = 15.63, SE = .16) than dropouts (M = 14.44, SE= .22), and (c) equivalent in MMSE performance (M = 28.83, SE = .07) with dropouts (M = 28.50, SE = .09). From this source sample we developed an intended or study sample based on several selection operations. These included (a) the application of objective cognitive status classifications independently at W1 and W2 and (b) the selection of 2-wave enrollees (only) for the planned stability analyses. The selections and study sample are described in the next section.
Cognitive Status Classification Procedure
We began with participants at W1 who were classified into three strictly defined groups representing a continuum of initial cognitive status: Cognitively Elite (CE), Cognitively Normal (CN), and Cognitively Impaired (CI). The tripartite classification procedure was adapted from previous VLS research and consensus statements (e.g., Albert et al., 2011; de Frias et al., 2009; Dixon & de Frias, 2007; Dixon et al., 2007; Dolcos et al., 2012; Ritchie, Artero, & Touchon, 2001). The participants were first stratified by age (53 to 70 and 71 to 90 years) and level of education (0 to 12 or 13+ years), and placed into one of four groups: Young-old (YO low education, n=58; YO high education, n=292) and Old-old (OO low education, n=49; OO high education n=171). Within each group, mean performance was calculated for a three-test cognitive reference battery (digit symbol substitution, letter series, and verbal fluency), representing the cognitive domains of perceptual speed, inductive reasoning, and verbal fluency. See Table 1 for descriptive information representing the classification tests by group and Table 2 for inter-test correlations. Our typical classification procedures are based on an established five-test reference battery. Because two of the five standard tests have memory components, we implemented the 3-test (non-memory) version of the battery for this study. We conducted classification checks (i.e., we compared group-related composition and performance results using MANCOVAs), confirming similar patterns for both the 3- and 5-test versions of the battery. The resulting distributions served as within-sample norms for cognitive status classification. Following and extending previous logic and procedures, we distinguished the CI group from the remainder of the sample, which would have typically been considered a normal control group (CN). However, we reasoned that an apparent but large CN group could contain members at the other (upper) end of the cognitive reference performance distribution (i.e., CE group).Therefore, the three operational definitions were: (a) the CI group included members with at least one score on the cognitive reference tests that was > 1.5 SD below the group mean, (b) the CN group included members who scored between −1.5 SD and +1.5 SD (with at least one score falling below the mean) on the three cognitive reference tests, and (c) the CE group included members who scored above the relevant group mean on all three reference tests. For the latter, we reasoned that this criterion would capture a neighboring group with relatively (but not extremely) higher cognitive abilities and at the same time produce a conservative test of the expected group differences.
Table 1.
Descriptives for Classification Tests by Cognitive Status Group at Wave 1
| Variable | CE | CN | CI | |||
|---|---|---|---|---|---|---|
|
| ||||||
| M | SD | M | SD | M | SD | |
| Digit Symbol Substitution | 59.00 | 7.13 | 48.80 | 8.96 | 43.12 | 11.77 |
| Letter Series | 15.42 | 2.62 | 11.61 | 3.60 | 8.45 | 4.52 |
| Verbal Fluency | 21.45 | 5.00 | 15.31 | 4.60 | 11.71 | 6.05 |
Table 2.
Correlations Between Classification Tests by Cognitive Status Group at Wave 1
| 1 | 2 | 3 | |
|---|---|---|---|
| Variables | |||
| Digit Symbol Substitution | - | ||
| Letter Series | - | ||
| CE | .36*** | ||
| CN | .44*** | ||
| CI | .33*** | ||
| Verbal Fluency | - | ||
| CE | .19 | .40*** | |
| CN | .26*** | .28*** | |
| CI | −.05 | .12 |
Independent W1 and W2 Cognitive Status Classifications
At W1 the strict, objective, and replicable classification procedures produced n=464 participants who fit the exact standards of only one of the three groups. Conversely, n = 106 did not fit precisely into any of the three group characteristics and were excluded from the study sample. Examples of non-fitting reference battery patterns are (a) having a score within the −1.5 to +1.5 SD band for two tests, but above +1.5 SD on a third test (not eligible for CN) and (b) having most but not all scores above the mean (not eligible for CE). This classification procedure was conducted independently at both W1 (n=464) and W2 (n=323), resulting in the following independent groups: (a) CE (W1 n=80, W2 n=65, (b) CN (W1 n=284, W2 n=200), and (c) CI (W1 n=100, W2 n=58). At both waves, the percentages of the total sample classified as CE (17%, 20%), CN (61, 62%), and CI (22%, 18%) were similar and clinically reasonable. The retest reliability coefficients for the three cognitive reference tests were as follows: digit symbol substitution, r = .84; letter series, r = .82; and verbal fluency, r = .69. See Table 3 for descriptive information.
Table 3.
Background Information for the Independently Classified Cognitive Status Groups at Wave 1 (W1) and Wave 2 (W2)
| Variable | CE (83% women) | CN (66% women) | CI (68% women) | ||||
|---|---|---|---|---|---|---|---|
|
|
|||||||
| M | SD | M | SD | M | SD | ||
| Age | W1 | 66.07 | 7.83 | 68.51 | 8.65 | 68.59 | 8.33 |
| W2 | 69.86 | 7.66 | 72.59 | 8.56 | 72.16 | 7.47 | |
| Education | W1 | 15.81* | 3.32 | 15.29* | 2.74 | 14.60* | 3.15 |
| W2 | 15.57 | 3.25 | 15.74 | 2.77 | 14.88 | 2.98 | |
| MMSE | W1 | 29.10** | 1.27 | 28.73** | 1.20 | 28.52** | 1.21 |
| W2 | 29.26** | 0.87 | 28.51** | 1.26 | 28.27** | 1.33 | |
| Absolute Health | W1 | 1.71 | 0.78 | 1.84 | 0.72 | 1.91 | 0.89 |
| W2 | 1.80 | 0.81 | 1.94 | 0.80 | 1.91 | 0.73 | |
| Relative Health | W1 | 1.59 | 0.77 | 1.84 | 0.72 | 1.69 | 0.83 |
| W2 | 1.72 | 0.74 | 1.60 | 0.68 | 1.69 | 0.64 | |
Notes: The asterisks denote significant group differences. The CE and CN groups had more years of education than the CI group. For MMSE at W1 and W2, the CE group had higher scores than the CN and CI groups. No other group differences were significant.
Cognitive Status Stability Groups
By definition, in order to address status stability research questions, we required a sample that included only classifiable participants enrolled at both waves. Stability cannot be addressed without two linked waves of measurement for all individuals. Of the n=323 participants at W2, a total of n=276 participants were enrolled and classified in both W1 and W2, thus defining the stability study group, a fully-enrolled subsample. Overall, regarding the group stability results, n=209 (76%) remained (i.e., were stable over the four-year interval) in their initial cognitive status groups. For the initial CE group (n=59), 34 (58%) continued as CE (CE-CE, indicating stable cognitively healthy) and 25 (42%) declined to CN status (CE-CN, normal decline or variability). For the initial CN group (n=185), 140 (76%) continued as CN (CN-CN), 20 (11%) declined to CI (CN-CI, indicating transition to impairment), and 25 (14%) appeared as CE (CN-CE, likely borderline variability). For the initial CI group (n=57), 35 (61%) continued as CI (CI-CI, indicating chronic impairment), 19 (33%) appeared as CN (CI-CN, likely borderline or transitional), and 3 (6%) appeared as CE (CI-CE). See Table 4 for a summary of the proportion of changers and non-changers in cognitive status. We compared the stable status groups with their main corresponding unstable status groups for both W1 and W1-W2 memory performance. Therefore, we focused on contrasts of CE-CE vs. CE-CN, CN-CN vs. CN-CI, and CI-CI vs. CI-CN, with the latter being notable for a comparison with an improving-status group. Two small unstable variability groups for which we had no predictions (CN-CE; n=25 and CI-CE; n=3) were excluded for theoretical (e.g., no readily available interpretations for status improvement and no possibility for CI status decline) and methodological (e.g., limiting multiple comparisons, no hypotheses, small n groups) reasons.
Table 4.
Proportion of cognitive status changers and non-changers at Wave 1 and Wave 2
| Group | W1 | W2 | |
|---|---|---|---|
|
| |||
| Status Changers | Status Non-Changers | ||
|
|
|||
| CE | n=59 (20%) | CE-CN n=25 (42%) | 34 (58%) |
| CN | n=185 (61%) | CN-CI n=20 (11%) CN-CE n=25 (14%) |
140 (76%) |
| CI | n=57 (19%) | CI-CN 22 (39%) | 35 (61%) |
Memory Measures
Two standard VLS tasks were used to mark each memory cluster. All composite measures were converted to T-score units.
Episodic Memory
Two VLS tasks were used (Dixon et al., 2004). The word recall task requires participants to remember two equivalent 30-word lists. The VLS story recall task requires participants to remember two structurally equivalent narratives (about 300 words and 160 propositions). The initial outcome measure for both was the percent of correctly recalled information (word, propositions). The composite was used for the concurrent analyses (W1). Only the word recall measure was available for the longitudinal stability analyses. The retest reliability for the word recall measure was r = .78.
Semantic Memory
The vocabulary test (Ekstrom, French, Harman, & Derman, 1976) has 54 multiple-choice items and the participants were asked to provide the best response and complete the task within 15 min. The fact recall task (Nelson & Narens, 1980) has two sets of 40 questions that tested individuals’ recall of various world facts. The initial outcome measures were percentages of correct responses. The retest reliability for the semantic memory composite measure was r = .90.
Working Memory
The Computation Span task (Salthouse & Babcock, 1991) required participants to solve a series of arithmetic problems while holding the final digit from each problem in memory for later recall. The highest span correctly recalled for two out of three trials was the measure used. The VLS reading span task required participants to answer questions about simple sentences that were orally presented while simultaneously trying to remember the final word of each sentence for later recall. Initial score was the highest span correctly recalled for two out of three trials. The retest reliability for the working memory composite measure was r = .69.
Statistical Analyses
Alpha levels of p < .05 were specified as the threshold to indicate significance. Given that there were cognitive status differences by education and MMSE scores (see Table 3), all subsequent analyses covaried for baseline education and MMSE scores. Analyses are described according to four research questions. For longitudinal stability analyses, MANCOVAs were appropriate given the full enrollment (no attrition) at both waves. Because the memory variables reflect theoretically distinct memory systems, we selectively examined the individual variable results even in the absence of an overall significant effect for the linear combination: these are interpreted with caution.
Research Question 1: Do CE, CN, and CI groups differ in baseline (W1) memory performance?
A one-way cognitive status groups (3: CE, CN, CI) multivariate analysis of covariance (MANCOVA), covarying for education and MMSE was conducted on the three memory composites at W1.
Research Question 2: Does 2-wave stability of cognitive status by the three status groups modulate W1 memory performance?
After identifying and subdividing the CE, CN, and CI groups into two-wave stability subgroups, we conducted three separate one-way MANCOVAs, each with two levels of stability-status group (i.e., CE-CE and CE-CN; CN-CN and CN-CI; CI-CI and CI-CN).
Research Question 3: Does initial cognitive status relate to memory change over the 2-wave interval?
A cognitive status group (3: CE, CN, CI) by wave (2: W1, W2) repeated measures MANCOVA was conducted on the composite memory measures. Of direct interest were group by wave interactions.
Research Question 4: Does cognitive status stability relate to 2-wave memory change?
We conducted three separate two-way stability-status group (CE-CE, CE-CN; CN-CN, CN-CI; CI-CI, CI-CN) by wave (2: W1, W2) repeated measures MANCOVAs on the three memory composites.
Results
Research Question 1: Group Differences in Baseline (W1) Memory Performance
The analyses showed that the main effect of group was significant for episodic memory, F(2,277) = 32.92, p < .001, η2 = .19; semantic memory, F(2,277) = 41.67, p < .001, η2 = .23; and working memory, F(2,277) = 24.95, p < .001, η2 = .15. As seen in Figure 1, all groups differed from each other, with each level of cognitive status performing significantly better than correspondingly lower status groups.
Figure 1.
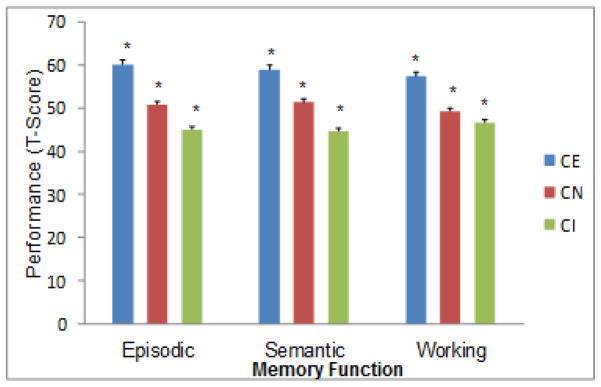
Cognitive status classification at Wave 1 is associated with expected group differences in three domains of memory performance (CE > CN > CI). Separate results for Wave 2 were consistent.
Research Question 2: Three-year Stability of Cognitive Status and Memory Performance at W1
We first tested whether the two stable groups (i.e., CE-CE and CN-CN) would perform better on the three W1 memory composites than their corresponding declining status groups (i.e., CE-CN and CN-CI), after controlling for MMSE and education. Next, we tested whether the third stable group (CI-CI) would perform worse than the corresponding improving group (CI-CN) on the W1 memory composites, after controlling for MMSE and education. All three separate MANCOVAs revealed significant effects in the expected direction. First (comparing CE-CE, CE-CN), the main effect of stability status was significant for episodic memory, F(1,47) = 4.42, p < .05, η2 = .09; and working memory, F(1,47) = 12.35, p < .001, η2 = .21. Second (comparing CN-CN, CN-CI), the main effect of stability status was significant for episodic memory, F(1,165) = 15.88, p < .001, η2 = .09; and semantic memory, F(1,165) = 6.37, p < .01, η2 = .04. Third (comparing CI-CI, CI-CN), the main effect of stability status was significant for semantic memory, F(1,74) = 14.57, p < .001, η2 = .16; and working memory, F(1,74) = 5.45, p < .05, η2 = .07. As expected the CE and CN groups showing future 2-wave status stability (CE-CE, CN-CN) had better memory performance, as compared with their counterparts who experienced subsequent cognitive status decline (CE-CN, CN-CI) (see Figures 2a–2b). In contrast, as expected, the stable lower performers (CI-CI) had worse initial memory performance than did those who improved over the subsequent period (CI-CN) (see Figure 2c).
Figure 2.


Two-wave differential cognitive status stability is associated with baseline memory performance in expected directions. Figures 2a and 2b reflect potential normal to preclinical memory decline effects: 2a: CE-CE > CE-CN. 2b: CN-CN > CN-CI. Figure 2c reflects stabilizing memory decrements among chronic impaired participants as compared with the unstable or borderline group: CI-CI < CI-CN.
Research Question 3: Baseline Cognitive Status and Subsequent Memory Change
MANCOVAs for cognitive status group (3: CE, CN, CI) by wave (2: W1, W2) showed that the overall main effect of wave, F(3,272) = 14.73, p < .001, η2 = .14, and the overall main effect of group, F(6,544) = 22.53, p < .001, η2 = .20, were significant. The overall wave by group interaction was significant, F(6,544) = 19.59, p < .001, η2 = .18. The univariate effect of wave was significant for episodic memory, F(1,274) = 42.71, p < .001, η2 = .22 but not for semantic memory or working memory. There was a slight overall decline in episodic memory (W1: M = 52.32, SE = .50; W2: M = 52.25, SE = .50). The univariate main effect of group (all CE>CN>CI) was significant for episodic memory, F(2,274) = 37.89, p < .001, η2 = .22, semantic memory, F(2,274) = 41.35, p < .001, η2 = .23, and working memory, F(2,274) = 32.39, p < .001, η2 = .19. The wave by group interaction was significant for episodic memory, F(2,274) = 37.88, p < .001, η2 = .22, and semantic memory, F(2,274) = 41.35, p < .001, η2 = .23, but not for working memory. To further probe the interactions, three follow-up MANCOVAs (one for each cognitive status group) were conducted. For the CN group, there was a significant main effect of wave for episodic memory only, F(1,164) = 27.61, p < .001, η2 = .14, indicating decline (W1: M = 50.81, SE = .58; W2: M = 50.76, SE = .58). For the CI group, there was a significant main effect of wave for episodic memory, F(1,58) = 10.68, p < .01, η2 = .16, indicating decline (W1: M = 46.47, SE = 1.03; W2: M = 46.46, SE = 1.02). The CE group did not show significant change in episodic memory. Follow-up MANCOVAs by cognitive status group did not show significant main effects of wave for semantic memory.
Research Question 4: Does Stability of Cognitive Status Affect Memory Change
For the first group comparison (CE-CE vs. CE-CN), the overall effect of stability-status group, F(3,45) = 5.84, p < .01, η2 = .28, was significant, but the overall effect of wave, and the wave by group interaction were not significant. The univariate main effect of wave was not significant for any of the memory measures. The univariate main effect of group was significant for episodic memory, F(1,47) = 4.64, p < .05, η2 = .09 and working memory, F(1,47) = 14.76, p < .001, η2 = .24, but not semantic memory. For episodic memory, the stable group (CE-CE) performed better (M = 61.67, SE = 1.08) than the unstable group (CE-CN) (M = 57.70, SE = 1.38). For working memory, the stable group (CE-CE) performed better (M = 60.16, SE = 1.41) than the unstable group (CE-CN) (M = 50.86, SE = 1.80). The univariate wave by group interaction was significant for episodic memory, F(1,47) = 4.64, p < .05, η2 = .09, but not for semantic memory and working memory. The groups slightly declined on episodic memory (CE-CE: W1 M = 61.75, SE = 1.08, W2 M = 61.59, SE = 1.07; CE-CN: W1 M = 57.76, SE = 1.38, W2 M = 57.63, SE = 1.37).
For the second group comparison (CN-CN vs. CN-CI), the overall effects of wave, F(3,145) = 10.31, p < .001, η2 = .18, was significant, but the overall stability-status group and overall wave by group interaction, were not significant. The univariate main effect of wave was significant for episodic memory, F(1,147) = 30.75, p < .001, η2 = .17, but not for semantic memory and working memory. There was an overall significant decline in episodic memory (W1: M = 49.62, SE = .90; W2: M = 49.58, SE = .89). The univariate main effect of group was not significant for episodic memory, semantic memory, or working memory. The univariate wave by group interaction was not significant for any of the memory measures.
For the third group comparison (CI-CI vs. CI-CN), the overall effects of wave, stability-status group and the wave by group interaction, were not significant. The univariate main effect of wave was significant for episodic memory, F(1,53) = 6.17, p < .05, η2 = .10, but not for semantic memory or working memory.. However, inspection of the means shows that the magnitude of change was minuscule (W1: M = 46.54, SE = 1.06, W2: M = 46.53, SE = 1.05), indicating that there was minimal change in episodic memory. The univariate main effect of group was not significant for any memory measures. The univariate wave by group interaction was not significant for any memory measures.
Discussion
Much cognitive neuropsychological research on aging focuses on clinical conditions that (a) are associated with underlying neurodegeneration, impairment, injury, or disease (e.g., Cosentino et al., 2011; Fotuhi et al., 2009; Jack et al., 2011) or (b) may produce cognitive performance that varies from that of normal aging or preclinical impaired phases (e.g., Albert et al., 2011; Small et al., 2000). Given the growing population of seemingly healthy and active older adults, some researchers have begun investigating the extent to which sustained high levels of cognitive status may constitute more than just intriguing but widely varying anecdotal cases of exceptional older adults (Depp & Jeste, 2006). Theoretically, the differences between cognitively adaptive or healthy (even putative “superagers”) and normal aging are likely continuous, with neurologically, genetically, or environmentally favored aging individuals occupying an upper cluster of a distribution of cognitive health (Dixon, 2010; National Institute on Aging, 2008; Nyberg et al., 2012). Accordingly, we adapted standard objective procedures of classifying neighboring clusters of impaired (e.g., MCI) and normal (e.g., typical) older adults to the identification of a cognitively advantaged group. We then focused on three memory systems that have been identified as an early markers of precipitous cognitive decline (episodic), relatively preserved over adulthood (semantic), and a basic resource associated with aging decline (working memory). Although the present status-group-based goals were considerably different, some traditional large-scale longitudinal memory change research informed our perspective, as they have demonstrated interpretable variability in late-life performance trajectories (e.g., Anstey, 2012; Dixon et al., 2012; Josefsson et al., 2012; Nyberg et al., 2003). However, this study did not track or address individualized performance trajectories. Overall, we observed predicted performance patterns consistent with favored initial cognitive status and 2-wave status stability.
The answer to our first research question was as straightforward as predicted. The three status groups differed reliably from one another on all baseline average memory performances. The results confirmed that objective classifications of contiguous status clusters can be at least tripartite. They also confirmed that CN and CI groups could be distinguished on three memory systems. Moreover, novel results showed that cognitively healthy (CE) adults performed differently from their normal-aging (CN) counterparts. Future research should include potential modifier variables, ranging from lifestyle-activity (Carlson et al., 2012; de Frias & Dixon, in press; Small et al., 2012) to neurobiological (e.g., individual differences in aging-related genotype or neurological changes; Harrison et al., 2011a; Park & Reuter-Lorenz, 2009).
The results to our second question underscored the associated memory implications of cognitive status group stability. First, although some cognitive status classification procedures have produced groups that have limited stability, the present procedures produced three groups of similar and substantial 4-year stabilities (overall stability = 73%). The corresponding stabilities for each status group were within a reasonable range (CE-CE=61%, CN-CN=77%, CI-CI=72%). In the context of good stabilities and aging adults, some one-step status transitions would be expected. Reasons for this include naturally occurring aging variability across 4-year intervals, genuine status decline over time, and some residual imprecision in status assessment. Further research on individual characteristics of unstable status patterns is recommended, but larger transition samples would be helpful. Second, we evaluated baseline memory performance by comparing the stable versus instable subgroups within each cognitive status group. Our predictions were derived from theoretical and clinical literature (e.g., de Frias et al., 2012) for which declining general cognitive status (e.g., CN-CI, transition to impairment) could be associated with worse baseline performance than would stable status (e.g., CN-CN, stable neurocognitive aging), due to subtle preclinical (perhaps neurodegenerative; Sliwinski et al., 2003; Small et al., 2000) effects unfolding between the two waves. As expected, the W1 memory implications were evident across all three domains. Regarding the less-studied CE-CE memory advantage (compared with CE-CN), sustained high general cognitive status may signal notably sustained neural and cognitive health with aging—and such success may be evident even at W1. Even status change to normal levels (from healthy or elite levels) may be (a) detected with these classification procedures, (b) reflected in performance on three domains of memory, and (c) identified when memory is measured prior to the status decline. On the other hand, a previously puzzling result of other MCI stability studies (e.g., Koepsell et al., 2012; Palmer et al., 2002) is that some initially classified impaired participants seem to “recover” to normal general classifications. Such a phenomenon is likely linked to either (a) real variability in cognitive status, especially at the borderline between normal and impaired aging or (b) limitations in the assessment procedure or to other non-neurodegenerative influences present at W1 being absent at W2. Our results show that CI stability differences are detectable at W1. Researchers and clinicians are advised to check their classifications routinely by follow-up independent evaluations. This issue of clinical classification (Albert et al., 2011; Dolcos et al., 2012) is also an issue that influences initial memory performance (Fig. 2c).
For the third research question we examined whether two-wave group memory differences were differentially affected by baseline cognitive status. We observed a statistically significant group × wave interaction for episodic memory, indicating significant decline for CN and CI, but not for the healthy CE group. However, an inspection of the modest mean differences and the associated 95% confidence intervals suggested caution in theoretical interpretation. For the fourth research question we examined whether two-wave group memory change was differentially affected by stability within each cognitive status group. Again, statistically significant group × wave interactions suggested promising results for episodic memory, but the means and confidence intervals indicated interpretive caution. Although the results are encouraging, the expected slope-related interactions may appear more slowly for the present initially healthy and mild cases of emerging cognitive impairment. Longer follow-up intervals (and more waves) are recommended. Furthermore, the high test-retest reliability for episodic and semantic memory indicates that these psychometrically reliable measures may limit the ability to detect change.
In sum, the results of this study clearly show that a cognitively advantaged or exceptional group of older adults can be objectively and clinically distinguished from typical cognitively normal and impaired groups. As has been implied by other longitudinal research (e.g., Anstey, 2012; Dixon et al., 2012; Josefsson et al., 2012; Mungas et al., 2010), one implication for neuropsychological aging is that the terms “normal” and “healthy” are not necessarily interchangeable as applied to comparison or control groups for younger or impaired older adults. Normal older groups should be documented not only to ensure the absence of preclinical impairment (Sliwinski et al., 2003) but also the absence of subgroups with atypically favorable brain and cognitive health. The objective classification procedures produced (a) stable status groups over a two-wave interval, (b) baseline memory differences in three different domains, and (c) stability-related subgroup memory differences. Regarding status-related change, however, the results were promising but not definitive. We would expect that additional years of aging as reflected in a third wave assessment would contribute to more notably differential change patterns.
Several limitations and associated future directions should be noted. First, the slightly truncated objective classification procedures worked very well for both concurrent and short-term stability purposes, but future research could explore alternative definitions of the cognitive elite group (e.g., setting a higher standard) and the cognitively impaired group (e.g., setting a lower standard such that only substantial decliners are included). We encourage future researchers to explore criteria that produce different diagnostic intensities. Second, although the present research design and guiding questions are relatively novel in the neuropsychological study of cognitively sustained or exceptional aging, a third wave will provide additional power for testing slope (and non-linear) effects. Future research may reflect that “healthy” and “normal” or “typical” aging are terms that are not synonymous and should therefore be used advisedly (and with the presence of supportive evidence). Third, the present study was not designed or intended to address directly earlier and ongoing research in general “successful aging” (Baltes & Baltes, 1990; Rowe & Kahn, 1987, 1998). As this research area develops further (see Depp & Jeste, 2006), it may both contribute to and benefit from the approaches used in emerging research on brain and cognitive health in aging. Fourth, we encourage further exploration of variables that might be associated with differential levels, trajectories, and transitions in cognitive status groups over time (e.g., Dolcos et al., 2012; Koepsell et al., 2012). Whether such potential modifiers are the same for cognitively advantaged older adults (our CE group) as they seem to be for cognitively normal and impaired adults is a question of interest (e.g., Cherbuin et al., 2009; Nyberg et al., 2012). The modifiers that are especially relevant for predicting transitions (e.g., variations around the normal-impairment continuum) are clinically compelling. Specifically, future researchers may explore the extent to which relative risk/protective factors from lifestyle-activities, functional biological, neurogenetic, or neuroanatomical realms modulate initial status, status change/stability, and memory implications (e.g., Albert et al., 2011; Dolcos et al., 2012; Harrison et al., 2011a; Park & Reuter-Lorenz, 2009; Stern, 2007; Zubenko, Hughes, Zubenko, & Maher, 2007). For example, success at distinguishing stable subgroups from their corresponding decliners would bring us even closer to understanding key precursors and patterns leading differentially to healthy or impaired aging.
Acknowledgments
The VLS and the present research are supported by a grant from the National Institutes of Health (National Institute on Aging; R01 AG 008235) to Roger A. Dixon, who is also supported by the Canada Research Chairs program. We thank the volunteer participants and the VLS staff for their many contributions. More information about the VLS may be found at: http://www.ualberta.ca/~vlslab/.
Contributor Information
Roger A. Dixon, Department of Psychology, University of Alberta
Cindy M. de Frias, School of Behavioral and Brain Sciences, The University of Texas at Dallas
References
- Albert MS, DeKoskey ST, Dickson D, Dubois B, Feldman HH, Fox NC, Phelps CH. The diagnosis of mild cognitive impairment due to Alzheimer’s disease. Alzheimer’s & Dementia. 2011;7:270–279. doi: 10.1016/j.jalz.2011.03.008. [DOI] [PMC free article] [PubMed] [Google Scholar]
- Anstey KJ. Functional biomarkers and memory ageing. In: Naveh-Benjamin M, Ohta N, editors. Memory and aging. New York, NY: Psychology Press; 2012. [Google Scholar]
- Baltes PB, Baltes MM, editors. Successful aging. Cambridge: Cambridge University Press; 1990. [Google Scholar]
- Brown BM, Peiffer JJ, Martins RN. Multiple effects of physical activity on molecular and cognitive signs of brain aging: Can exercise slow neurodegeneration and delay Alzheimer’s disease? Molecular Psychiatry. 2012:1–11. doi: 10.1038/mp.2012.162. epub ahead of publication. [DOI] [PubMed] [Google Scholar]
- Carlson MC, Parisi JM, Xia J, Xue QL, Rebok GW, Bandeen-Rorhe K, Fried LP. Lifestyle activities and memory: Variety may be the spice of life. The Women’s Health and Aging Study II. Journal of the International Neuropsychological Society. 2012;18:286–294. doi: 10.1017/S135561771100169X. [DOI] [PMC free article] [PubMed] [Google Scholar]
- Cherbuin N, Reglade-Meslin C, Kumar R, Jacomb P, Easteal S, Christensen H, Anstey KJ. Risk factors of transition from normal cognition to mild cognitive disorder: The PATH through Life Study. Dementia and Geriatric Cognitive Disorders. 2009;28:47–55. doi: 10.1159/000229025. [DOI] [PubMed] [Google Scholar]
- Cosentino SA, Brickman AM, Manly JJ. Neuropsychological assessment of the dementias of late life. In: Schaie KW, Willis SL, editors. Handbook of the psychology of aging. 7. Elsevier; 2011. pp. 339–352. [Google Scholar]
- Craik FIM, Salthouse TA, editors. The handbook of aging and cognition. 3. New York, NY: Psychology Press; 2008. [Google Scholar]
- de Frias CM, Dixon RA. Lifestyle engagement affects cognitive status differences and trajectories on executive functions in older adults. Archives of Clinical Neuropsychology. doi: 10.1093/arclin/act089. (in press) [DOI] [PMC free article] [PubMed] [Google Scholar]
- de Frias CM, Dixon RA, Camicioli R. Neurocognitive inconsistency in Parkinson’s disease with and without dementia: An 18-month prospective cohort study. Journal of the International Neuropsychological Society. 2012;18:764–772. doi: 10.1017/S1355617712000422. [DOI] [PMC free article] [PubMed] [Google Scholar]
- de Frias CM, Dixon RA, Strauss E. Structure of executive functioning tests in healthy older adults. Neuropsychology. 2006;20:206–214. doi: 10.1037/0894-4105.20.2.206. [DOI] [PubMed] [Google Scholar]
- de Frias CM, Dixon RA, Strauss E. Characterizing executive functioning in older special populations: From cognitively elite to cognitively impaired. Neuropsychology. 2009;23:778–791. doi: 10.1037/a0016743. [DOI] [PMC free article] [PubMed] [Google Scholar]
- Depp CA, Jeste DV. Definitions and predictors of successful aging: A comprehensive review of larger quantitative studies. American Journal of Geriatric Psychiatry. 2006;14:6–20. doi: 10.1097/01.JGP.0000192501.03069.bc. [DOI] [PubMed] [Google Scholar]
- Dixon RA. An epidemiological approach to cognitive health in aging. In: Bäckman L, Nyberg L, editors. Memory, aging, and the brain. London, England: Psychology Press; 2010. pp. 144–166. [Google Scholar]
- Dixon RA, de Frias CM. The Victoria Longitudinal Study: From characterizing cognitive aging to illustrating changes in memory compensation. Aging, Neuropsychology, and Cognition. 2004;11:346–376. [Google Scholar]
- Dixon RA, de Frias CM. Mild memory deficits differentially affect six-year changes in compensatory strategy use. Psychology and Aging. 2007;22:632–638. doi: 10.1037/0882-7974.22.3.632. [DOI] [PubMed] [Google Scholar]
- Dixon RA, Garrett DD, Lentz TL, MacDonald SWS, Strauss E, Hultsch DF. Neurocognitive markers of cognitive impairment: Exploring the roles of speed and inconsistency. Neuropsychology. 2007;21:381–399. doi: 10.1037/0894-4105.21.3.381. [DOI] [PubMed] [Google Scholar]
- Dixon RA, Small BJ, MacDonald SWS, McArdle JJ. Yes, memory declines with aging--but when, how, and why? In: Naveh-Benjamin M, Ohta N, editors. Memory and aging. New York, NY: Psychology Press; 2012. pp. 325–347. [Google Scholar]
- Dixon RA, Wahlin Å, Maitland SB, Hultsch DF, Hertzog C, Bäckman L. Episodic memory change in late adulthood: Generalizability across samples and performance indices. Memory & Cognition. 2004;32:768–778. doi: 10.3758/bf03195867. [DOI] [PubMed] [Google Scholar]
- Dolcos S, MacDonald SWS, Braslavsky A, Camicioli R, Dixon RA. Mild cognitive impairment is associated with selected functional markers: Integrating concurrent, longitudinal, and stability effects. Neuropsychology. 2012;26:209–223. doi: 10.1037/a0026760. [DOI] [PMC free article] [PubMed] [Google Scholar]
- Ekstrom RB, French JW, Harman H, Derman D. Kit of factor-referenced cognitive tests. Princeton, NJ: Educational Testing Service; 1976. (rev. ed.) [Google Scholar]
- Folstein MF, Folstein SE, McHugh PR. Mini-Mental State: A practical method for grading the cognitive state of patients for the clinician. Journal of Psychiatric Research. 1975;12:189–198. doi: 10.1016/0022-3956(75)90026-6. [DOI] [PubMed] [Google Scholar]
- Fotuhi M, Hachinski V, Whitehouse PJ. Changing perspectives regarding late-life dementia. Nature Reviews Neurology. 2009;5:1–10. doi: 10.1038/nrneurol.2009.175. [DOI] [PubMed] [Google Scholar]
- Fratiglioni L, Wang HX. Brain reserve hypothesis in dementia. Journal of Alzheimer’s Disease. 2007;12:11–22. doi: 10.3233/jad-2007-12103. [DOI] [PubMed] [Google Scholar]
- Garrett DD, Grady CL, Hasher L. Everyday memory compensation: The impact of cognitive reserve, subjective memory, and stress. Psychology and Aging. 2010;25:74–83. doi: 10.1037/a0017726. [DOI] [PubMed] [Google Scholar]
- Greenberg DL, Verfaellie M. Interdependence of episodic and semantic memory: Evidence from neuropsychology. Journal of the International Neuropsychological Society. 2010;16:748–753. doi: 10.1017/S1355617710000676. [DOI] [PMC free article] [PubMed] [Google Scholar]
- Gross AL, Rebok GW, Unverzagt FW, Willis SL, Brandt J. Cognitive predictors of everyday functioning in older adults: Results from the ACTIVE Cognitive Intervention Trial. Journal of Gerontology: Psychological Sciences. 2011;66:557–566. doi: 10.1093/geronb/gbr033. [DOI] [PMC free article] [PubMed] [Google Scholar]
- Harrison TM, Weintraub S, Mesulam M, Rogalski E. The neuroanatomy of superaging: Increased cortical thickness in the anterior cingulate cortex. Paper presented at the International Society of Neuropsychology; Boston. 2011a. Feb, [Google Scholar]
- Harrison TM, Geula C, Shi J, Sammi M, Weintraub S, Mesulam M, Rogalski E. Neuroanatomic and pathological features of cognitive superaging. Poster presented at the Society for Neuroscience; Washington, DC. 2011b. Nov, [Google Scholar]
- Hertzog C. Theoretical approaches to the study of cognitive aging: An individual differences perspective. In: Hofer SM, Alwin DF, editors. Handbook of cognitive aging. Thousand Oaks, CA: Sage Publications; 2008. pp. 34–49. [Google Scholar]
- Hertzog C, Dixon RA, Hultsch DF, MacDonald SWS. Latent change models of adult cognition: Are changes in processing speed and working memory associated with changes in episodic memory? Psychology and Aging. 2003;18:755–770. doi: 10.1037/0882-7974.18.4.755. [DOI] [PubMed] [Google Scholar]
- Hertzog K, Kramer AF, Wilson RS, Lindenberger U. Enrichment effects on adult cognitive development. Psychological Science in the Public Interest. 2008;9:1–65. doi: 10.1111/j.1539-6053.2009.01034.x. [DOI] [PubMed] [Google Scholar]
- Jack CR, Jr, Albert MS, Knopman DS, McKhann GM, Sperling RA, Carrillo MC, Phelps CH. Introduction and recommendations from the National Institute on Aging-Alzheimer’s Association workgroups on diagnostic guidelines for Alzheimer’s disease. Alzheimer’s & Dementia. 2011;7:257–262. doi: 10.1016/j.jalz.2011.03.004. [DOI] [PMC free article] [PubMed] [Google Scholar]
- Josefsson M, de Luna X, Pudas S, Nilsson L-G, Nyberg L. Genetic and lifestyle predictors of 15-year longitudinal change in episodic memory. Journal of the American Geriatric Society. 2012;60(12):2308–2312. doi: 10.1111/jgs.12000. [DOI] [PubMed] [Google Scholar]
- Koepsell TD, Monsell SE. Reversion from mild cognitive impairment to normal or near-normal cognition: Risk factors and prognosis. Neurology. 2012;79:1591–1598. doi: 10.1212/WNL.0b013e31826e26b7. [DOI] [PMC free article] [PubMed] [Google Scholar]
- Luszcz M. Executive function and cognitive aging. In: Schaie KW, Willis SL, editors. Handbook of the psychology of aging. 7. New York, NY: Elsevier; 2011. pp. 59–72. [Google Scholar]
- MacDonald SWS, DeCarlo CA, Dixon RA. Linking biological and cognitive aging: Towards improving characterizations of developmental time. Journal of Gerontology: Psychological Sciences. 2011;66B:i59–i70. doi: 10.1093/geronb/gbr039. [DOI] [PMC free article] [PubMed] [Google Scholar]
- McFall GP, Wiebe SA, Vergote D, Jhamandas J, Westaway D, Dixon RA. IDE (rs6583817) polymorphism and pulse pressure are independently and interactively associated with level and change in executive function in older adults. Psychology and Aging. doi: 10.1037/a0034656. (in press) [DOI] [PMC free article] [PubMed] [Google Scholar]
- Miyake A, Friedman NP, Emerson MJ, Witzki AH, Howerter A, Wager TD. The unity and diversity of executive functions and their contributions to complex “Frontal Lobe” tasks: A latent variable analysis. Cognitive Psychology. 2000;41:49–100. doi: 10.1006/cogp.1999.0734. [DOI] [PubMed] [Google Scholar]
- Mungas D, Beckett L, Harvey D, Farias ST, Reed B, Carmichael O, DeCarli C. Heterogeneity of cognitive trajectories in diverse older persons. Psychology and Aging. 2010;25(3):606–619. doi: 10.1037/a0019502526. [DOI] [PMC free article] [PubMed] [Google Scholar]
- National Institute on Aging. Workshop summary: Genetic methods and life course development. Washington, DC: National Institutes of Health; 2008. [Google Scholar]
- Nelson T, Narens L. Norms of 300 general-information questions: Accuracy of recall, latency of recall, and feeling-of-knowing ratings. Journal of Verbal Learning and Verbal Behavior. 1980;19:338–368. [Google Scholar]
- Nyberg L, Maitland SB, Rönnlund M, Bäckman L, Dixon RA, Wahlin Å, Nilsson LG. Selective adult age differences in an age-invariant multi-factor model of declarative memory. Psychology and Aging. 2003;18:149–160. doi: 10.1037/0882-7974.18.1.149. [DOI] [PubMed] [Google Scholar]
- Palmer K, Bäckman L, Small BJ, Fratiglioni L. Cognitive impairment in elderly persons without dementia: Findings from the Kungsholmen Project. In: Tuokko H, Hultsch DF, editors. Mild cognitive impairment. New York, NY: Taylor & Francis; 2006. pp. 57–75. [Google Scholar]
- Palmer K, Wang HX, Bäckman L, Winblad B, Fratiglioni L. Differential evolution of cognitive impairment in nondemented older persons: Results from the Kungsholmen Project. The American Journal of Psychiatry. 2002;159:436–442. doi: 10.1176/appi.ajp.159.3.436. [DOI] [PubMed] [Google Scholar]
- Park DC, Reuter-Lorenz P. The adaptive brain: Aging and neurocognitive scaffolding. Annual Review of Psychology. 2009;60:173–196. doi: 10.1146/annurev.psych.59.103006.093656. [DOI] [PMC free article] [PubMed] [Google Scholar]
- Reuter-Lorenz PA, Cappell K. Neurocognitive aging and the compensation hypothesis. Current Directions in Psychological Science. 2008;17:177–182. [Google Scholar]
- Ritchie K, Artero S, Touchon J. Classification criteria for mild cognitive impairment: A population-based validation study. Neurology. 2001;56:37–42. doi: 10.1212/wnl.56.1.37. [DOI] [PubMed] [Google Scholar]
- Rowe JW, Kahn RL. Human aging: Usual and successful. Science. 1987;237:143–149. doi: 10.1126/science.3299702. [DOI] [PubMed] [Google Scholar]
- Rowe JW, Kahn RL. Successful aging. New York, NY: Dell; 1998. [Google Scholar]
- Royall DR, Palmer R, Chiodo LK, Polk MJ. Normal rates of cognitive change in successful aging: The Freedom House Study. Journal of the International Neuropsychological Society. 2005;11:899–909. doi: 10.1017/s135561770505109x. [DOI] [PubMed] [Google Scholar]
- Salthouse TA, Babcock RL. Decomposing adult age differences in working memory. Developmental Psychology. 1991;27:763–776. [Google Scholar]
- Sliwinski M, Hofer S, Hall C. Correlated and coupled cognitive change in older adults with and without preclinical dementia. Psychology and Aging. 2003;18:672–683. doi: 10.1037/0882-7974.18.4.672. [DOI] [PubMed] [Google Scholar]
- Small BJ, Fratiglioni L, Viitanen M, Winblad B, Bäckman L. The course of cognitive impairment in preclinical Alzheimer disease: Three- and 6-year follow-up of a population-based sample. Archives of Neurology. 2000;57(6):839–844. doi: 10.1001/archneur.57.6.839. doi: noc90093. [DOI] [PubMed] [Google Scholar]
- Small BJ, Dixon RA, McArdle JJ, Grimm KJ. Do changes in lifestyle engagement moderate cognitive decline in normal aging? Evidence from the Victoria Longitudinal Study. Neuropsychology. 2012;26:144–155. doi: 10.1037/a0026579. [DOI] [PMC free article] [PubMed] [Google Scholar]
- Stern Y, editor. Cognitive reserve: Theory and applications. Philadelphia, PA: Taylor & Francis; 2007. [Google Scholar]
- Stern Y. Cognitive reserve. Neuropsychologia. 2009;47:2015–2028. doi: 10.1016/j.neuropsychologia.2009.03.004. [DOI] [PMC free article] [PubMed] [Google Scholar]
- St Laurent M, Abdi H, Burianova H, Grady CL. Influence of aging on the neural correlates of authobiographical, episodic, and semantic memory retrieval. Journal of Cognitive Neuroscience. 2011;23:4150–4163. doi: 10.1162/jocn_a_00079. [DOI] [PMC free article] [PubMed] [Google Scholar]
- Zubenko GS, Hughes HB, Zubenko WN, Maher BS. Genome survey for loci that influence successful aging: Results at 10-cM resolution. American Journal of Geriatric Psychiatry. 2007;15:184–193. doi: 10.1097/01.JGP.0000231681.89741.af. [DOI] [PubMed] [Google Scholar]