

Abstract
The aim of this study was to assess the influence of different object locations in different fields of view (FOVs) of two cone beam CT (CBCT) systems on trabecular bone microstructure measurements of a human mandible. A block of dry human mandible was scanned at five different locations (centre, left, right, anterior and posterior) using five different FOVs of two CBCT systems (NewTom™ 5G; QR Verona, Verona, Italy and Accuitomo 170; Morita, Kyoto, Japan). Image analysis software (CTAn software v. 1.1; SkyScan, Kontich, Belgium) was used to assess the trabecular bone microstructural parameters (thickness, Tb.Th; spacing, Tb.Sp; number, Tb.N; bone volume density, BV/TV). All measurements were taken twice by one trained observer. Tb.Th, Tb.Sp and Tb.N varied significantly across different FOVs in the NewTom 5G (p < 0.001) and the Accuitomo 170 (p < 0.001). For location, a significant difference was observed only when measuring BV/TV (p = 0.03) using the NewTom 5G. The trabecular bone microstructural measurements obtained from CBCT systems are influenced by the size of FOVs. Not all trabecular bone parameters measured using different CBCT systems are affected when varying the object location within the FOVs.
Keywords: cone beam CT, trabecular bone, diagnostic imaging, mandible
Introduction
The three-dimensional (3D) images of cone beam CT (CBCT) have been widely used to assess bone quality. Trabecular bone microstructures are amongst the suggested bone quality parameters that may predict the success of a dental implant.1 This is because it determines not only bone strength2 but also the implant-bone integration, bone healing and primary implant stability.3,4 However, clinical application of CBCT in microstructural assessment is still rare owing to the limitations of the system.5
Previous studies have reported the inconsistencies of CBCT measurements. The location of an object within the field of view (FOV),6,7 technical specifications of individual systems and imaging parameters have been described as part of the underlying factors.7,8 Additionally, X-ray scattering and image artefacts9,10 in CBCT systems may influence density assessments.11,12 The inherent artefacts of the system, such as object truncation in a limited FOV, could also result in deviations of the measurements. These factors introduce overestimation of image density13 and increased linear measurement at the periphery than the central region of the FOV of the CBCT.13,14 The verification of the measurement derived from CBCT images is therefore important to ensure accurate pre-surgical analyses15 such as in implant-guided surgery.16 Thus, clinicians should be well informed about the magnitude of measurement deviations when using CBCT as an image diagnostic tool.
Recently, the reliability and accuracy of CBCT for trabecular microstructural assessment has been reported.17 However, studies on the influence of scanning parameters (FOVs, object locations and scanning protocols) on trabecular microstructural assessment are suggested before advocating CBCT for clinical practice. Unlike the trabecular microstructural measurements, the influence of the location of an object in the FOV of CBCT on bone density7 and linear measurements14 has been largely studied. Therefore, this study aims to assess the influence of different object locations within different FOVs of two CBCT systems on the trabecular bone microstructure measurements of a human mandible.
Methods and materials
Image acquisitions
A dry human mandible was obtained from the Department of Oral and Maxillofacial Radiology, Academic Center for Dentistry Amsterdam, Amsterdam, Netherlands, and approved for research purpose. A bone block of 1-cm thickness was sectioned from the edentulous first left molar region (Figure 1). The block was scanned by two CBCT systems (NewTom™ 5G; QR Verona, Verona, Italy, and Accuitomo 170; Morita, Kyoto, Japan) using the exposure protocols set by the manufacturer of each system for each selected FOV. The Accuitomo system operated at 90 kVp and 5 mA with an exposure time of 17.5 s. The selected scan protocol used was standard resolution mode and full rotation steps to reduce the scan time while maintaining adequate image quality. The block was scanned at five different locations (centre, left, right, anterior and posterior), as shown in Figure 2. Five different scan FOVs were used. The voxel size for 4 × 4 cm, 6 × 6 cm and 8 × 8 cm FOV was 80 μm, 125 μm and 160 μm, respectively. The voxel size was constant at 250 μm when a bigger FOV was used (10 × 10 cm and 14 × 5 cm). For NewTom 5G, the system operated at 110 kVp and 0.57 mA with an exposure time of 18 s. The selected scan protocol for NewTom 5G was normal resolution mode, regular scan time and standard dose. High-resolution mode is the only option for 6 × 6 cm FOV scan view (0.95 mA). The bone block was again scanned at five different locations (centre, left, right, anterior and posterior) using five FOVs (6 × 6 cm, 8 × 8 cm, 12 × 8 cm, 15 × 12 cm and 18 × 16 cm). The voxel size was 150 μm for the 6 × 6 cm FOV, 250 μm for 8 × 8 cm and 300 μm for the 12 × 8 cm and the rest of the tested FOVs. The block was fixed and placed on a platform parallel to the horizontal plane for all scans. To avoid any artefact from partial object effects, the block was positioned within the FOV. In total, 50 scan data sets were produced.
Figure 1.
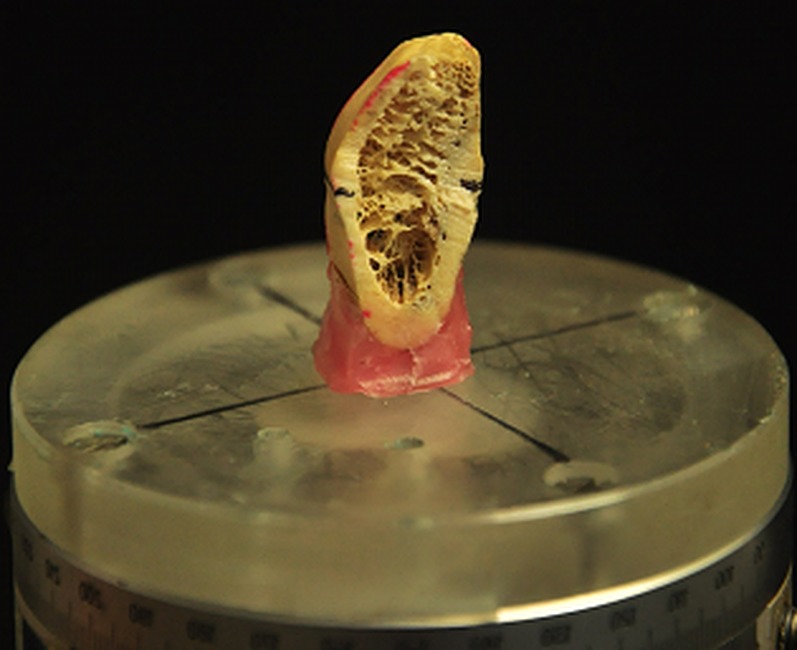
A bone block was fixed and placed on a platform parallel to the horizontal plane for cone beam CT scans.
Figure 2.

The bone block was scanned at five different locations within the field of view of the cone beam CT system. A, anterior; C, centre; L, left; P, posterior; R, right.
Image processing
The resultant images were formatted as Digital Imaging and Communication in Medicine 3 files and exported into Amira® analysis software (Amira® v. 4.2.1; Visage Imaging Inc., Carlsbad, CA). In Amira software, 3D isosurfaces were created and saved as Standard Triangulation Language files. All 3D data sets were superimposed on a reference standard data set (4 × 4 cm or 6 × 6 cm FOV) to provide maximum alignment for cropping and matching of the original volumes (voxel data) of all compared images (Figure 3). For images obtained by Accuitomo 170, the selection of the region of interest (ROI) corresponded to the centre region of the 4 × 4 cm FOV. For NewTom 5G, the ROI corresponded to the centre region of the 6 × 6 cm FOV. All ROIs were exported as 16-bitmap image files to CTAn trabecular bone analysis software v. 1.11 (SkyScan, Kontich, Belgium) to compare the measurements for trabecular thickness (Tb.Th), trabecular spacing (Tb.Sp), trabecular number (Tb.N) and bone volume density (BV/TV).
Figure 3.
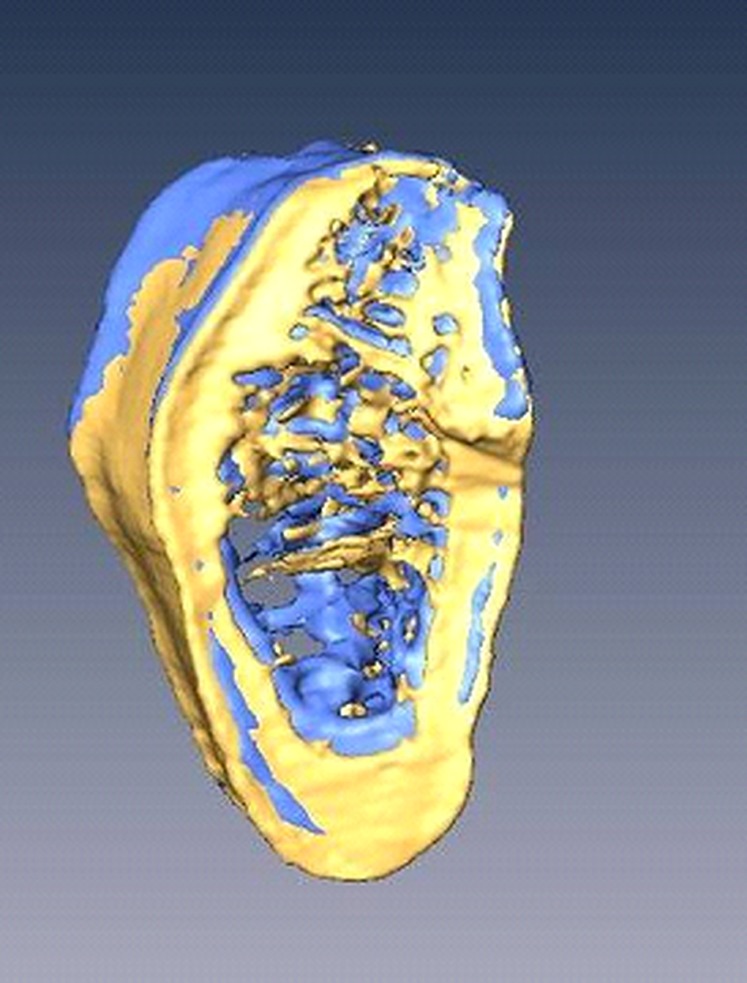
Accuitomo 170 (Morita, Kyoto, Japan) data set obtained from two different fields of view was superimposed in Amira® software (Visage Imaging Inc., Carlsbad, CA).
To ensure that the measurements are derived from the same “anatomical slice”, the 4 × 4 cm (Accuitomo 170) and 6 × 6 cm (NewTom 5G) FOV images were used as the reference standard to select a smaller ROI confined only to trabecular bone in the CTAn software. An automated thresholding value based on histogram analysis was used to separate bone trabeculae from marrow spaces and image background. Subsequently, the images were binarized to allow the trabecular measurement process (Figure 4). All measurements in CTAn were performed twice with a 1-week interval by one trained maxillofacial radiologist with more than 5 years' experience in evaluating CBCT images. In addition, the observer had 3 years' experience in assessing trabecular microstructure using the tested CBCT systems and image analysis software.
Figure 4.

A region of interest was selected (a) and binarized (b) prior to trabecular microstructure measurement in CTAn software (SkyScan, Kontich, Belgium).
Statistical analysis
The parameters that were used to observe the effect of different locations on the trabecular bone microstructural measurements were Tb.Th, Tb.Sp, Tb.N and BV/TV. Intraclass correlation coefficients (ICCs) were used to analyse the intraobserver reliability in reproducing the measurements. One-way ANOVA was conducted to compare the microstructure parameters among the five FOVs and among the five locations. Bonferroni tests were used as a post-hoc procedure. Finally, Pearson's correlation coefficient was used to observe the relation between the parameters. A significance level of 1% was used.
Results
The intraobserver reliability for trabecular bone microstructure measurements was excellent for the NewTom 5G (ICC for Tb.Th was 0.95; Tb.N, 0.96; and Tb.Sp, 0.95) and Accuitomo 170 (ICC for Tb.Th was 0.97; Tb.N, 0.96; Tb.Sp, 0.89; and BV/TV, 0.87). However, the reliability was moderate when measuring BV/TV using NewTom 5G (ICC, 0.79). Hence, the average measurement was used for the next analyses. Table 1 shows the mean and standard deviations of microstructural measurements in different sizes of FOVs. Table 2 shows a significant difference in Tb.Th [F = 73.20, degrees of freedom 1 (df1) = 4, df2 = 20, p = 0.000], Tb.Sp (F = 14.87, df1 = 4, df2 = 20, p = 0.000) and Tb.N (F = 23.90, df1 = 4, df2 = 20, p = 0.000) for the NewTom 5G between different FOVs. The difference was also significant for the Accuitomo 170 in Tb.Th (F = 45.09, df1 = 4, df2 = 20, p = 0.000), Tb.Sp (F = 7.16, df1 = 4, df2 = 20, p = 0.000) and Tb.N (F = 11.86, df1 = 4, df2 = 20, p = 0.000). There was no significant difference when measuring BV/TV (p ≥ 0.289) by both systems using different FOVs. Table 3 shows the microstructures measured at different locations within the FOVs of CBCTs. There was a significant difference for the NewTom 5G in BV/TV (F = 3.48, df1 = 4, df2 = 20, p = 0.03) between different scanning locations. Pearson's correlation coefficients are strong and statistically significant (Table 4) between Tb.Th, Tb.Sp and Tb.N in the NewTom 5G (r > ±0.85). For Accuitomo 170, the correlation between the microstructural parameters was moderate (r > ±0.57). BV/TV was correlated with Tb.N (r = 0.59, p = 0.002) for the NewTom 5G but also correlated with Tb.Sp for the Accuitomo 170 (r = −0.67, p = 0.003).
Table 1.
The mean and standard deviations (SDs) of the trabecular microstructural parameters in different fields of view (FOVs) of cone beam CT (CBCT) systems
| CBCT system | FOV (cm) | Voxel size (µm3) | Tb.Th |
Tb.Sp |
Tb.N |
BV/TV |
||||
|---|---|---|---|---|---|---|---|---|---|---|
| Mean | SD | Mean | SD | Mean | SD | Mean | SD | |||
| NewTom 5G™ | 6 × 6 | 150 | 7.83 | 0.09 | 13.23 | 0.28 | 0.38 | 0.01 | 30.52 | 0.67 |
| 8 × 8 | 250 | 9.33 | 0.16 | 14.48 | 0.57 | 0.31 | 0.01 | 29.53 | 0.84 | |
| 12 × 8 | 250 | 11.15 | 0.10 | 18.27 | 0.95 | 0.26 | 0.01 | 29.33 | 1.44 | |
| 15 × 12 | 300 | 11.51 | 0.23 | 20.29 | 1.26 | 0.24 | 0.02 | 26.22 | 2.02 | |
| 18 × 16 | 300 | 11.91 | 0.33 | 20.45 | 0.90 | 0.25 | 0.01 | 29.92 | 1.77 | |
| Accuitomo 170 | 4 × 4 | 80 | 6.08 | 0.26 | 12.73 | 0.29 | 0.47 | 0.03 | 28.32 | 2.88 |
| 6 × 6 | 125 | 6.72 | 0.18 | 13.86 | 0.46 | 0.45 | 0.05 | 23.27 | 2.17 | |
| 8 × 8 | 160 | 7.55 | 0.25 | 14.18 | 0.32 | 0.36 | 0.02 | 25.39 | 1.93 | |
| 10 × 10 | 250 | 9.82 | 0.22 | 15.98 | 0.56 | 0.25 | 0.03 | 22.08 | 2.19 | |
| 14 × 5 | 250 | 9.74 | 0.35 | 17.34 | 1.28 | 0.24 | 0.03 | 23.20 | 3.12 | |
The trabecular microstructural parameters: BV/TV, bone volume density; Tb.N, trabecular number; Tb.Sp, trabecular spacing; Tb.Th, trabecular thickness.
NewTom 5G is manufactured by QR Verona, Verona, Italy and Accuitomo 170 by Morita, Kyoto, Japan.
Table 2.
Results of the post-hoc procedure testing the differences in fields of view (FOVs)
| Tb.Th |
Tb.Sp |
Tb.N |
||||||||||||||||||||||||||||
|---|---|---|---|---|---|---|---|---|---|---|---|---|---|---|---|---|---|---|---|---|---|---|---|---|---|---|---|---|---|---|
| NewTom™ 5G |
Accuitomo 170 |
NewTom 5G |
Accuitomo 170 |
NewTom 5G |
Accuitomo 170 |
|||||||||||||||||||||||||
| FOV | 1 | 2 | 3 | 4 | 5 | 1 | 2 | 3 | 4 | 5 | 1 | 2 | 3 | 4 | 5 | 1 | 2 | 3 | 4 | 5 | 1 | 2 | 3 | 4 | 5 | 1 | 2 | 3 | 4 | 5 |
| 1 | * | * | * | * | – | * | * | * | – | * | * | * | – | – | * | * | * | * | * | * | – | – | * | * | ||||||
| 2 | * | * | * | * | – | – | * | * | – | – | * | * | – | – | – | * | * | – | * | * | – | – | * | * | ||||||
| 3 | * | * | – | – | * | – | * | * | * | – | – | – | – | – | – | * | * | – | – | – | – | – | – | – | ||||||
| 4 | * | * | – | – | * | * | * | – | * | * | – | – | * | – | – | – | * | * | – | – | * | * | – | – | ||||||
| 5 | * | * | – | – | * | * | * | – | * | * | – | – | * | * | * | – | * | * | – | – | * | * | – | – | ||||||
*, Difference is significant at p < 0.05; –, no significant difference; Tb.N, trabecular number; Tb.Sp, trabecular spacing; Tb.Th, trabecular thickness.
NewTom 5G is manufactured by QR Verona, Verona, Italy and Accuitomo 170 by Morita, Kyoto, Japan.
NewTom 5G: FOV 1 = 6 × 6, 2 = 8 × 8, 3 = 12 × 8, 4 = 15 × 12, 5 = 18 × 16.
Accuitomo 170: FOV 1 = 4 × 4, 2 = 6 × 6, 3 = 8 × 8, 4 = 10 × 10, 5 = 14 × 5.
Table 3.
The mean and standard deviations (SDs) of the trabecular microstructural parameters measured at different object locations in the field of views of cone beam CT (CBCT) systems
| CBCT system | Object location | Tb.Th |
Tb.Sp |
Tb.N |
BV/TV |
||||
|---|---|---|---|---|---|---|---|---|---|
| Mean | SD | Mean | SD | Mean | SD | Mean | SD | ||
| NewTom™ 5G | Centre | 9.87 | 0.62 | 14.47 | 0.82 | 0.32 | 0.03 | 31.69 | 0.98 |
| Left | 10.48 | 0.85 | 18.59 | 1.66 | 0.29 | 0.03 | 29.63 | 1.56 | |
| Right | 10.45 | 0.87 | 18.02 | 1.85 | 0.28 | 0.03 | 27.59 | 1.70 | |
| Anterior | 10.72 | 0.86 | 18.24 | 1.69 | 0.29 | 0.02 | 30.67 | 0.64 | |
| Posterior | 10.23 | 0.69 | 17.40 | 1.51 | 0.26 | 0.03 | 25.94 | 1.05 | |
| Accuitomo 170 | Centre | 7.62 | 0.66 | 15.59 | 1.51 | 0.39 | 0.08 | 23.52 | 3.48 |
| Left | 7.78 | 0.82 | 15.11 | 0.78 | 0.32 | 0.05 | 21.71 | 2.04 | |
| Right | 8.15 | 0.93 | 14.32 | 0.92 | 0.37 | 0.05 | 24.61 | 2.75 | |
| Anterior | 8.10 | 0.80 | 14.09 | 0.94 | 0.35 | 0.05 | 26.93 | 2.75 | |
| Posterior | 8.27 | 0.79 | 14.99 | 0.84 | 0.34 | 0.06 | 25.51 | 3.09 | |
The trabecular microstructural parameters: BV/TV, bone volume density; Tb.N, trabecular number; Tb.Sp, trabecular spacing; Tb.Th, trabecular thickness.
NewTom 5G is manufactured by QR Verona, Verona, Italy and Accuitomo 170 by Morita, Kyoto, Japan.
Table 4.
Correlation coefficients and p-values (bracketed) of the trabecular bone microstructural parameters in cone beam CT (CBCT) systems
| CBCT systems | Parameters | Tb.Sp | Tb.N | BV/TV |
|---|---|---|---|---|
| NewTom™ 5G | Tb.Th | 0.93 (0.001)a | −0.89 (0.001)a | −0.19 (0.354) |
| Tb.Sp | −0.88 (0.001)a | −0.38 (0.061) | ||
| Tb.N | 0.59 (0.002)a | |||
| Accuitomo 170 | Tb.Th | 0.58 (0.002)a | −0.71 (0.001)a | −0.55 (0.793) |
| Tb.Sp | −0.78 (0.001)a | −0.67 (0.001)a | ||
| Tb.N | 0.57 (0.003)a |
The trabecular bone microstructural parameters: BV/TV, bone volume density; Tb.N, trabecular number; Tb.Sp, trabecular spacing; Tb.Th, trabecular thickness.
NewTom 5G is manufactured by QR Verona, Verona, Italy and Accuitomo by Morita, Kyoto, Japan.
Correlation is significant at the 0.01 level.
Discussion
The evaluation of trabecular microstructure can only be achieved by means of high-resolution modalities (100–500 μm).18 In this study, CBCT systems with scanning resolutions ranging from 80 to 300 µm were used to evaluate the variations of trabecular parameters of a human mandible. The present study replicates a clinical situation when a CBCT scan is used to evaluate bone quality of multiple implant sites on a human mandible. Different locations of the ROIs (anterior, posterior, left and right) were simulated by placing the bone block at the centre and the periphery regions within the FOV of the CBCT (Figure 2).
The FOV of the CBCT has been reported as one of the scanning parameters that affect the measurement accuracy of 3D surface models,19 linear bone measurements14 and bone densities.7,8 In this study, measurement variations were observed using five FOV sizes in NewTom 5G and Accuitomo 170 separately. Similar to high-resolution peripheral CT20 and multislice CT21 studies, microstructural parameter variations were also observed in this study (Table 1). There was a significant difference in the measurements according to the FOV size specific to the type of system (Table 2). Among the technical factors that associate with the FOV size are the voxel size,19 contrast-to-noise ratio (CNR)22 and image artefacts. A small voxel size23 in a small FOV24 is generally recommended to improve diagnostic accuracy. Previous studies have described that measurement variations can be owing to the increased image artefacts specifically in the smaller FOV.19,22 Also, an image with a bigger voxel and a higher CNR can have a higher resolution than an image composed of smaller voxels with a lower CNR.23 Consequently, while the selection of FOV is dependent on the interest of the diagnostic task, the clinician should be alert on the deviation of trabecular measurements when using different FOV sizes.
A pattern of measurement fluctuations was observed between the centre and the periphery regions (Table 3), which are subject to the type of system. The increased scattering radiation at the centre region of the FOV of the CBCT was suggested to be because of the increased beam intensity in this region.25 The non-uniformity of the beam intensity caused inconsistency of grey values within the CBCT FOV, in which it was relatively higher at the centre than the periphery regions. The combination of these artefacts was further described as compromising the effective resolution of the system.26 Likewise, the present study observed an inconsistency in measuring BV/TV when using NewTom 5G. The images in large FOVs of the NewTom 5G (voxel size of 300 μm) are more pixelated than those from the large FOVs of the Accuitomo 170 (voxel size of 250 μm). Thus, some deviations occurred when reproducing the ROI on images of larger FOVs in the NewTom 5G. Bouxsein et al27 described that the trabecular bone volume of the ROI that is closer to the cortical bone may be higher than the ROI that is a few pixels away from the cortical surface. Despite the challenge, only reliability of BV/TV in the NewTom 5G was moderate (ICC, 0.79), whereas other parameters showed strong reliability (ICC ≥ 0.87). In addition, the truncation artefact in CBCT systems increases the grey value of the periphery regions (i.e. near to the object that was placed outside of the FOV).6 These artefacts occur when the scanned object is larger than the size of the FOV. Clinically, the image diagnostic accuracy may be compromised when a small FOV is selected for a high-resolution image and low-exposure dose. Therefore, although CBCT has been reported as a reliable tool for assessing bone quality (linear measurement14 and trabecular microstructure17), the measurement deviation caused by the inherent limitations of the systems should be well acknowledged.
The trabecular parameters correlate differently in different systems (Table 4). The correlations within and between the systems are expected to differ because of the differences in the selected scanning protocols28 and the technology utilized in each system.26 Similar to the previous studies,17,29 Tb.N was negatively correlated with Tb.Th and Tb.Sp. However, this could also be because of the automatic thresholding method that was applied in this study, which could possibly overestimate one parameter (e.g. Tb.Th) while underestimating the other parameter (e.g. Tb.N). Thresholding is in turn affected by the histogram distribution of grey values, which, as has been previously established, dependent on scanning locations and voxel size.7,14 To reduce the bias derived from various bone densities,17,19 only one bone block was used to evaluate the effect of scanning FOV and locations. Since only one measurement was obtained from each combination protocol (FOV and object location), the interaction between the two variables could not be statistically analysed and is a limitation of the present study. When multiple implant sites are pre-operatively assessed for quantity and quality of the available bone, it should be emphasized that the obtained measurements could vary according to the location of the implant site in the selected scan FOV.
In this study, an average of 30 min was spent to analyse bone quality of multiple implant sites on one CBCT scan. The procedure includes exporting the data set to the database and importing them to the analysis software to perform the segmentation and trabecular analysis. In the near future, the ubiquitous availability of advanced analysis software and increased computing power might shorten the time to less than 5 min to complete the trabecular microstructural analysis.
Conclusion
This study suggests that the trabecular bone microstructural measurements obtained from CBCT systems are influenced by the size of the FOV. However, the trabecular bone parameters are affected differently when varying the object location within the FOV of different CBCT systems. Consequently, the FOV, location of the scanned object and the type of the CBCT system should be considered as the influencing factors, which may compromise the clinical evaluation of trabecular microstructural assessment.
References
- 1.Fanuscu MI, Chang TL. Three-dimensional morphometric analysis of human cadaver bone: microstructural data from maxilla and mandible. Clin Oral Implants Res 2004; 15: 213–18. [DOI] [PubMed] [Google Scholar]
- 2.Manske SL, Macdonald HM, Nishiyama KK, Boyd SK, McKay HA. Clinical tools to evaluate bone strength. Clin Rev Bone Miner Metab 2010; 8: 122–34. [Google Scholar]
- 3.Minkin C, Marinho VC. Role of the osteoclast at the bone-implant interface. Adv Dent Res 1999; 13: 49–56. [DOI] [PubMed] [Google Scholar]
- 4.Sakka S, Coulthard P. Bone quality: a reality for the process of osseointegration. Implant Dent 2009; 18: 480–5. doi: 10.1097/ID.0b013e3181bb840d [DOI] [PubMed] [Google Scholar]
- 5.Ibrahim N, Parsa A, Hassan B, van der Stelt P, Wismeijer D. Diagnostic imaging of trabecular bone microstructure for oral implants: a literature review. Dentomaxillofac Radiol 2013; 42: 20120075. doi: 10.1259/dmfr.20120075 [DOI] [PMC free article] [PubMed] [Google Scholar]
- 6.Bryant JA, Drage NA, Richmond S. Study of the scan uniformity from an i-CAT cone beam computed tomography dental imaging system. Dentomaxillofac Radiol 2008; 37: 365–74. doi: 10.1259/dmfr/13227258 [DOI] [PubMed] [Google Scholar]
- 7.Nackaerts O, Maes F, Yan H, Couto Souza P, Pauwels R, Jacobs R. Analysis of intensity variability in multislice and cone beam computed tomography. Clin Oral Implants Res 2011; 22: 873–9. doi: 10.1111/j.1600-0501.2010.02076.x [DOI] [PubMed] [Google Scholar]
- 8.Parsa A, Ibrahim N, Hassan B, Motroni A, van der Stelt P, Wismeijer D. Influence of cone beam CT scanning parameters on grey value measurements at an implant site. Dentomaxillofac Radiol 2013; 42: 79884780. doi: 10.1259/dmfr/79884780 [DOI] [PMC free article] [PubMed] [Google Scholar]
- 9.Maes F, Collignon A, Vandermeulen D, Marchal G, Suetens P. Multimodality image registration by maximization of mutual information. IEEE Trans Med Imaging 1997; 16: 187–98. doi: 10.1109/42.563664 [DOI] [PubMed] [Google Scholar]
- 10.Rinkel J, Gerfault L, Estève F, Dinten JM. A new method for x-ray scatter correction: first assessment on a cone-beam CT experimental setup. Phys Med Biol 2007; 52: 4633–52. doi: 10.1088/0031-9155/52/15/018 [DOI] [PubMed] [Google Scholar]
- 11.Cann CE. Quantitative CT for determination of bone mineral density: a review. Radiology 1988; 166: 509–22. doi: 10.1148/radiology.166.2.3275985 [DOI] [PubMed] [Google Scholar]
- 12.Draenert FG, Coppenrath E, Herzog P, Müller S, Mueller-Lisse UG. Beam hardening artefacts occur in dental implant scans with the NewTom cone beam CT but not with the dental 4-row multidetector CT. Dentomaxillofac Radiol 2007; 36: 198–203. doi: 10.1259/dmfr/32579161 [DOI] [PubMed] [Google Scholar]
- 13.Nithiananthan S, Schafer S, Uneri A, Mirota DJ, Stayman JW, Zbijewski W, et al. Demons deformable registration of CT and cone-beam CT using an iterative intensity matching approach. Med Phys 2011; 38: 1785–98. [DOI] [PMC free article] [PubMed] [Google Scholar]
- 14.Tsutsumi K, Chikui T, Okamura K, Yoshiura K. Accuracy of linear measurement and the measurement limits of thin objects with cone beam computed tomography: effects of measurement directions and of phantom locations in the fields of view. Int J Oral Maxillofac Implants 2011; 26: 91–100. [PubMed] [Google Scholar]
- 15.Lascala CA, Panella J, Marques MM. Analysis of the accuracy of linear measurements obtained by cone beam computed tomography (CBCT-NewTom). Dentomaxillofac Radiol 2004; 33: 291–4. doi: 10.1259/dmfr/25500850 [DOI] [PubMed] [Google Scholar]
- 16.Yu JJ, Kim GT, Choi YS, Hwang EH, Paek J, Kim SH, et al. Accuracy of a cone beam computed tomography-guided surgical stent for orthodontic mini-implant placement. Angle Orthod 2012; 82: 275–83. doi: 10.2319/060811-374.1 [DOI] [PMC free article] [PubMed] [Google Scholar]
- 17.Ibrahim N, Parsa A, Hassan B, van der Stelt P, Aartman IH, Wismeijer D. Accuracy of trabecular bone microstructural measurement at planned dental implant sites using cone-beam CT datasets. Clin Oral Implants Res Apr 2013. Epub ahead of print. doi: 10.1111/clr.12163 [DOI] [PubMed] [Google Scholar]
- 18.Choël L, Last D, Duboeuf F, Seurin MJ, Lissac M, Briguet A, et al. Trabecular alveolar bone microarchitecture in the human mandible using high resolution magnetic resonance imaging. Dentomaxillofac Radiol 2004; 33: 177–82. doi: 10.1259/dmfr/42933309 [DOI] [PubMed] [Google Scholar]
- 19.Hassan B, Couto Souza P, Jacobs R, de Azambuja Berti S, van der Stelt P. Influence of scanning and reconstruction parameters on quality of three-dimensional surface models of the dental arches from cone beam computed tomography. Clin Oral Investig 2010; 14: 303–10. doi: 10.1007/s00784-009-0291-3 [DOI] [PMC free article] [PubMed] [Google Scholar]
- 20.Tjong W, Kazakia GJ, Burghardt AJ, Majumdar S. The effect of voxel size on high-resolution peripheral computed tomography measurements of trabecular and cortical bone microstructure. Med Phys 2012; 39: 1893–903. doi: 10.1118/1.3689813 [DOI] [PMC free article] [PubMed] [Google Scholar]
- 21.Klink T, Regier M, van Stevendaal U, Grass M, Adam G, Begemann P. Accelerating image acquisition in 64-MDCT: the influence of scan parameters on image resolution and quality in a phantom study. Clin Imaging 2012; 36: 334–44. doi: 10.1016/j.clinimag.2011.11.006 [DOI] [PubMed] [Google Scholar]
- 22.Bechara B, McMahan CA, Moore WS, Noujeim M, Geha H, Teixeira FB. Contrast-to-noise ratio difference in small field of view cone beam computed tomography machines. J Oral Sci 2012; 54: 227–32. [DOI] [PubMed] [Google Scholar]
- 23.Vandenberghe B, Luchsinger S, Hostens J, Dhoore E, Jacobs R, SEDENTEXCT Project Consortium. The influence of exposure parameters on jawbone model accuracy using cone beam CT and multislice CT. Dentomaxillofac Radiol 2012; 41: 466–74. doi: 10.1259/dmfr/81272805 [DOI] [PMC free article] [PubMed] [Google Scholar]
- 24.Librizzi ZT, Tadinada AS, Valiyaparambil JV, Lurie AG, Mallya SM. Cone-beam computed tomography to detect erosions of the temporomandibular joint: effect of field of view and voxel size on diagnostic efficacy and effective dose. Am J Orthod Dentofacial Orthop 2011; 140: e25–30. doi: 10.1016/j.ajodo.2011.03.012 [DOI] [PubMed] [Google Scholar]
- 25.Hunter AK, McDavid WD. Characterization and correction of cupping effect artefacts in cone beam CT. Dentomaxillofac Radiol 2012; 41: 217–23. doi: 10.1259/dmfr/19015946 [DOI] [PMC free article] [PubMed] [Google Scholar]
- 26.Schulze R, Heil U, Gross D, Bruellmann DD, Dranischnikow E, Schwanecke U, et al. Artefacts in CBCT: a review. Dentomaxillofac Radiol 2011; 40: 265–73. doi: 10.1259/dmfr/30642039 [DOI] [PMC free article] [PubMed] [Google Scholar]
- 27.Bouxsein ML, Boyd SK, Christiansen BA, Guldberg RE, Jepsen KJ, Müller R. Guidelines for assessment of bone microstructure in rodents using micro-computed tomography. J Bone Miner Res 2010; 25: 1468–86. doi: 10.1002/jbmr.141 [DOI] [PubMed] [Google Scholar]
- 28.Ibrahim N, Parsa A, Hassan B, van der Stelt P, Aartman IH, Wismeijer D. The effect of scan parameters on cone beam CT trabecular bone microstructural measurements of the human mandible. Dentomaxillofac Radiol 2013; 42: 20130206. doi: 10.1259/dmfr.20130206 [DOI] [PMC free article] [PubMed] [Google Scholar]
- 29.Wirth AJ, Müller R, van Lenthe GH. The discrete nature of trabecular bone microarchitecture affects implant stability. J Biomech 2012; 45: 1060–7. doi: 10.1016/j.jbiomech.2011.12.024 [DOI] [PubMed] [Google Scholar]