

Abstract
Recent advances in spatial statistics and geographic information systems provide innovative platforms for diagnosing environmental health problems and for developing interventions. This article discusses when and where spatial techniques can most effectively be deployed to address environmental health issues, especially as they relate to environmental justice concerns.
Many health outcomes are shaped by multiple and interacting factors, including social, environmental, and host-factor influences. Current intervention programs and supporting databases are not designed to make the connections between contributing factors and to provide an integrated approach to environmental health research and practice. These limitations hamper our ability to disentangle the complex etiologies of environmental health concerns—often restricting our progress in addressing environmental justice issues. By integrating multifactoral components into a comprehensive model, geographic information systems (GIS) technology and spatial statistics facilitate innovative strategies for improving environmental and public health.
The key to spatial analysis is that most data contain a geographic component that can be tied to a specific location, such as a state, county, zip code, census block, or single address, as well as to more ecologically oriented geographic features, such as a watershed, airshed, floodplain, and riparian zone. Geographic analysis enables users to explore and overlay data by location, revealing hidden trends that are not readily apparent in traditional spreadsheet and statistical packages. GIS allows for the construction of space (and space-time) data architectures that can then be analyzed with either spatial or aspatial statistics. Analytical results can then be displayed in GIS, to enhance ease of interpretation. Additionally, GIS contains advanced capabilities to generate clear and accessible maps and data reports that can serve as powerful tools for research, outreach, and policy design.
The literature on the use of GIS and spatial statistics in addressing environmental health is extensive and growing rapidly [1–4]. In this article, we discuss 3 North Carolina–based applications that demonstrate the power of GIS and spatial analysis in advancing research, conducting community outreach, and shaping policy design.
GIS, Spatial Analysis, and Research
Researchers have used GIS and spatial statistics in a variety of environmental health applications, including air quality, water quality, pesticide exposures, vector control, and the built environment [1, 3–7]. One key question that often emerges in environmental health research is how to link health outcomes with exposure data. As long as the health outcome data include some geographic reference, GIS allows for the linkage of outcome and exposure data via shared geography. For example, Figure 1 shows the Environmental Protection Agency’s (EPA’s) Air Quality System (AQS) particulate-matter monitors in the Charlotte, North Carolina, metropolitan area. AQS monitors are located across the country and collect data on ambient levels of the 6 criteria air pollutants: carbon monoxide, lead, nitrogen dioxide, particulate matter, ozone, and sulfur dioxide. Exposure to criteria air pollutants can adversely affect health; thus, the EPA regulates these pollutants, using the AQS monitoring data to determine areas that are out of compliance with established standards [8].
FIGURE 1.
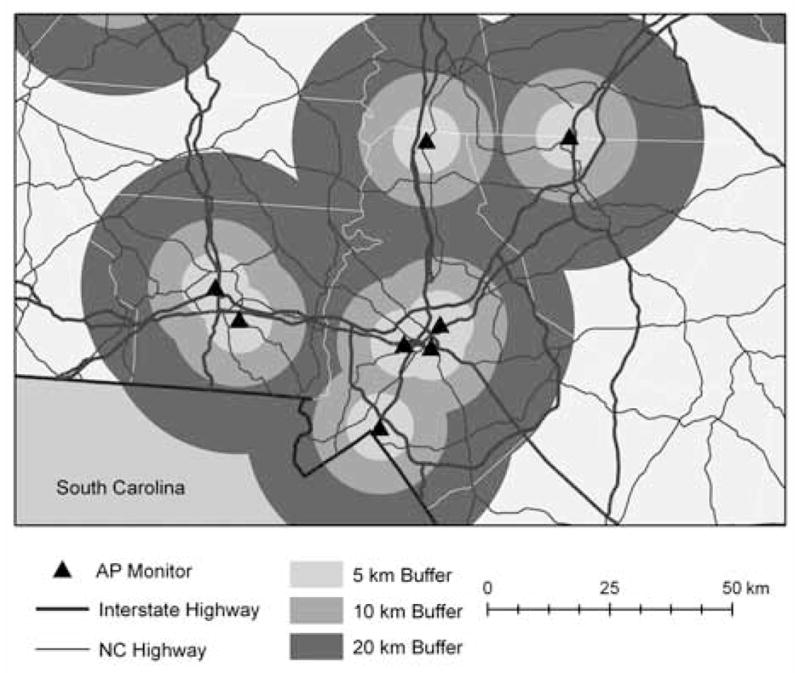
Air Quality Monitors in the Charlotte, North Carolina, Metropolitan Area, With Radial Buffers and Major Roadways
In Figure 1, we construct 5-, 10-, and 20-km radial buffers around each of the active monitors. If clinical or vital records data are spatially referenced, the intersection between locations associated with health outcomes and the radial buffers can be calculated. This allows researchers to link the health outcome data spatially and temporally with the monitoring data. The appropriate size of the radial buffer and the temporal scale for the exposure profile depend on the nature of the pollutant and its fate and transport patterns, as well as on the particular health end point under consideration. An alternate measure of exposure to air pollution can be constructed using road network data, which is also displayed in Figure 1. Continuous measures, such as distance to a major roadway, as well as categorical measures, such as locations within a certain number of meters of a major roadway, can both be used to provide a global proxy for exposure to mobile-source emissions. These approaches become especially powerful if data are available on an individual’s residence location, place of work, and commuting patterns. The road network data do not restrict the researcher to locations where active monitoring is occurring, but, of course, they also do not provide an actual measure of ambient air quality.
Figure 1 provides one possible application of GIS in environmental health research, but similar methods are equally relevant for addressing questions such as drift exposure to pesticides, groundwater contamination of well water from industrial activities, surface-water contamination from rainfall-event runoff, and exposure to contaminated sites.
GIS, Spatial Analysis, and Community Outreach
A significant body of recent research has focused on methods for implementing environmental and public health interventions more efficiently, by identifying people at the highest risk for the health effects associated with environmental exposures [3, 9–11]. GIS and spatial analysis are especially helpful for directing community outreach activities, both because they help target interventions and because GIS maps serve as a powerful communication tool in trying to reach communities at risk. For example, a number of analyses have sought to reduce the costs and improve the detection rate of blood-lead screening [12, 13]. These analyses have attempted to target blood-lead screening efforts by identifying the children or groups of children who are at the highest risk of lead exposure.
Figure 2 presents a map of part of New Hanover County, North Carolina. The risk model shown in the map combines county tax assessor data, blood-lead screening data from clinic visits, and US Census data, to create household-level priority models for childhood lead exposure [10, 14]. The darker the color of a given tax-parcel polygon, the higher the relative risk for exposure to lead. The model depicted in Figure 2 was validated by the collection of environmental sampling data, to confirm that locations with high environmental lead samples correspond with areas of high relative risk for lead exposure and, conversely, that low environmental lead samples correspond with areas of low relative risk for lead exposure. The map also shows the location of local community resources that can serve as the venues for launching outreach activities. These models have been used in communities both to direct blood-lead screening programs and to prioritize the expenditure of housing rehabilitation funds.
FIGURE 2.
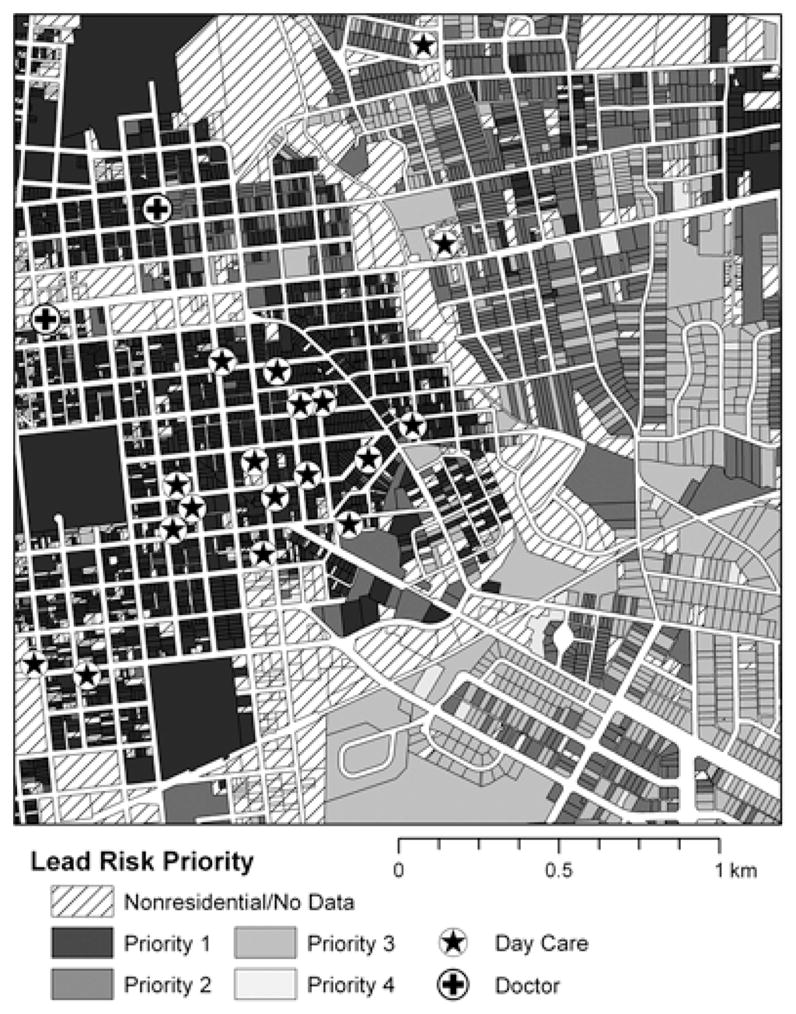
Parcel-Level Modeled Lead Exposure Risk and Relevant Community Resources in New Hanover County, North Carolina
The products of GIS-based statistical analyses can serve as the basis for enhanced communication with local communities. The presentation of voluminous tabular data makes it difficult for community members to make sense of the data and to act on the message of the data in motivating, designing, and implementing public and environmental health interventions. In contrast, GIS maps summarize both data and results of analyses in ways that are accessible and intuitive to community members, even more so now that online mapping applications are commonly used in the daily lives of people of all races and income classes. Thus, the GIS applications strengthen the ability of communities to self-advocate.
GIS, Spatial Analysis, and Policy Design
GIS and spatial statistics can make important contributions to the debate on how, when, and where to implement or change environmental regulatory policies and priorities. Such applications are especially well suited to identifying areas of noncompliance or areas of elevated risk (so-called hotspots), which may highlight the need for policy change or, at the least, environmental investigation. For example, the arsenic concentration in supplies of public drinking water is regulated by the EPA. Arsenic in drinking water has received considerable public attention, with the EPA lowering the arsenic standard for public drinking water in 2001.
Despite known health effects associated with contamination of drinking water, the EPA does not regulate private wells. As groundwater from private wells is still a primary source of drinking water for more than 2 million North Carolina residents [15], understanding which private wells are at risk for potentially high levels of arsenic is a critical environmental and public health concern.
Figure 3 displays the results of a spatial random-effects model designed to predict arsenic levels in groundwater on the basis of geologic and well-construction data. This modeling effort informs policy intervention by creating 3-dimensional maps of predicted arsenic levels in groundwater for any location and at any depth. Spatial analysis like that presented in Figure 3 can serve as the basis for changing EPA regulatory policy on private wells or, more realistically, can help shape state and local policies about encouraging the testing of well water and the potential installation of point-of-use water-treatment systems. Such analysis could also serve as the basis for statewide or national policy, if developed at sufficient geographic scale.
FIGURE 3.
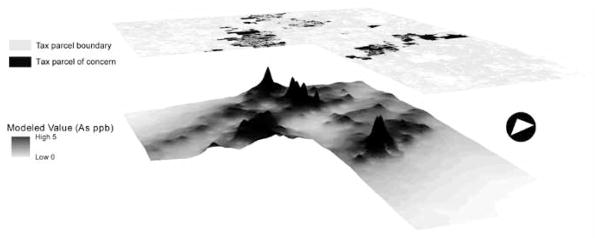
Predicted Arsenic Values in Groundwater Wells >150 Feet Deep
GIS and spatial analysis approaches are equally relevant for a wide range of environmental policy concerns, including near-roadway emissions and exposures, siting of locally unpopular land uses, siting of community resources such as schools and recreational facilities, redevelopment of brownfields, effects of commercial agriculture and animal confinement facilities, and effects of upstream activities on downstream communities.
Concluding Thoughts
Research, community outreach, and policy design all represent substantial opportunities to employ GIS and spatial statistical approaches in public and environmental health. Relevant data sources are wide-ranging and extend to both point and areal data. We can garner important insights by linking the specific location of an individual to an exposure source (point human health data linked to point exposure data), the specific location of an individual to density maps of exposure sources (point human health data linked to areal exposure data), areal rates for disease to a specific exposure source (areal human health data linked to point exposure data), and areal rates for disease with areal exposure surfaces (areal human health data linked to areal exposure data).
Depending on the data resources available, the techniques for exploring and analyzing spatial data range from simple to highly complex. Substantial methodology has been developed to add formal inference to GIS. As a consequence, the opportunities for using GIS and spatial statistics in environmental health research and practice abound.
Environmental justice research and associated environmental justice–based calls for policy change represent areas perhaps most suited to geographic analysis. Spatial analysis and GIS map products provide an analytical basis for evaluating environmental justice claims and serve as powerful communication tools for making environmental justice claims heard in the public arena. GIS maps can be advanced by communities as symbolic representations of the need for change and can be subsequently used to track progress in improving outcomes within disadvantaged communities.
The ease of desktop GIS and the advances in spatial statistics make basic analyses both accessible and meaningful to the larger environmental health research and policy communities. The availability of rich stochastic modeling tools and high-speed computation enables much more insight to be drawn in analyzing spatial and space-time data. In addition, more-advanced techniques, such as exposure surface modeling across space and time, downscaling of modeled output, interpolating across locations, spatial smoothing, and transport modeling, may all contribute to our understanding of the causes and consequences of environmental exposures. GIS and spatial analysis hold tremendous potential to transform how we conceive and conduct environmental health research and how we implement policy interventions.
Acknowledgments
We thank Dana Dolinoy, Alan Gelfand, Simone Gray, Dohyeong Kim, and M. Alicia Overstreet, for collaborating with us on work that serves as the basis for the examples provided in this article, and Nancy Schneider and Joshua Tootoo, for providing geographic information systems support.
Financial support. Environmental Protection Agency (grant RD-83329301), North Carolina Department of Environment and Natural Resources (grant T07095), National Institute of Environmental Health Sciences (grant 1-R21-ES013776-01).
Footnotes
Potential conflicts of interest. M.L.M. and S.E.E. have no relevant conflicts of interest.
Contributor Information
Marie Lynn Miranda, Professor, Nicholas School of the Environment, Duke University, and Department of Pediatrics, Duke University Medical Center, Durham, North Carolina.
Sharon E. Edwards, Associate in research, Nicholas School of the Environment, Duke University, Durham, North Carolina.
References
- 1.Jerrett M, Gale S, Kontgis C. Spatial modeling in environmental and public health research. Int J Environ Res Public Health. 2010;7(4):1302–1329. doi: 10.3390/ijerph7041302. [DOI] [PMC free article] [PubMed] [Google Scholar]
- 2.Jarup L. Health and environment information systems for exposure and disease mapping, and risk assessment. Environ Health Perspect. 2004;112(9):995–997. doi: 10.1289/ehp.6736. [DOI] [PMC free article] [PubMed] [Google Scholar]
- 3.Eisen L, Eisen RJ. Using geographic information systems and decision support systems for the prediction, prevention, and control of vector-borne diseases. Annu Rev Entomol. 2011;56:41–61. doi: 10.1146/annurev-ento-120709-144847. [DOI] [PubMed] [Google Scholar]
- 4.Bergquist R, Rinaldi L. Health research based on geospatial tools: a timely approach in a changing environment. J Helminthol. 2010;84(1):1–11. doi: 10.1017/S0022149X09990484. [DOI] [PubMed] [Google Scholar]
- 5.Hall KS, McAuley E. Individual, social environmental and physical environmental barriers to achieving 10,000 steps per day among older women. Health Educ Res. 2010;25(3):478–488. doi: 10.1093/her/cyq019. [DOI] [PMC free article] [PubMed] [Google Scholar]
- 6.Kaminska IA, Oldak A, Turski WA. Geographical information system (GIS) as a tool for monitoring and analysing pesticide pollution and its impact on public health. Ann Agric Environ Med. 2004;11(2):181–184. [PubMed] [Google Scholar]
- 7.Zhou Y, Levy JI. Factors influencing the spatial extent of mobile source air pollution impacts: a meta-analysis. BMC Public Health. 2007;7:89. doi: 10.1186/1471-2458-7-89. [DOI] [PMC free article] [PubMed] [Google Scholar]
- 8.Technology Transfer Network. Air Quality System. [Accessed May 9, 2011];US Environmental Protection Agency Web site. http://www.epa.gov/ttn/airs/airsaqs/index.htm.
- 9.Nykiforuk CI, Flaman LM. Geographic information systems (GIS) for health promotion and public health: a review. Health Promot Pract. 2011;12(1):63–73. doi: 10.1177/1524839909334624. [DOI] [PubMed] [Google Scholar]
- 10.Kim D, Galeano MA, Hull A, Miranda ML. A framework for widespread replication of a highly spatially resolved childhood lead exposure risk model. Environ Health Perspect. 2008;116(12):1735–1739. doi: 10.1289/ehp.11540. [DOI] [PMC free article] [PubMed] [Google Scholar]
- 11.Choi M, Afzal B, Sattler B. Geographic information systems: a new tool for environmental health assessments. Public Health Nurs. 2006;23(5):381–391. doi: 10.1111/j.1525-1446.2006.00577.x. [DOI] [PubMed] [Google Scholar]
- 12.Reyes NL, Wong L-Y, MacRoy PM, et al. Identifying housing that poisons: a critical step in eliminating childhood lead poisoning. J Public Health Manag Pract. 2006;12(6):563–569. doi: 10.1097/00124784-200611000-00010. [DOI] [PubMed] [Google Scholar]
- 13.Levin R, Brown MJ, Kashtock ME, et al. Lead exposures in US children, 2008: implications for prevention. Environ Health Perspect. 2008;116(10):1285–1293. doi: 10.1289/ehp.11241. [DOI] [PMC free article] [PubMed] [Google Scholar]
- 14.Miranda ML, Dolinoy DC, Overstreet MA. Mapping for prevention: GIS models for directing childhood lead poisoning prevention programs. Environ Health Perspect. 2002;110(9):947–953. doi: 10.1289/ehp.02110947. [DOI] [PMC free article] [PubMed] [Google Scholar]
- 15.Kenny JF, Barber NL, Hutson SS, Linsey KS, Lovelace JK, Maupin MA. Circular. Vol. 1344. Reston, VA: US Geological Survey; 2009. [Accessed May 9, 2011]. Estimated use of water in the United States in 2005. http://pubs.usgs.gov/circ/1344/pdf/c1344.pdf. [Google Scholar]