

Summary
Identifying cellular and molecular differences between human and non-human primates (NHPs) is essential to the basic understanding of the evolution and diversity of our own species. Until now, preserved tissues have been the main source for most comparative studies between humans, chimpanzees (Pan troglodytes) and bonobos (Pan paniscus)1,2. However, these tissue samples do not fairly represent the distinctive traits of live cell behavior and are not amenable to genetic manipulation. We hypothesized that induced pluripotent stem cells (iPSCs) could be a unique biological resource to elucidate relevant phenotypical differences between human and NHPs and that those differences could have potential adaptation and speciation value. Here, we describe the generation and initial characterization of iPSCs from chimpanzees and bonobos as novel tools to explore factors that have contributed to great ape evolution. Comparative gene expression analysis of human and NHP iPSCs revealed differences in the regulation of Long Interspersed Nuclear Element-1 (LINE-1 or L1) transposons. A force of change in mammalian evolution, L1 elements are retrotransposons that have remained active during primate evolution3-5. Decreased levels of L1 restricting factors APOBEC3B (A3B)6 and PIWIL27 in NHP iPSCs correlated with increased L1 mobility and endogenous L1 mRNA levels. Moreover, results from manipulation of A3B and PIWIL2 levels in iPSCs supported a causal inverse relationship between levels of these proteins and L1 retrotransposition. Finally, we found increased copy numbers of species-specific L1 elements in the genome of chimpanzees compared to humans, supporting the idea that increased L1 mobility in NHPs is not limited to iPSCs in culture and may have also occurred in the germline or embryonic cells developmentally upstream to germline specification during primate evolution. We propose that differences in L1 mobility may have differentially shaped the genomes of humans and NHPs and could have ongoing adaptive significance.
Humans, chimpanzees and bonobos are genetically very similar, sharing nearly 98% of their alignable genomic sequence1-3. However, cellular and molecular phenotypes, especially at identical stages of development, are difficult to establish, mainly due to limited access to embryonic material from human and NHPs8. We reprogrammed fibroblasts from two bonobos and two chimpanzees into iPSCs as previously described9,10 (Extended Data Fig. 1a). After culture in human ESC (hESC)-supporting conditions, NHP iPSC colonies could be distinguished by the high nucleus-to-cytoplasm ratio morphology. iPSC clones from both species continuously expressed pluripotency markers, retained undifferentiated morphology in culture, and maintained a normal karyotype (Fig. 1a). After embryoid body (EB)-mediated differentiation in vitro, clones contained tissue derivatives from the three embryonic germ layers and down-regulated expression of pluripotency markers (Fig. 1b). iPSCs selected clones were also able to differentiate into the three embryonic germ layers in vivo as shown by analysis of teratomas in nude mice (Fig. 1c). Together, these data demonstrate that NHP iPSC clones re-established pluripotency at the molecular and cellular levels.
Extended Data Figure 1.

Cell lines used in this study, number of mapped reads per sample in RNA-seq and gene ontology (GO) enrichment analysis for differentially expressed genes. (a) Origin of iPSCs used or generated in this study. (c,d) GO enrichment analysis of differentially expressed genes. (b) Total number of mapped reads per sample in RNA-seq (c) Top 10 enriched GO terms for genes with higher expression in human versus NHP iPSCs. (d) Top 10 enriched GO terms for genes highly expressed in NHP versus human iPSCs. GO analysis was restricted to differentially expressed protein-coding genes (FDR <0.05 and FC >2). GO enrichment for biological processes (level 2) was performed using DAVID. Figure shows GO term, number of genes (count), and p values for EASE score and Benjamini adjustment.
Figure 1. Characterization of iPSCs derived from the three primate species.

(a) Morphology of fibroblasts and iPSCs. No karyotypic abnormalities were observed in iPSCs clones. Immunofluorescence for pluripotency makers, Tra-1-81 and Nanog in iPSCs. Bar = 10 μm. (b). RT-PCR for undifferentiation marker (Nanog) and for the three germ cell layers (Musashi, Brachyury and AFP) in human, chimpanzee and bonobo iPSCs (H, C and B, respectively) and in differentiated embryoid bodies (EBs). (c) Hematoxylin and eosin staining of teratoma sections showing differentiation into three germ layers: goblet cells in gastro-intestinal tract (endo); neuro retinal epithelium (ecto) and muscle and cartilage/bone (meso). Bar = 150 μm.
To gain insight into differences in gene expression between human and NHP iPSCs, we performed RNA-seq analyses on four human, two chimpanzee and two bonobo iPSC lines (Extended Data Fig. 1b). The expression profiles of iPSCs from the three species clustered together with hESCs (HUES6 and H1) and were distinguishable from hESC-derived neural precursor cells (NPCs) (Fig. 2a), chimpanzee and bonobo iPSCs clustered closer to each other than to human iPSCs (Fig. 2a). We then performed pairwise comparisons of protein-coding gene expression levels (Fig. 2b). Venn diagrams represent expressed genes with non-significant differences between species (purple) and up-regulated genes with estimated false discovery rates (FDR) of less than 5% and a fold change greater than 2-fold (pink and blue). Comparison between human and NHP (Fig. 2b bottom-right) revealed 1,376 genes with elevated expression in human iPSCs and 1,042 common genes with elevated expression in NHP iPSCs, whereas no significant differences were observed in 11,585 protein-coding genes. Next, we focused on genes differentially expressed between human and NHP iPSCs (Fig. 2c-e, Extended Data Fig. 1c,d), and found, among the top 50 genes with elevated expression in human iPSCs compared to NHP iPSCs, two genes involved in restriction of L1 retrotransposition, namely A3B and PIWIL2 (Fig. 2d).
Figure 2. RNA-seq profiling of human and NHP iPSCs.

(a) High-throughput sequencing of 14 RNA samples corresponding to four human, two chimp and two bonobo iPSC lines. hESCs (H1 and Hues6, arrowheads) and hESC-derived neural progenitor cells (NPCs). Heat map representation of mapped reads corresponding to protein-coding genes. (b) Venn diagrams showing pairwise comparison of protein-coding genes. Pink and blue: significantly up-regulated genes (FDR<0.05 and fold change>2) Purple: expressed genes with no significant differences in mRNA levels between compared species. (c) Heat map representation of differentially expressed protein-coding genes with FDR<0.05 and FC>2 between human and NHP iPSCs. (d, e) List of the top 50 differentially expressed genes in human iPSCs compared to NHP iPSCs with elevated expression in human iPSCs (d) and elevated expression in NHPs (e). PIWIL2 and APOBEC3 were expressed at significantly higher levels in human iPSCs than in NHP iPSCs (positions 8 and 38 in table d, respectively). Rank, gene name, Logarithmic base 2 fold change (Log FC), and false discovery rates (FDR) are shown.
Active, full-length L1 elements have the ability to move from one location in the genome to another by a copy-paste mechanism called retrotransposition11. Active L1 elements have been detected in both germline and somatic tissues, and can impact genome integrity12,13. As uncontrolled retrotransposition activity can be deleterious to the host14, organisms have evolved mechanisms to control L1 mobility11. A3B is a member of the APOBEC3 family of cytidine deaminases that can inhibit L1 mobility in different cell types, including human embryonic stem cells (hESCs) and iPSCs, via a still unclear mechanism6,15,16. PIWIL2 is an effector of the piRNA pathway involved in L1 silencing mainly in germ line7.
To confirm differences in A3B and PIWIL2 in human versus NHP iPSCs, we first cloned their cDNAs from the three species, and found a high degree of conservation between human and NHPs (Extended Data Fig. 2). Quantification of A3B mRNA levels by qPCR confirmed significantly higher levels (~30-fold) of A3B in both human iPSC lines compared to NHP iPSCs (Fig. 3a). Levels of PIWIL2 mRNA were 16-fold higher in human iPSC lines than in NHP iPSCs (Fig. 3b). PIWIL2-mediated control of transposons is most active in germline and we observed that levels of PIWIL2 mRNA are 20 to 40-fold lower in human iPSCs than in testis (Extended Data Fig. 3a). The increased expression observed in human iPSCs appears to be specifically restricted to A3B and PIWIL2 compared to other members of these protein families (Extended Data Fig. 3b-c). Differences in A3B and PIWIL2 mRNA levels reflected higher A3B and PIWIL2 protein levels in human versus NHP iPSCs (Fig. 3c).
Extended Data Figure 2.

Amino acid alignment of A3B and PIWIL2. Protein sequences of human, chimp and bonobo A3B (a) or PIWIL2 (b) were aligned using ClustalW. (a) Alignment of A3B showing >93% identity between human and NHP proteins. (b) Alignment of PIWIL2 showing >98% identity between human and NHP proteins.
Figure 3. Reduced levels of A3B and PIWIL2 and increased L1 mobility in NHP iPSCs.
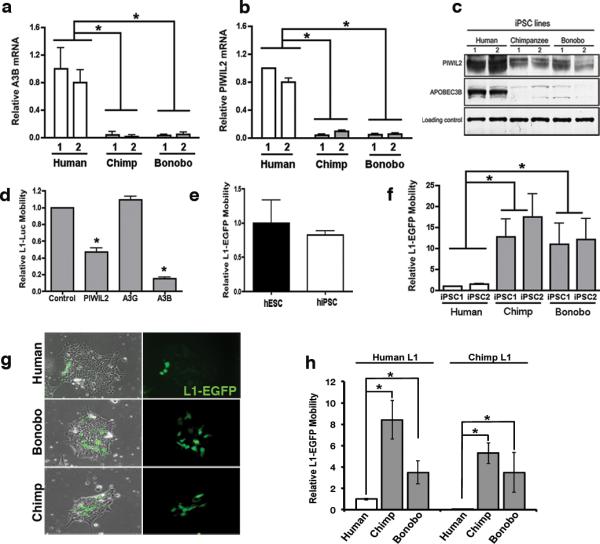
(a,b) Quantitative PCR analysis of A3B (a) and PIWIL2 (b) expression in human and NHP iPSCs (Extended Data Fig. 2 and 9). (c) Immunoblot for A3B and PIWIL2. (d) Effect of A3B and PIWIL2 on L1-luciferase retrotransposition in 293T cells. 293T cells were co-transfected with L1-Luc plasmid (pYX017)19 plus control, PIWIL2, A3B or A3G expressing plasmid. L1-Luc mobility was calculated as firefly luciferase units relative to renilla luciferase units. L1 activity is shown as relative to control plasmid. (e) Comparable levels of L1-EGFP18 mobility in hESCs and hiPSCs. L1-GFP mobility is shown as percentage of EGFP-positive cells by FACS relative to hESCs. (f) L1-EGFP retrotransposition in human, chimp and bonobo iPSCs. L1 mobility was calculated as % of EGFP-positive cells and shown as relative L1 mobility to human IPSC1. (g) Representative images of human, chimpanzee and bonobo iPSCs transfected with L1-EGFP. (h) Retrotransposition quantitation of species-specific L1 elements. Human and Chimp reporter L1-EGFP elements (human-L1 and chimp-L1, respectively) mobility was quantified in transfected in human, chimp and bonobo iPSCs. Retrotranposition activity is shown as relative to Human-L1 activity in human iPSCs. Error bars, s.e.m. *P<0.01 between indicated groups using t-test (for a,b,e,f n=3 biological replicates; d and h n=4 biological replicates).
Extended Data Figure 3.

mRNA levels of APOBEC3 and PIWI-like family members in iPSCs. (a) Comparative analysis of PIWIL2 mRNA levels. Quantitative RT-PCR analysis of PIWIL2 mRNA levels in human testis, human iPSC cell lines and available fibroblasts from, which the iPSC lines were derived from. mRNA levels were normalized to GAPDH and shown as relative to human testis (mean ± s.e.m.; n=3 biological replicates). Compared to testis, PIWIL2 levels are 20 to 40 fold lower in iPSCs and ~1,100-fold lower in fibroblasts. (b,c). Quantification of mRNA levels of APOBEC3 and PIWI-like family members in human and NHP iPSCs by RNA-seq. Increased mRNA levels in human iPSCs is restricted for APOBEC3B and PIWIL2. Y-axes: reads per kilobase per million mapped reads (RPKM).
Ectopic expression of A3B has been shown to inhibit the mobility of human L1 reporter elements6,17 (Extended Data Fig. 4a)18,19. In 293T cells, ectopic expression of human A3B significantly reduced L1-expressing firefly luciferase (L1-Luc)18,19 mobility by 5-fold compared to control plasmid or a plasmid expressing A3G, another APOBEC3 protein that lacks anti-L1 activity (Fig. 3d)17. We also found a significant decrease in L1-Luc retrotransposition in cells overexpressing PIWIL2 compared to control transfected cells (Fig. 3d). We then confirmed that human L1 can retrotranspose in hESCs and hiPSCs under our culture conditions, as previously shown15,20,21 (Fig. 3e). Since we found reduced levels of L1 restriction factors A3B and PIWIL2 in NHPs, we compared L1 activity in human versus NHP iPSCs using the human L1-EGFP reporter element18,19. L1 retrotransposition was significantly higher in NHP compared to human iPSC lines, with 10- and 8-fold increases in EGFP-positive cells in chimpanzee and bonobo iPSCs, respectively (Fig. 3f-g). To test whether the differential L1 regulation in iPSCs is specific to human L1, we measured the activity of a NHP L1 element in iPSCs. We generated a retrotransposition-competent chimpanzee L1-EGFP reporter element (Chimp-L1) (Extended Data Fig. 5), and observed that Chimp-L1 was significantly more active in NHP iPSCs than in human iPSCs (Fig. 3h), suggesting that the decreased L1 activity in human iPSCs is not specific to human L1 element, and that human iPSCs are more efficient in repressing L1 retrotranspostion than NHP iPSCs.
Extended Data Figure 4.

L1 reporter activity in iPSCs. (a) L1 retrotransposition reporter system. The L1-reporter plasmid harbors a retrotransposition-competent human L1 element and carries either a EGFP or a Luciferase (Luc) reporter construct in its 3’ UTR region. The reporter gene is interrupted by an intron in the same transcriptional orientation as the L1 transcript. This arrangement ensures that EGFP/Luc-positive cells will arise only when a transcript initiated from the promoter driving L1 expression is spliced, reverse transcribed, and integrated into chromosomal DNA, thereby allowing expression of the reporter gene from a heterologous promoter. (b-f) Efficient A3B knockdown in human ESCs and iPSCs. (b) Stable shRNA-mediated knockdown of A3B in hESCs (Hues6) using lentivirus expressing different shRNAs against A3B (shA3B-1 and shA3B-2) or control shScramble (shScr). Levels of A3B expression were normalized for GAPDH and shown as relative to shScr (mean ± s.e.m.; n=3 biological replicates). (c) Western blot confirming stable A3B knockdown in hESCs. (d-f) shRNA-mediated knockdown in hESC (Hues6) and iPSC-1 and iPSC-2 (WT33 and Adrc40) was specific for A3B. (g-h) Quantitative RT-PCR analysis of plasmid expression in iPSC lines transfected with L1-EGFP plasmid. Total RNA samples were obtained 60-72 hours post-transfection. L1 plasmid-driven EGFP expression was normalized to GAPDH (g) or Puromycin (h). L1-EGFP contains a puromycin expression cassette under PGK promoter control. Thus, puromycin expression can be used as normalizer for transfection. IPSCs from two different individuals per species were transfected, and EGFP levels are shown as relative to human iPSCs. No significant differences were observed for L1 plasmid expression between human and NHP iPSC lines (mean ± s.e.m.;n=3 biological replicates). (i) Relative L1 5’UTR promoter activity. Human and chimp L1 promoters (L1 5’UTR) were inserted upstream of firefly luciferase reporter in pGL4.10 and transfected into human and NHP iPSC lines. A plasmid expressing Renila luciferase was co-transfected as control. 72 hours post transfection luciferase activity was quantified as firefly luciferase units relative to renilla luciferase units. Results are shown as normalized to human L1 5’UTR activity in human iPSC. IPSCs from two different individuals per species were transfected. No significant differences were observed for L1 promoter activities between human and NHP iPSC lines (mean ± s.e.m; n=4 biological replicates).
Extended Data Figure 5.

Nucleic acid alignment of human and chimpanzee L1 elements. Sequence of the chimpanzee L1Pt element cloned and used to generate the chimpanzee L1-EGFP tagged reporter plasmid (L1IN71) (top sequence). LRE3: human L1 (bottom sequence).
To analyze the contribution of endogenous A3B to the differential L1 activity observed among primate cells, we generated human ESCs and iPSCs with decreased levels of A3B (Fig. 4a and Extended Data Fig. 4b,c). Stable knockdown of A3B (shA3B) resulted in a significant increase in L1-EGFP activity compared to shScramble (shScr) control cells in human iPSCs (Fig. 4a-b). Knockdown was specific to A3B, not affecting other APOBEC3s (Extended Data Fig. 4d-f). As expected, L1 mobility was significantly decreased in both chimpanzee and bonobo iPSC lines after A3B overexpression (Fig. 4c). Similarly, overexpression of chimpanzee or bonobo PIWIL2 in NHP iPSCs reduced L1 mobility to levels detected in human iPSCs (Fig. 4d). We did not observe differences in the levels of L1-EGFP mRNA expressed from transfected L1 plasmid or in L1 promoter activity between human and NHP iPSCs (Extended Data Fig. 4g-i). Together these results suggest that differences in A3B and PIWIL2 expression levels contribute to higher L1 retrotransposition in NHP iPSCs compared to human iPSCs
Figure 4. Species-specific L1 elements are more abundant in chimpanzee genomes than in human genomes, correlating with decreased levels of A3B and PIWIL2.

(a) Stable knockdown of A3B (shA3B-1, shA3B-2) or control (shScr) in human iPSCs. A3B expression was normalized to GAPDH and shown as relative to shScr. (b) L1-EGFP mobility in shA3B iPSCs. EGFP-positive cells were quantified by FACS analysis and shown as relative to shScr iPSC line. (c,d) Overexpression of A3B (c) and PIWIL2 (d) decreases L1-EGFP retrotransposition in NHP iPSCs. Cells were electroporated with L1-EGFP plus control (CTR), A3B or PIWIL2 expressing plasmids. L1-EGFP mobility is shown as relative to human iPSC-1 CTR. (e) Immunoprecipitation of piRNAs associated with PIWIL2 in human iPSCs. (Top) Immunoprecipitation of PIWIL2 RNPs from Tet-inducible GFP and Flag-tagged PIWIL2 human iPSCs after addition of Doxycycline. (Bottom) γ32P-ATP 5’end labeling of RNA associated with Flag-PIWIL2 RNPs. Size markers are indicated. (f) Mapping of 26-33 nt RNA reads (containing uracil in the 5’end and/or adenine at position +10) detected by small RNA-seq from hiPSC1 and hiPSC2 to consensus L1Hs (Repbase). Positive and negative values indicate sense and antisense piRNAs,, respectively. Schematic representation of L1 is shown on top. Y-axes: read counts normalized to 107 reads per experiment. (g) Quantitative RT-PCR analysis of endogenous L1 RNA in human and NHP iPSCs. Values represent the average of relative levels for L1 RNA (5’UTR, ORF1, ORF2) normalized to Actin mRNA levels. L1 levels are shown as relative to IPSC-1. (h) Comparative quantitative analysis of L1 elements in human and chimpanzee genomes for L1 families L1PA4, L1PA3, L1PA2, L1Pt and L1Hs. (i) Number of species-specific L1 insertions (L1PA2, L1Hs, L1Pt) relative to their divergence. L1 elements plotted as a histogram relative to their divergence (number of mutations relative to the canonical element). Error bars: s.d.. *P<0.001 between human and chimpanzee, Mann-Whitney test (a,b,c,d and g, error bars: s.e.m., *P<0.01 between indicated groups, t-test, a,b,c and d, n=3; g n=4 biological replicates).
PIWIL2 repression of transposons is mediated through piRNAs22. Thus, we analyzed the presence of PIWIL2-bound piRNAs in doxycycline-inducible human iPSCs expressing Flag-tagged PIWIL2 by immunoprecipitation and subsequent 5’ end labeling. Analysis of PIWIL2-associated small RNAs revealed the presence of ~26-30 nt RNAs only in cells expressing Flag-PIWL2 but not in control cells or in pull-downs with control antibody (Fig. 4e and Extended Data Fig. 6a,b). Next, to probe for the presence of L1-targeting-piRNAs we characterized the small RNA populations in human iPSCs by small RNA-seq analysis (Extended Data Fig. 6c,d, Supplementary Table 1 and 2). We detected 272 and 229 annotated piRNAs in human iPSC1 and iPSC2, respectively (Extended Data Fig. 6d-f and Supplementary Table 2). In addition, we observed a number of 26-33 nt small RNAs mapping to the consensus human-specific L1 element (L1Hs) sequence (Fig. 4f, Extended Data Fig. 7a,b), including 12 and 10 out of the 37 annotated piRNAs mapping to L1Hs in piRNAbank (http://pirnabank.ibab.ac.in/) in hiPSC1 and hiPSC2, respectively (Extended Data Fig. 6e,g and 7a-c). Together these results demonstrate the presence of piRNAs complementary to L1Hs in human iPSCs.
Extended Data Figure 6.

Immunoprecipitation of piRNAs associated with PIWIL2 in human iPSCs and annotated piRNAs mapping to consensus L1Hs in iPSCs. (a) Immunoprecipitation of PIWIL2 RNPs using Flag-tag antibodies from Tet-inducible Flag-tagged PIWIL2 human iPSCs after addition of Doxyclycine to the culture media. HA-tag antibody was used as control. (b), γ32P-ATP end labeling of RNAs associated with Flag-PIWIL2 RNPs. Signal in the piRNAs size range is detected only in anti-Flag but not in control antibody anti-HA immunoprecipitates. (c) Size distribution of RNA reads detected by small RNA-seq from small RNAs samples extracted from human iPSC cell lines (hiPSC1 and hiPSC2). (d) Number of mapped reads per sample in small RNA-seq. (e) Number of annotated piRNAs (piRNAbank) detected by RNA-seq in human iPSC1 and iPSC2. (f) Characterization of 5’ end of piRNAs detected in human iPSCs relative to annotated piRNAs. Read count distribution relative to piRNA 5' ends (piRNAbank). (g) Sequences of annotated piRNAs (piRNAbank) mapping to consensus L1Hs detected in human iPSC1 and iPSC2. 26-33nt RNA reads from human iPS cell lines 1 and 2 (hiPSC1 and hiPSC2) characterized by RNASeq are aligned to annotated piRNAs mapping to the consensus L1Hs sequence. Analysis of mapping sequences was performed allowing 2 mismatches.
Extended Data Figure 7.

Mapping of 26-33 nt RNAs in human iPSCs to consensus L1Hs. (a) Mapping of annotated piRNAs (piRNAbank) detected by RNA-seq from human iPSC lines (hiPSC1 and hiPSC2) to the consensus sequence for L1Hs (from Repbase). All annotated piRNAs (piRNAbank) complementary to the L1Hs are indicated (black bars). (b) Total 26-33 nt RNA reads characterized by small RNA seq mapped to L1Hs. (c) Similar analysis as in (b) of ENCODE data for small RNAs from human ES H1 cells (hESC H1). Positive and negative values indicate sense and antisense piRNAs (+/−), respectively. Schematic representation of the L1Hs element is shown (top). Y-axes represent read counts normalized to 107 reads per experiment.
We then asked whether different levels of L1 reporter mobility between human and NHP iPSCs reflect differences in endogenous L1 activity. First, we analyzed endogenous L1 RNA levels by qPCR and found higher levels of endogenous L1 mRNA in chimpanzee and bonobo compared to human iPSCs (Fig. 4g and Extended Data Fig. 8a-c). Next, we examined the number of L1 elements in human and chimpanzee genomes to assess differences in recent L1 mobility. We did not observe major differences in the number of L1 elements for older families (L1PA4, L1AP3 and L1PA2; approximately 18, 12.5 and 7.6 Million year old, respectively)23,24 (Fig. 4h). However, we did observe significantly higher numbers of chimpanzee-specific L1 elements (L1Pt) compared to L1-Hs elements (L1Hs)25,26(Fig. 4h). Differences in expression of A3B and PIWIL2 suggest that L1 mobility may have been altered at a relatively recent evolutionary divergence. Therefore, using divergence as a measurement of L1 age, we estimated the number of species-specific L1 loci and found that the number of chimpanzee-specific loci was significantly higher than the number of human-specific loci (Fig. 4i and Extended Data Fig. 8d-g). The increased number of species-specific L1 loci in chimpanzee suggests that endogenous L1 has been more active in NHP genomes, correlating with the decreased levels of A3B and PIWIL2.
Extended Data Figure 8.

Higher levels of endogenous L1 RNA and recent species-specific L1 elements in chimpanzee. (a) Scheme of amplicons mapped to the L1Hs consensus sequence. Six primer pairs (two per region) were used for quantification of 5'UTR, ORF1 and ORF2. The primers were designed to recognize both species-specific and common families. (b) Positions of the amplicons in L1Hs consensus sequence and the number of in silico PCR hits on the Human and Chimp genomes. (c) Quantitative RT-PCR analysis using primers for different regions of L1 element show higher levels of L1 RNA in NHP iPSCs regardless of the L1 region tested: 5’-UTR, ORF1 and ORF2. (mean ± s.e.m.; n=3 biological replicates; *P<0.01 between indicated groups, t-test). (dg) Quantification of L1 elements in human and chimpanzee genomes using a population divergence model. Number of L1 elements found in the human and chimpanzee genomes for families: L1PA4 (d), L1PA3 (e), L1PA2 (f), and L1Pt and L1Hs (g) plotted as a histogram relative to their divergence (number of mutations relative to the canonical element). The standard deviation describes the differences in L1 density based on the sampling of different genomic regions and represents the variability of L1 coverage across the genomes (see methods).
Here we report that iPSCs from both chimpanzees and bonobos have increased L1 mobility. Different rates of L1 activity could lead to significant changes in genomic structure and function, and could potentially impact adaptation. The human population has gone through one or more bottlenecks throughout evolution that might have contributed to decreased genetic diversity27. Chimpanzees and bonobos, in contrast, have increased levels of genetic diversity when compared to humans28. This idea is also supported by data showing that there is substantially more genetic difference among individuals within chimpanzee troops in West Africa than among all living humans29. While it remains unclear what the main generators of the phenotypic differences between us and our closest living relatives are (despite the extreme genetic similarity), we propose that L1 mobility could be playing a role in differentially shaping the genomes of humans and NHPs, providing an extra layer of variability to the latter. In fact, recent studies have suggested that ongoing L1 retrotransposition may contribute to inter individual genetic variation30. In this work we also present a new perspective on the use of iPSC technology as a powerful tool for the study of early stages of development and possible validation of evolutionary genomic and transcriptomic modifications that identify humans as outliers among primates. The great apes iPSCs that we describe here can also be used for comparative studies of any derivative pluripotent or terminally differentiated cell types, limited solely by the availability of differentiation protocols.
METHODS
Cell culture and retrovirus infection
hESC Hues6 and H1, human iPSC lines WT-33, ADRC-40 (human IPSC1 and IPSC2 in this work, respectively) and WT-126 were previously described31. Fibroblasts from human GM22159 (WT-9), Pan troglodytes (Chimpanzees: PR00818 and PR01209) and from Pan paniscus (Bonobos: AG05253 and PR01086) were acquired from Coriell Cell Repositories (NJ) (Extended Data Table 1). All fibroblasts were cultured in Minimum Essential Medium (Invitrogen) supplemented with 10% fetal bovine serum (HyClone Laboratories). Retroviral vectors expressing Oct4, c-Myc, Klf4 and Sox2 human cDNAs from Yamanaka's group9 were obtained from Addgene. Recombinant viruses were produced by transient transfection in 293T cells, as previously described32. Two days after infection, cells were plated on mitotically inactivated mouse embryonic fibroblasts (Chemicon) with hESC medium. After 2 to 4 weeks, iPSCs colonies were picked manually and directly transferred to feeder-free conditions on matrigel-coated dishes (BD) using mTeSR™1 (StemCell Technologies). Established iPSCs colonies were kept in feeder-free conditions indefinitely and passed using mechanical dissociation. Embryoid body (EB)-mediated differentiation in suspension was carried out for 10 days in the absence of growth factors. The use of chimpanzee and bonobo fibroblast samples was approved by the US Fish and Wildlife Service, under the permit MA206206. Protocols describing the use of iPSCs and hESCs were previously approved by the University of California San Diego and Salk Institute Institutional Review Board and the Embryonic Stem Cell Research Oversight Committee31. To generate stable shA3B cells lines, Hues6, WT33 and ADRC-40 cells were transduced with lentiviruses expressing shRNAs and selected for puromycin resistance. pLKO.1-based lentiviral plasmids encoding shRNAs against A3B (RHS3979-99216651 and RHS3979-99216658) were obtained from Open Biosystems. Recombinant lentiviruses were produced by transient transfection on 293T cells as previously described 33.
Extended Data Table 1.
List of primers used in this study.
| Primers | Sequence | Use |
|---|---|---|
| Nanog-F | 5’- CCTATGCCTGTGATTTGTGG -3’ | PCR |
| Nanog-R | 5’- CTGGGACCTTGTCTTCCTTT -3’ | PCR |
| AFP-F | 5’- AAAAGCCCACTCCAGCATC -3’ | PCR |
| AFP-R | 5’- CAGACAATCCAGCACATCTC -3’ | PCR |
| Musashi-F | 5’- AAAGGAGGTGATGTCGCCAA -3’ | PCR |
| Musashi-R | 5’- TGGTCCGTAGGCAGTGAGA -3’ | PCR |
| Brachyury-F | 5’- GCCCTCTCCCTCCCCTCCACGCACAG -3’ | PCR |
| Brachyury-R | 5’- CGGCGCCGTTGCTCACAGACCACAGG -3’ | PCR |
| B-Actin-F | 5′- TGTTTTCTGCGCAAGTTAGGTTTT -3′ | PCR |
| B-Actin-R | 5′- GCCGACAGGATGCAGAAGGAGAT -3′ | PCR |
| APOBEC3B (20-40) | 5′-GCGGGACAGGGACAAGCGTAT-3′ | Cloning |
| APOPEC3B (1250-1228) | 5′-CTGCTCAACCCAGGTCTCTGCCT-3′ | Cloning |
| APOBEC3B (19-41) | 5′-AGCGGGACAGGGACAAGC GTATC-3′ | Cloning |
| APOBEC3B(1309-1288) | 5′-AGCTGGAGATGGTGGTGAACGG-3′ | Cloning |
| L1Pt ch7 11 F | 5′-TTGCAGGTACTCTGAGCTTCAC-3′ | Cloning |
| L1Pt ch7 11 R | 5’-AAGGAGAAGCACCTGCATGA-3’ | Cloning |
| Not-L1 F | 5’-ATAAGAATGCGGCCGCGGGGGAGGAGCCAAGATG-3’ | Cloning |
| XhoINotI L1 5UTR | 5’-CCGCTCGAGCGGCCGCGGGGGAGGAG-3’ | Cloning |
| L1 5UTRHindIIIATG | 5”-TTTTTAAGCTTCCATCTTTGTGGTTTTATCTAC-3” | Cloning |
| APOBEC3B-F | 5’-CGCCAGACCTACTTGTGCTAT-3’ | qPCR |
| APOBEC3B-R | 5’-CATTTGCAGCGCCTCCTTAT-3’ | qPCR |
| GAPDH-F | 5’- CATGTTCCAATATGATTCCACC-3’ | qPCR |
| GAPDH-R | 5’- CTCCACGACGTACTCAGCG-3’ | qPCR |
| PIWIL2-F | 5′- TTGTGGACAGCCTGAAGCTA -3′ | qPCR |
| PIWIL2-R | 5′- CCATCAGACACTCCATCACG -3′ | qPCR |
| L1 5’UTR set1-R | 5’-AAGATGGCCGAATAGGAACA-3’ | qPCR |
| L1 5’UTR set1-R | 5’-GATGAACCCGGTACCTCAGA-3’ | qPCR |
| L1 5’UTR set2-R | 5’-GAGATCTGAGAACGGGCAGA-3’ | qPCR |
| L1 5’UTR set2-R | 5’-AGCTGCAGGTCTGTTGGAAT-3’ | qPCR |
| L1 ORF1 set1-F | 5’-GCTACGGGAGGACATTCAAA-3’ | qPCR |
| L1 ORF1 set1-R | 5’-TTCAGCTCCATCAGCTCCTT-3’ | qPCR |
| L1 ORF1 set2-F | 5’-ATGAGCAAAGCCTCCAAGAA-3’ | qPCR |
| L1ORF1 set2-R | 5’-TTCTCCCCATCACTTTCAGG-3’ | qPCR |
| L1 ORF2 set1-F | 5’-TGACAAACCCACAGCCAATA-3’ | qPCR |
| L1 ORF2 set1-R | 5’-CCCTGTCTTGTGCCAGTTTT-3’ | qPCR |
| L1 ORF2 set2-F | 5′-TGGAGGCATCACACTACCTG-3′ | qPCR |
| L1 ORF2 set2-R | 5′-ATGCGGCATTATTTCTGAGG-3′ | qPCR |
| Actin-F | 5′- TACAATGAGCTGCGTGTGG-3′ | qPCR |
| Actin-R | 5′- TAGCACAGCCTGGATAGCAA-3′ | qPCR |
| GFP F2 | 5′- GGGTGTTCTGCTGGTAGTGG-3′ | qPCR |
| GFP R2 | 5′- TATATCATGGCCGACAAGCA-3′ | qPCR |
| PURO F | 5′- CTCGACATCGGCAAGGTGTG-3′ | qPCR |
| PURO R | 5′- GCCTTCCATCTGTTGCTGCG-3′ | qPCR |
| APOBEC3A | TaqMan Assay (Life Technologies) Hs00377444 | qPCR |
| APOBEC3B | TaqMan Assay (Life Technologies) Hs00358981 | qPCR |
| APOBEC3C | TaqMan Assay (Life Technologies) Hs00828074 | qPCR |
| APOBEC3D | TaqMan Assay (Life Technologies) Hs00537163 | qPCR |
| APOBEC3F | TaqMan Assay (Life Technologies) Hs01665324 | qPCR |
| APOBEC3G | TaqMan Assay (Life Technologies) Hs00222415 | qPCR |
| APOBEC3H | TaqMan Assay (Life Technologies) Hs00962174 | qPCR |
| PIWIL2 | TaqMan Assay (Life Technologies) Hs01032720 | qPCR |
| GAPDH | TaqMan Assay (Life Technologies) Hs03929097 | qPCR |
| HPRT | TaqMan Assay (Life Technologies) Hs01003267 | qPCR |
Teratoma formation in nude mice
Around 1-3 ×10⁶ cells were injected subcutaneously into the dorsal flanks of nude mice (CByJ.Cg-Foxn1nu/J) anesthetized with isoflurane. Five to 6 weeks after injection, teratomas were dissected, fixed overnight in 10% buffered formalin phosphate and embedded in paraffin. Tissues were then prepared for histopathologic analysis by the UCSD Mouse Phenotyping Services (UCSD, CA http://mousepheno.ucsd.edu). Briefly, the tissue was sectioned and stained with hematoxylin and eosin. Control mice injected with fibroblasts failed to form teratomas.
Karyotyping
Standard G-banding chromosome analysis was performed by Cell Line Genetics (CLG, Madison, WI). Diploid human cells with 2n=46 chromosomes; bonobo and chimpanzee with 2n=48 chromosomes.
RNA extraction and RT-PCR
Total cellular RNA was extracted from ~5×10⁶ cells using the RNeasy Protect Mini kit or RNeasy Plus kit (Qiagen, Valencia, CA), according to the manufacturer's instructions, and was reverse transcribed using the SuperScript III First-Strand Synthesis System RTPCR from Invitrogen. For iPSC markers, cDNA was amplified by PCR using Accuprime Taq DNA polymerase system (Invitrogen). Primer sequences are shown in Extended Data Table 1. PCR products were separated by electrophoresis on a 2% agarose gel, stained with ethidium bromide and visualized by UV illumination. Total RNA samples from human testis were obtained from Clontech. Small RNA was extracted using the mirVana kit (Ambion).
Quantitative RT-PCR
RNA was extracted using a QIAGEN RNeasy Plus kit or TRIzol (Life Technologies) and then retrotranscribed to cDNA with the Superscript III First-Strand synthesis system (Invitrogen). qRT-PCRs were carried out using SYBR Green mix (Roche) or TaqMan Assays (Life Technologies) using ABI Prism 7900HT sequence detection system (Applied Biosystems). The primers and Taqman sets used in this work are described in Extended Data Table 1. Data analysis was performed with SDS 2.3 software (Applied Biosystems). Primer efficiency was verified by linear regression to the standard curve. Values were normalized to GAPDH, HPRT or b-Actin. Reactions were carried out in triplicate and data were analyzed using the comparative (delta-delta Ct) method. For A3B and PIWIL2, RNA levels were normalized to GAPDH or b-Actin and represented as relative to IPSC-1. Relative A3B and PIWIL2 mRNA levels normalized to GAPDH for each individual iPSC line and fibroblasts are shown in Extended Data Fig. 9. The reduced levels of A3B in NHP iPSC were not due to an A3B deletion polymorphism previously described in human individuals34 (data not shown). For L1 RNA quantitative RT-PCR, values representing the average of relative levels for L1 RNA (5’UTR, ORF1 and ORF2) were calculated, and were normalized to Actin mRNA levels. L1 levels are shown as relative to IPSC-1. Quantitative RT-PCR analysis of EGFP expression in iPSC lines transfected with L1-EGFP plasmid was carried out 60-72 hours post-transfection. At this time after transfection, EGFP RNA expressed from retrotransposed L1-EGFP will be insignificant compared to L1-EGFP plasmid-driven expression. EGFP levels were normalized to GAPDH or puromycin. L1-EGFP contains a puromycin expression cassette under PGK promoter control. Thus, puromycin expression can be used as normalizer for transfection. IPSCs from two different individuals per species were transfected, and EGFP levels are shown as relative to human iPSCs.
Extended Data Figure 9.

Relative APOBEC3B and PIWIL2 mRNA levels in iPSC and fibroblasts. Relative expression of (a) A3B and (b) PIWIL2 in human and NHP iPSC lines, and the available source fibroblasts from, which iPSCs were derived from. mRNA levels were normalized to GAPDH and shown as relative to human iPSC1.
Plasmids
Human APOBEC3B cDNA from WT-33 and ADRC-40 iPSCs was amplified using Phusion high-fiidelity polymerase (New England BioLabs) and primers described in Extended Data Table 1. A3B cDNA fused to HA-tag was then inserted into KpnI/XbaI digested pcDNA3.1+ (pcDNA3-A3B) as previously described 35. Similarly, PIWIL2 cDNAs were amplified from human and NHP iPSCs as described above and inserted into pEF-BOS-EX using EcoRI/SalI36. The plasmid expressing APOBEC3G was previously described 35.
RNA library generation and deep sequencing
PolyA+ RNA was fragmented and prepared into sequencing libraries using the Illumina TruSeq RNA sample preparation kit and analyzed on an Illumina HiSeq 2000 sequencer at the UCSD Biomedical Genomics Laboratory (BIOGEM). cDNA libraries were prepared from four human, two chimpanzee and two bonobo iPSC lines derived from fibroblasts (two clones each, except for human WT9 and WT126), and two hESCs (Hues6 and H1). Libraries were sequenced using paired-end 2× 100 bp reads at a depth of 15-30 million reads per library (250 ± 25 bp fragments) (Extended Data Fig. 1b). Paired end reads from all libraries were mapped to both the human (hg19, GRCh37) and chimpanzee (panTro3, CGSC 2.1.3) genomes using STAR (v2.2.0c)37. To compare gene expression between human and NHP iPSCs, we first mapped paired end reads from all libraries to both human and chimpanzee genomes and then calculated gene expression read counts relative to human RefSeq transcripts. Due to the lack of annotation in the chimpanzee genome, human gene models (RefSeq) were used to quantify gene expression. To avoid bias introduced by genome insertions and deletions, only reads mapping to both the human and chimpanzee genomes uniquely were used from each sample when comparing gene expression values (~4% of reads mapped to only one genome per sample). To calculate gene expression, read counts in the exons of RefSeq transcripts where calculated using HOMER38. Gene expression clustering was carried out using Gene Cluster 3.0 and visualized with Java Tree View39,40. EdgeR was used to identify differentially expressed genes comparing human samples with NHPs, and pairwise between bonobo, chimpanzee, and human41. Functional enrichment analysis was restricted to differentially expressed coding genes with false discovery rates less than 5% and a fold change greater than 2-fold. We further restricted genes to contain an average of 10 normalized reads across sample groups to remove genes with very low expression. Gene Ontology functional enrichment for biological processes (level 2) was carried out using DAVID42, Homo sapiens whole genome was set as background.
Small RNA library generation and deep sequencing
Small RNA (15-40 nt) libraries were prepared using the Illumina TruSeq Small RNA sample preparation kit and analyzed on an Illumina HiSeq 2000 sequencer at the Beijing Genomics Institute. Libraries were sequenced using single-end reads at a depth of 15-25 million reads per library. Adapter sequences were clipped from the 3’ end of each read and then aligned to the human (hg19, GRCh37) genome or to the L1Hs consensus sequence (Repbase43) using Bowtie2 (v4.1.2)44. Reads aligning to miRBase-defined miRNA transcripts were quantified using HOMER. Matches to previously identified human piRNAs were restricted to small RNAs with lengths between 26 and 33 nt with 5’ ends within 2 nt of previously identified piRNA 5’ ends based on piRNABank (http://pirnabank.ibab.ac.in/)45.
L1 retrotransposition
Reporter L1 elements are tagged with a reporter gene (EGFP or firefly Luciferase (Luc)) such that only cells that complete a round of retrotransposition will express the reporter gene46. Three L1 reporter plasmids were used in this work. L1-EGFP18,46 was previously described and was a gift from Dr. J.V. Moran. L1 luciferase-tagged plasmids (pYX014 and pYX017)19 were obtained from W. An. In pYX014, L1 is regulated by its native promoter (5’-UTR) and, in pYX017, by the heterologous promoter CAG. pYX014 and pYX017 plasmids contain a renilla luciferase expression cassette that allows for control of transfection efficiency. L1 assays in 293T cells were carried out as previously described 47. 293T cells were transfected with L1 reporter plasmid together with control plasmid or plasmids expressing A3B, A3G or PIWIL2 using polyethylenimine (PEI). L1-Luciferase retrotransposition was measured by quantification of luciferase activity using the Dual-Glo luciferase reporter assay (Promega) and normalized to renilla luciferase. L1-Luc inhibition in the presence of A3B or PIWIL2 was independent of the promoter driving L1 expression (data not shown). Inhibition levels of L1 retrotransposition by A3B and PIWIL2 were comparable between the three L1 reporter plasmids used in this study. Plasmid transfections of iPSCs were performed by electroporation of L1-EGFP plasmid following the manufacturer's instructions (Lonza/Amaxa Nucleofactor, Kit V). The cells were then cultured under normal conditions for 10 days and the percentage of retrotransposition was measured by fluorescent activated cell sorting (FACS) of EGFP-positive cells. Electroporation efficiency of the L1-EGFP plasmid in human and NHP iPSC was controlled by transfecting a cassette expressing EGFP and analyzed by FACS after 48h. Human and NHP iPSC lines had similar transfection efficiency rates. To test the effect of A3B and PIWIL2 overexpression on L1 activity in NHP iPSCs, human A3B and human, chimpanzee or bonobo PIWIL2 cDNAs were electroporated. All experiments were performed at least three times independently. L1 mobility assays are shown as relative value compared to mock transfections or human IPSC-1 and represented as mean±SEM of at least three independent experiments.
Identification and cloning of a retrotransposition-competent Chimpanzee L1
To clone an intact L1 and generate a chimpanzee L1-EGFP reporter plasmid, we followed a modification of the strategy previously described48. Intact L1Pt elements were identified in the Chimpanzee genome (CSAC 2.1.4/panTro4, UCSC) through Blat and L1Xplorer analyses49. Among the identified intact full-length L1Pt elements, we amplified the L1 element located in chromosome 7: 11771100-11777132 of the chimpanzee genome from 0.2 ng of genomic DNA extracted from chimpanzee iPSC1. Primers were designed to match unique sequences flanking 5’ and 3’ of the L1Pt and PCR reactions were performed using Phusion High-Fidelity polymerase (NEB). PCR product was sequenced to confirm intactness (Extended Data Fig. 5). A second PCR was performed using the first PCR product as template to introduce a NotI site upstream the 5’end of L1Pt. The second PCR product was digested with NotI/BstZ17I (New England Biolabs) and inserted into NotI/BstZ17I-digested pL1-EGFP replacing the human-L1 element to generate L1IN71 by using Rapid Ligation kit (Roche). L1IN71 contains a full-length L1Pt element tagged with the EGFP retrotransposition reporter cassette. Primers used for cloning L1IN71 are show in Extended Data Table 1.
L1 promoter activity
Human and chimp L1 promoters (L1 5’UTR) were amplified by PCR from L1-EGFP and L1IN71 plasmids, and inserted into XhoI/HindIII digested pGL4.10 (Promega) upstream firefly luciferase cDNA (L15’UTR plasmids). To quantify L1 promoter activity, L15’UTR plasmids were co-transfected into human and NHP iPSC lines with a plasmid expressing Renila luciferase. 72 hours post-transfection luciferase activity was quantified and firefly luciferase signal were normalized to renilla luciferase signal. Results are shown as relative to human L1 5’UTR activity in human iPSCs. Two iPSC lines from different individuals (iPSC1 and iPSC2) per species were transfected. Primers used for cloning L1 5’UTRs are show in Extended Data Table 1.
Quantification of reference genome-encoded L1 insertions
Quantification of L1-derived genomic sequences was based on Repbase defined elements annotated by RepeatMasker (http://www.repeatmasker.org). L1 genomic positions for human (hg19, GRCh37) and chimpanzee (panTro3, CGSC 2.1.3) genomes were downloaded from the UCSC Genome Browser annotation database50. Due to the large number of unfinished gaps in the chimpanzee genome assembly greater than 2 kb in size, only truncated L1 elements between 100 bp and 1 kb in length were considered in this analysis. Most of these represented the 3’ end of L1 elements. L1 elements were separated based on their annotation as L1HS, L1Pt, L1PA2, L1PA3, or L1PA4 and were plotted as a histogram relative to their divergence values, which indicates the fractions of nucleotides that are mutated relative to the consensus element for each family. To estimate the variability of L1 coverage across the genome, each genome was fragmented into 1 Mb sections and then was randomly sampled in ten separate groups to calculate the standard deviation in number of L1 elements across different regions of the genome. A strong concentration of L1 elements in a few specific regions of the genome would result in a very high variance between groups, whereas uniform insertion across the genome would result in a low variance. This standard deviation between each sampling was reported as a function of divergence for each class of L1 elements.
To identify reference L1 elements that were inserted into the genome after the last common ancestor for human and chimpanzee, L1 elements were mapped between homologous regions of each genome using the UCSC LiftOver tool. If an element failed to map between genomes, the 100 bp regions immediately upstream and downstream of the L1 element were also mapped between genomes using the LiftOver tool. If the upstream and downstream regions both mapped to the other genome, then the L1 element was mostly likely a result of a recent retroviral insertion. If only one or neither of the upstream and downstream regions mapped between genomes, the region was more likely the result of a genomic duplication or deletion and was discarded from the analysis. Error bars (standard deviation) represent the differences in L1 density based on the sampling of different genomic regions and represents the variability of L1 coverage across the genomes.
Immunocytochemistry
Cells were fixed in 4% paraformaldehyde and then permeabilized with 0.5% Triton-X100 in PBS. Cells were then blocked in 5% donkey serum for 1 hour before incubation with primary antibody overnight at 4°C. After three washes with PBS, cells were incubated with secondary antibodies conjugated to fluorophors (Jackson Immuno Research) for 1 hour at room temperature. Fluorescence was detected using a Zeiss inverted microscope.
Immunoblotting
Immunoblotting was performed as previously described (Narvaiza et al. 2009). Cell pellets were lysed in lysis buffer supplemented with Complete protease inhibitor cocktail (Roche) for 30 min on ice35. Protein concentrations from whole cell lysates were quantified by BCA assay (Bio-Rad). Proteins were separated in 4–12% Acrylamide Bis-Tris NuPage gels in MOPS buffer (Invitrogen) and transferred onto Hybond nitrocellulose membranes (Amersham Biosciences).
Antibodies
Primary antibodies used in this study were: TRA-1-81 (1:100, Millipore, MAB4381), Nanog (1:500, R&D Systems, AF1997), APOBEC3B (D-15) (1:500, Santa Cruz, sc-86289), PIWIL2 (1:1000, R&D Systems, AF6558), GFP (1:200, Molecular Probes-Invitrogen, A-6455), Flag (1:1000 Sigma, F7425) and HA (1:1000 Sigma, H6908). All secondary antibodies were purchased from Jackson ImmunoResearch.
PIWIL2 RNPs immunoprecipitation and end labeling
Tetracycline-inducible human iPSCs expressing flag-tagged PIWIL2 were generated by transduction with lentiviruses (Lv)51. Cells were first transduced with a Lv expressing tetracycline transactivator rtTA (LvXEtO). After 10 days of culture in growth media with Neomycin (Neo), Neo-resistant colonies were then transduced with a Lentivirus expressing Flag-PIWIL2 under the control of a tetracycilne-inducble promoter (LvXTPFlagPIWIL2) and selected for resistance to puromycin. For PIWIL2 RNP immunoprecipitation, ~3×10⁷ human iPSCs were treated with doxycycline for 72 hrs, and pelleted cells were resuspended in 1 ml of Lysis Buffer 1 (20 mM Tris-HCl, pH 7.4, 150 mM NaCl, 1 mM MgCl2, 0.5% NP40, 1% glycerol, 1 mM DTT, 0.1 U/μl RNAse inhibitor (Ambion), Complete EDTA-free protease inhibitor (Roche)). Cell lysates were cleared by centrifugation at 20,000 g for 20 min at 4°C. Cleared lysates were incubated with EZview Red FLAG M2 Affinity Gel (Sigma) for 3 hrs at 4°C and washed 5 times with wash buffer (Lysis Buffer 1 without glycerol). Co-immunoprecipitated RNAs were extracted with Trizol, followed by precipitation with isopropanol and glycogen (Ambion). Isolated RNA was 5’ labeled with [γ-32P]-ATP using T4 polynucleotide kinase (NEB), resolved on 15% PAGE TBE urea gels along with radiolabeled Decade size marker (Ambion) and visualized in a Typhoon phosphorimager (Amersham Biosciences). Control immunoprecipitations were carried out with lysates from cells without doxycycline induction, from doxycycline-induced GFP expressing hiPS cells or with control antibody (anti-HA).
Data deposition
RNA-Seq and small RNA-seq data have been deposited in the Gene Expression Omnibus under accession number GSE47626. GenBank accession numbers: KF651164 (P. paniscus PIWIL2), KF651165: (H. sapiens PIWIL2), KF651166 (P. troglodytes PIWIL2), KF651167 (H. sapiens APOBEC3B), KF651168 (P. troglodytes APOBEC3B), KF651169 (P. paniscus APOBEC3B) and KF661301 (L1Pt in Chimp-L1 plasmid).
Supplementary Material
Acknowledgments
The work was supported by funds from NIH (TR01: MH095741 and Eureka: MH08848 to F.H.G.), the Mathers Foundation and the Helmsley Foundation. This work was also partially supported by funds from NIH to A.R.M. (MH094753), M.D.W. (AI074967) and to G.W.Y. (NS075449, HG004659 and GM084317). G.W.Y. is a recipient of the Alfred P. Sloan Research Fellowship. We thank Dr. J.V. Moran and W. An for reagents. We would like to thank Dr. A. Varki, (UCSD), Dr P. Gagneux (UCSD), Dr. L. Fourgeaud and I. Guimont (Salk Institute) for helpful discussions, N. Varki (UCSD) for help with teratoma analysis, R. Keithley, I. Gallina and Y. Nunez (Salk Institute) for technical assistance and M.L. Gage for editorial comments.
Footnotes
Author Contributions
M.C.N.M. and I.N. are the leading authors. M.C.N.M., I.N. and A.M.D. contributed to the concept, designed and performed the experiments, and analyzed the data. M.C.N.M. reprogrammed NHP fibroblasts and performed iPSC cultures and transduction assays. A.M.D. C.B. and I.N. designed and performed the comparative analysis of L1 insertions in the human and NHP genomes. T.A.L. produced lentiviruses and provided tissue culture assistance. I.N and K.N.D. generated the Chimp L1 reporter plasmid. C.B., A.C.M.P. and R.H.H performed bioinformatics analysis. J.L.N. contributed to the generation of libraries and analysis of RNASeq data. M.D.W, G.W.Y. and A.R.M. contributed to concept and financial support. F.H.G. is the senior author. He contributed to the concept, analyzed the data, revised the manuscript and provided financial support. I.N., M.C.N.M., A.M.D. and F.H.G wrote the manuscript. All the authors read and approved the final manuscript.
Supplementary Information is available in the online version of the paper.
The authors declare no conflict of interest.
References/Additional References
- 1.Chimpanzee S, Analysis C. Initial sequence of the chimpanzee genome and comparison with the human genome. Nature. 2005;437:69–87. doi: 10.1038/nature04072. [DOI] [PubMed] [Google Scholar]
- 2.Prufer K, et al. The bonobo genome compared with the chimpanzee and human genomes. Nature. 2012;486:527–531. doi: 10.1038/nature11128. [DOI] [PMC free article] [PubMed] [Google Scholar]
- 3.Lander ES, et al. Initial sequencing and analysis of the human genome. Nature. 2001;409:860–921. doi: 10.1038/35057062. [DOI] [PubMed] [Google Scholar]
- 4.Waterston RH, et al. Initial sequencing and comparative analysis of the mouse genome. Nature. 2002;420:520–562. doi: 10.1038/nature01262. [DOI] [PubMed] [Google Scholar]
- 5.Kazazian HH., Jr. Mobile elements: drivers of genome evolution. Science. 2004;303:1626–1632. doi: 10.1126/science.1089670. doi:10.1126/science.1089670. [DOI] [PubMed] [Google Scholar]
- 6.Bogerd HP, et al. Cellular inhibitors of long interspersed element 1 and Alu retrotransposition. Proc Natl Acad Sci U S A. 2006;103:8780–8785. doi: 10.1073/pnas.0603313103. [DOI] [PMC free article] [PubMed] [Google Scholar]
- 7.Aravin AA, Sachidanandam R, Girard A, Fejes-Toth K, Hannon GJ. Developmentally regulated piRNA clusters implicate MILI in transposon control. Science. 2007;316:744–747. doi: 10.1126/science.1142612. [DOI] [PubMed] [Google Scholar]
- 8.Varki A, Altheide TK. Comparing the human and chimpanzee genomes: searching for needles in a haystack. Genome Res. 2005;15:1746–1758. doi: 10.1101/gr.3737405. [DOI] [PubMed] [Google Scholar]
- 9.Takahashi K, et al. Induction of pluripotent stem cells from adult human fibroblasts by defined factors. Cell. 2007;131:861–872. doi: 10.1016/j.cell.2007.11.019. [DOI] [PubMed] [Google Scholar]
- 10.Yu J, et al. Induced pluripotent stem cell lines derived from human somatic cells. Science. 2007;318:1917–1920. doi: 10.1126/science.1151526. [DOI] [PubMed] [Google Scholar]
- 11.Burns KH, Boeke JD. Human transposon tectonics. Cell. 2012;149:740–752. doi: 10.1016/j.cell.2012.04.019. doi:10.1016/j.cell.2012.04.019. [DOI] [PMC free article] [PubMed] [Google Scholar]
- 12.Kazazian HH., Jr. Mobile elements and disease. Curr Opin Genet Dev. 1998;8:343–350. doi: 10.1016/s0959-437x(98)80092-0. [DOI] [PubMed] [Google Scholar]
- 13.Muotri AR, Marchetto MC, Coufal NG, Gage FH. The necessary junk: new functions for transposable elements. Hum Mol Genet. 2007;16:R159–167. doi: 10.1093/hmg/ddm196. Spec No. 2. [DOI] [PubMed] [Google Scholar]
- 14.Beck CR, Garcia-Perez JL, Badge RM, Moran JV. LINE-1 elements in structural variation and disease. Annual review of genomics and human genetics. 2011;12:187–215. doi: 10.1146/annurev-genom-082509-141802. [DOI] [PMC free article] [PubMed] [Google Scholar]
- 15.Wissing S, Montano M, Garcia-Perez JL, Moran JV, Greene WC. Endogenous APOBEC3B restricts LINE-1 retrotransposition in transformed cells and human embryonic stem cells. J Biol Chem. 2011;286:36427–36437. doi: 10.1074/jbc.M111.251058. [DOI] [PMC free article] [PubMed] [Google Scholar]
- 16.Chiu YL, Greene WC. The APOBEC3 cytidine deaminases: an innate defensive network opposing exogenous retroviruses and endogenous retroelements. Annual review of immunology. 2008;26:317–353. doi: 10.1146/annurev.immunol.26.021607.090350. [DOI] [PubMed] [Google Scholar]
- 17.Chen H, et al. APOBEC3A is a potent inhibitor of adeno-associated virus and retrotransposons. Curr Biol. 2006;16:480–485. doi: 10.1016/j.cub.2006.01.031. [DOI] [PubMed] [Google Scholar]
- 18.Ostertag EM, Prak ET, DeBerardinis RJ, Moran JV, Kazazian HH., Jr. Determination of L1 retrotransposition kinetics in cultured cells. Nucleic Acids Res. 2000;28:1418–1423. doi: 10.1093/nar/28.6.1418. [DOI] [PMC free article] [PubMed] [Google Scholar]
- 19.Xie Y, Rosser JM, Thompson TL, Boeke JD, An W. Characterization of L1 retrotransposition with high-throughput dual-luciferase assays. Nucleic Acids Res. 2011;39:e16. doi: 10.1093/nar/gkq1076. [DOI] [PMC free article] [PubMed] [Google Scholar]
- 20.Garcia-Perez JL, et al. LINE-1 retrotransposition in human embryonic stem cells. Hum Mol Genet. 2007;16:1569–1577. doi: 10.1093/hmg/ddm105. [DOI] [PubMed] [Google Scholar]
- 21.Wissing S, et al. Reprogramming somatic cells into iPS cells activates LINE-1 retroelement mobility. Hum Mol Genet. 2012;21:208–218. doi: 10.1093/hmg/ddr455. [DOI] [PMC free article] [PubMed] [Google Scholar]
- 22.De Fazio S, et al. The endonuclease activity of Mili fuels piRNA amplification that silences LINE1 elements. Nature. 2011;480:259–263. doi: 10.1038/nature10547. [DOI] [PubMed] [Google Scholar]
- 23.Mathews LM, Chi SY, Greenberg N, Ovchinnikov I, Swergold GD. Large differences between LINE-1 amplification rates in the human and chimpanzee lineages. American journal of human genetics. 2003;72:739–748. doi: 10.1086/368275. [DOI] [PMC free article] [PubMed] [Google Scholar]
- 24.Khan H, Smit A, Boissinot S. Molecular evolution and tempo of amplification of human LINE-1 retrotransposons since the origin of primates. Genome Res. 2006;16:78–87. doi: 10.1101/gr.4001406. [DOI] [PMC free article] [PubMed] [Google Scholar]
- 25.Lee J, et al. Different evolutionary fates of recently integrated human and chimpanzee LINE-1 retrotransposons. Gene. 2007;390:18–27. doi: 10.1016/j.gene.2006.08.029. [DOI] [PMC free article] [PubMed] [Google Scholar]
- 26.Mills RE, et al. Recently mobilized transposons in the human and chimpanzee genomes. American journal of human genetics. 2006;78:671–679. doi: 10.1086/501028. [DOI] [PMC free article] [PubMed] [Google Scholar]
- 27.Campbell MC, Tishkoff SA. African genetic diversity: implications for human demographic history, modern human origins, and complex disease mapping. Annual review of genomics and human genetics. 2008;9:403–433. doi: 10.1146/annurev.genom.9.081307.164258. [DOI] [PMC free article] [PubMed] [Google Scholar]
- 28.Gagneux P, et al. Mitochondrial sequences show diverse evolutionary histories of African hominoids. Proc Natl Acad Sci U S A. 1999;96:5077–5082. doi: 10.1073/pnas.96.9.5077. [DOI] [PMC free article] [PubMed] [Google Scholar]
- 29.Bowden R, et al. Genomic tools for evolution and conservation in the chimpanzee: Pan troglodytes ellioti is a genetically distinct population. PLoS genetics. 2012;8:e1002504. doi: 10.1371/journal.pgen.1002504. [DOI] [PMC free article] [PubMed] [Google Scholar]
- 30.Beck CR, et al. LINE-1 retrotransposition activity in human genomes. Cell. 2010;141:1159–1170. doi: 10.1016/j.cell.2010.05.021. [DOI] [PMC free article] [PubMed] [Google Scholar]
- 31.Marchetto MC, et al. A model for neural development and treatment of Rett syndrome using human induced pluripotent stem cells. Cell. 2010;143:527–539. doi: 10.1016/j.cell.2010.10.016. doi:10.1016/j.cell.2010.10.016. [DOI] [PMC free article] [PubMed] [Google Scholar]
- 32.Muotri AR, Nakashima K, Toni N, Sandler VM, Gage FH. Development of functional human embryonic stem cell-derived neurons in mouse brain. Proc Natl Acad Sci U S A. 2005;102:18644–18648. doi: 10.1073/pnas.0509315102. [DOI] [PMC free article] [PubMed] [Google Scholar]
- 33.Landry S, Narvaiza I, Linfesty DC, Weitzman MD. APOBEC3A can activate the DNA damage response and cause cell-cycle arrest. EMBO reports. 2011;12:444–450. doi: 10.1038/embor.2011.46. doi:10.1038/embor.2011.46. [DOI] [PMC free article] [PubMed] [Google Scholar]
- 34.Kidd JM, Newman TL, Tuzun E, Kaul R, Eichler EE. Population stratification of a common APOBEC gene deletion polymorphism. PLoS genetics. 2007;3:e63. doi: 10.1371/journal.pgen.0030063. doi:10.1371/journal.pgen.0030063. [DOI] [PMC free article] [PubMed] [Google Scholar]
- 35.Narvaiza I, et al. Deaminase-independent inhibition of parvoviruses by the APOBEC3A cytidine deaminase. PLoS pathogens. 2009;5:e1000439. doi: 10.1371/journal.ppat.1000439. doi:10.1371/journal.ppat.1000439. [DOI] [PMC free article] [PubMed] [Google Scholar]
- 36.Mizushima S, Nagata S. pEF-BOS, a powerful mammalian expression vector. Nucleic Acids Res. 1990;18:5322. doi: 10.1093/nar/18.17.5322. [DOI] [PMC free article] [PubMed] [Google Scholar]
- 37.Dobin A, et al. STAR: ultrafast universal RNA-seq aligner. Bioinformatics. 2013;29:15–21. doi: 10.1093/bioinformatics/bts635. doi:10.1093/bioinformatics/bts635. [DOI] [PMC free article] [PubMed] [Google Scholar]
- 38.Heinz S, et al. Simple combinations of lineage-determining transcription factors prime cis-regulatory elements required for macrophage and B cell identities. Molecular cell. 2010;38:576–589. doi: 10.1016/j.molcel.2010.05.004. doi:10.1016/j.molcel.2010.05.004. [DOI] [PMC free article] [PubMed] [Google Scholar]
- 39.de Hoon MJ, Imoto S, Nolan J, Miyano S. Open source clustering software. Bioinformatics. 2004;20:1453–1454. doi: 10.1093/bioinformatics/bth078. doi:10.1093/bioinformatics/bth078. [DOI] [PubMed] [Google Scholar]
- 40.Saldanha AJ. Java Treeview--extensible visualization of microarray data. Bioinformatics. 2004;20:3246–3248. doi: 10.1093/bioinformatics/bth349. doi:10.1093/bioinformatics/bth349. [DOI] [PubMed] [Google Scholar]
- 41.Robinson MD, McCarthy DJ, Smyth GK. edgeR: a Bioconductor package for differential expression analysis of digital gene expression data. Bioinformatics. 2010;26:139–140. doi: 10.1093/bioinformatics/btp616. doi:10.1093/bioinformatics/btp616. [DOI] [PMC free article] [PubMed] [Google Scholar]
- 42.Dennis G, Jr., et al. DAVID: Database for Annotation, Visualization, and Integrated Discovery. Genome biology. 2003;4:P3. [PubMed] [Google Scholar]
- 43.Jurka J, et al. Repbase Update, a database of eukaryotic repetitive elements. Cytogenetic and genome research. 2005;110:462–467. doi: 10.1159/000084979. doi:10.1159/000084979. [DOI] [PubMed] [Google Scholar]
- 44.Langmead B, Salzberg SL. Fast gapped-read alignment with Bowtie 2. Nat Methods. 2012;9:357–359. doi: 10.1038/nmeth.1923. doi:10.1038/nmeth.1923. [DOI] [PMC free article] [PubMed] [Google Scholar]
- 45.Sai Lakshmi S, Agrawal S. piRNABank: a web resource on classified and clustered Piwi-interacting RNAs. Nucleic Acids Res. 2008;36:D173–177. doi: 10.1093/nar/gkm696. doi:10.1093/nar/gkm696. [DOI] [PMC free article] [PubMed] [Google Scholar]
- 46.Moran JV, et al. High frequency retrotransposition in cultured mammalian cells. Cell. 1996;87:917–927. doi: 10.1016/s0092-8674(00)81998-4. [DOI] [PubMed] [Google Scholar]
- 47.Bulliard Y, et al. Structure-function analyses point to a polynucleotide-accommodating groove essential for APOBEC3A restriction activities. J Virol. 2011;85:1765–1776. doi: 10.1128/JVI.01651-10. doi:10.1128/JVI.01651-10. [DOI] [PMC free article] [PubMed] [Google Scholar]
- 48.Brouha B, et al. Hot L1s account for the bulk of retrotransposition in the human population. Proc Natl Acad Sci U S A. 2003;100:5280–5285. doi: 10.1073/pnas.0831042100. doi:10.1073/pnas.0831042100. [DOI] [PMC free article] [PubMed] [Google Scholar]
- 49.Penzkofer T, Dandekar T, Zemojtel T. L1Base: from functional annotation to prediction of active LINE-1 elements. Nucleic Acids Res. 2005;33:D498–500. doi: 10.1093/nar/gki044. doi:10.1093/nar/gki044. [DOI] [PMC free article] [PubMed] [Google Scholar]
- 50.Fujita PA, et al. The UCSC Genome Browser database: update 2011. Nucleic Acids Res. 2011;39:D876–882. doi: 10.1093/nar/gkq963. doi:10.1093/nar/gkq963. [DOI] [PMC free article] [PubMed] [Google Scholar]
- 51.Ladewig J, et al. Small molecules enable highly efficient neuronal conversion of human fibroblasts. Nat Methods. 2012;9:575–578. doi: 10.1038/nmeth.1972. doi:10.1038/nmeth.1972. [DOI] [PubMed] [Google Scholar]
Associated Data
This section collects any data citations, data availability statements, or supplementary materials included in this article.