

Abstract
Much effort in recent years has focused on understanding the effects of Alzheimer's disease (AD) on neural function. This effort has resulted in an enormous number of papers describing different facets of the functional derangement seen in AD. A particularly important tool for these investigations has been resting-state functional connectivity. Attempts to comprehensively synthesize resting-state functional connectivity results have focused on the potential utility of functional connectivity as a biomarker for disease risk, disease staging, or prognosis. While these are all appropriate uses of this technique, the purpose of this review is to examine how functional connectivity disruptions inform our understanding of AD pathophysiology. Here, we examine the rationale and methodological considerations behind functional connectivity studies and then provide a critical review of the existing literature. In conclusion, we propose a hypothesis regarding the development and spread of functional connectivity deficits seen in AD.
Key words: : Alzheimer's disease, brain networks, resting-state functional connectivity
Alzheimer's disease (AD) is the most common form of dementia (Blennow et al., 2006) and exhibits a deleterious effect on patients, caregivers, and families, resulting in great social cost (Reitz et al., 2011). No curative treatment exists, and attempts at symptomatic relief are only modestly effective (Mangialasche et al., 2010). For this reason, AD continues to be a major target of both clinical and basic research. Our understanding of large-scale changes in neural behavior due to AD has been fruitfully expanded through the use of resting-state functional connectivity magnetic resonance imaging (rs-fcMRI). Previous attempts at synthesizing this rapidly growing literature have focused on characterizing the nature and extent of network disruptions (Pievani et al., 2011; Sorg et al., 2009; Tijms et al., 2013) and on evaluating the potential diagnostic utility of these techniques (e.g., as a biomarker) (Gomez-Ramirez and Wu, 2014; Hafkemeijer et al., 2012; Matthews et al., 2013; Roman and Pascual, 2012). In this review, we argue that rs-fcMRI has also informed our understanding of the pathogenesis and pathophysiology of AD. To do this, we first place changes in functional connectivity within context of the “disconnection syndrome” model and show how this hypothesis motivates the use of functional connectivity for the investigation of AD pathophysiology. Then, we describe important methodological issues relevant to the synthesis of rs-fcMRI results. This is followed by a summary of the existing AD rs-fcMRI literature. We conclude by proposing a revised model of AD functional changes that seeks to explain these imaging findings.
The Disconnection Syndromes
It was recognized early in the study of neurological disease that, in many cases, focal deficits observed during life are correlated to focal lesions identified postmortem. This led to the idea that specific cognitive functions are supported by discrete neuroanatomic structures. Observations of more complex deficits suggested that regions should coordinate activity to perform more complex tasks (these regions can be said to be “functionally connected”). A “disconnection event” (e.g., a stroke) disconnects one or more functional areas from a task-associated ensemble of functionally connected regions, resulting in a clinically observable “disconnection” syndrome (Geschwind, 1965). AD has been called a disconnection syndrome in many studies (Delbeuck et al., 2003; Stam et al., 2007; Wang et al., 2006), but the applicability of that model has not been conclusively validated. For instance, there is no single focal lesion in AD and it remains unclear if and when disrupted regions become completely non-functional as seen in many classic disconnection syndromes. The principal limitation of previous approaches has been that they were autopsy based, limiting our understanding of the early disease process. Recently, many techniques for assessing connectivity in vivo have been developed.
Functional Connectivity
Resting-state functional connectivity offers one way to assess the integrity of communication between two functionally related brain regions. Functional connectivity describes the co-varying activity profiles of topographically dispersed brain regions (Biswal et al., 1995). Compared with structural connectivity (computed from white-matter tractography or other methods), functional connectivity provides a dynamic picture of brain activity (Keller et al., 2013). One might predict that functional connectivity is determined by the pattern of structural connections. However, only a fraction of functional connectivity is explained by the underlying structural connectivity (Adachi et al., 2012). One method for determining functional connectivity is the blood oxygen level-dependent (BOLD) response, which is a proxy measure for neural processing (Ogawa et al., 1993) [for a comprehensive review, see Logothetis (2002)]. Functionally connected regions can be organized into resting-state networks (RSNs) (Fox and Raichle, 2007). RSNs are clusters of brain regions that are highly functionally connected to each other but less functionally connected to regions from other RSNs (Lee et al., 2012). The advantages and disadvantages of rs-fcMRI have been previously reviewed (Cabral et al., 2014; Fox and Raichle, 2007; Raichle, 2011). The researcher can use this technique to derive information about functional connectivity between two brain regions, within a clustered set of brain regions (e.g., an RSN) or across the entire brain.
Methodological Considerations
Despite the ease of rs-fcMRI acquisition, there are several important methodological considerations in the analysis of functional connectivity data that can impact the interpretation of results. We briefly summarize the most important issues before returning to our discussion of AD-related alterations in functional connectivity.
Seed-based compared with independent component analysis-based methods
Two principal methods are used for calculating functional connectivity: seed-based analysis and independent component analysis (ICA). Seed-based approaches depend on an a priori definition of a set of regions of interest (ROI). ICA derives network definitions in a data-driven fashion. The results of these analytic approaches can then be used in modeling approaches, notably graph theoretic measures or related quantities. Each approach has strengths and weaknesses depending on the research question.
Seed-based analyses generally sample either a set of ROIs distributed across the entire brain or a specific set of a priori ROIs of experimental interest (Damoiseaux et al., 2006; Shehzad et al., 2009). ROIs are generally either a simple geometric shape (e.g., spherical) or based on anatomical segmentation. The mean BOLD time series (or some other representative quantity) is extracted from these ROIs, and the correlation coefficient is calculated either between ROIs or between a single ROI and every other voxel. These measures can then be compared with an independent variable (e.g., disease status). An important consideration in the use of seed-based analyses is that the ROI set used in the analysis captures the effect of interest, and the ROIs are of an appropriate scale so as to not only reduce noise but also avoid averaging across distinct signals. For example, anatomically based ROI schemes often average across large regions of the brain and thus reduce sampling error, but may not respect functional divisions. Attempts at functional parcellation can create ROIs that are functionally distinct, but may not average over a sufficiently large number of voxels for identification of a stable time series.
In ICA (Beckmann et al., 2005; Calhoun et al., 2001), imaging data are arranged as a time-point by voxel matrix (or the transpose) and decomposed into spatially or temporally independent components. Components spatially matching the known topography of an RSN are retained, and those matching known sources of noise (e.g., ventricles) are discarded. Noise components are identified based on their topography (e.g., being focal in the ventricles or having a rim near the skull) or on the properties of their time courses (e.g., being highly correlated with movement or being white noise). The number of components retained can influence whether RSNs are evaluated as integrated wholes or separated into component parts (e.g., anterior and posterior components of the same network) (Damoiseaux et al., 2012). This approach provides a factor score for each voxel with this value compared against an independent variable. This approach can result in a number of summary statistics such as the goodness-of-fit metric (Greicius et al., 2004) or dual regression (Beckmann et al., 2005).
Once functional connectivity is defined, it can be modeled using higher-level mathematical models. A more recent method that has been used in the AD literature is graph theory (Bullmore and Sporns, 2009). In graph theory, the brain is modeled as a collection of nodes (brain regions) and edges (functional connections). This enables summary quantities to be calculated that reflect the organization of the graph at the global or local level. Further descriptions of these metrics are given below.
Each approach has strengths and weaknesses that make them more or less applicable to specific scientific problems. A few of the more prominent and commonly discussed considerations are summarized in Table 1. While these methods are among the most popular, other analysis methods exist to assess other aspects of the BOLD signal at rest, such as the amplitude of low-frequency fluctuations (Liu et al., 2008; Zou et al., 2008).
Table 1.
Comparison of Seed-Based and Independent Component Analysis-Based Methods
| Seed based | ICA based | |
|---|---|---|
| A priori assumptions | Experimental priors define ROI for functional connectivity analysis | Data-driven algorithm isolates collections of voxels with similar time series without experimental priors |
| Statistics | General linear models | Dual regression |
| Identification of RSNs | A priori assignment of seeds | Component pattern matching |
| Analytic decisions | Location of seeds, type of dependence measure used, and preprocessing steps | Number of factors retained, identification of nuisance signals, and preprocessing steps |
| Key assumptions | ROIs sufficiently sample the topography of the effect of interest and are the appropriate level of spatial resolution | RSNs or effects of interest are decomposable into spatially and/or temporally independent components |
| Definition of RSNs | ROIs are either assigned to RSNs a priori or are assigned through some clustering algorithm | Number of ICA components is specified a priori, which can affect how networks are divided or defined |
ICA, independent component analysis; ROI, regions of interest; RSN, resting-state network.
Subject movement
In the past several years, researchers have become keenly aware of the dramatic effect of movement on functional connectivity. The “movement artifact” is usually characterized as spuriously increased functional connectivity (particularly local) (Power et al., 2012; Van Dijk et al., 2012). This artifact is not able to be removed using ordinary movement regression procedures, necessitating the removal of movement-contaminated frames (or volumes) from subject scans (Power et al., 2012). The frame-removal process has been refined (Power et al., 2013a), but a gold-standard approach has not yet been developed. Studies that do not account for this artifact or make an effort to address it should be interpreted with caution, especially given that different movement profiles between study groups have been shown to cause spurious group differences.
At this time, the movement confound is reduced using two principal approaches: (1) regression of movement time series and (2) removal of movement contaminated frames. It is likely that these approaches do not remove the entire artifact (see discussion of Global Signal Regression section). Recently, a new artifact relevant to this process has been described as follows. In many studies, the movement regressors are extracted but not regressed from the BOLD signal until after band-pass filtering. This can result in “spectral misspecification,” where previously filtered frequencies are reintroduced into the signal, thereby reducing the effectiveness of the general regression (Hallquist et al., 2013). While the effect of this confound on group comparisons remains unknown, this approach emphasizes the importance of considering the unintended consequences of preprocessing procedures.
Global signal regression
As of this writing, the global signal regression (GSR) preprocessing step is the most contentious analytic decision in the processing of rs-fcMRI data. The global signal is simply the BOLD time series averaged across all brain voxels, usually within a whole brain mask. This signal is then regressed out as a signal of non-interest along with the movement parameters and biological signals considered noise [e.g., BOLD signal in the cerebral spinal fluid (CSF)]. This step is beneficial because it reduces non-neural variance related to residual movement, changes in pCO2, and other sources while also removing widely shared neural variance (Fox et al., 2005). After GSR, the remaining calculated correlations are effectively first-order partial correlations accounting for widely shared variance (Hacker et al., 2013). A necessary fact of this process is that the remaining correlations have 0 mean and negative (anti-) correlations become more prominent. This process has been criticized for creating “artificial” negative correlations (Murphy et al., 2009) that are difficult to interpret (Yeo et al., 2011). However, GSR is known to improve the spatial specificity of results (Fox et al., 2009) and faithfully reproduces negative correlations that exist in electrophysiology recorded on the brain surface (Keller et al., 2013). Recent work has also demonstrated that the GSR step reduces the dependency of rs-fcMRI on movement, which is a strong argument for its inclusion in data preprocessing (Power et al., 2013a). Notably, ICA approaches can avoid this step entirely.
In part due to the controversial nature of GSR, several approaches have been developed in an attempt to achieve the same noise reduction properties of GSR while avoiding potential problems associated with this technique. Some of these methods focus on removing the effects of physiologic fluctuations (e.g., heart rate, respiration rate, and pCO2) from the BOLD time series (Behzadi et al., 2007; Glover et al., 2000). Importantly, these methods have shown that negative correlations between RSNs can be recovered even without GSR (Chai et al., 2012). This work motivates future efforts that will investigate the contribution of neural and non-neural (artifactual) components to the global BOLD signal.
Definition of RSNs
In what follows, we will focus on the brain organized by RSNs; however, RSNs are not always clearly demarcated and may have distinct subcomponents. This may result from (1) methodological differences and (2) actual neurobiology. With regard to the first, different approaches have shown that RSN topographies are highly reproducible across individuals but some differences may exist (Hacker et al., 2013; Lee et al., 2012; Wig et al., 2013). This issue is discussed in a recent review (Wig et al., 2014). With regard to the second, one of the earlier studies (Lee et al., 2012) found that RSNs could be organized hierarchically in which one RSN (e.g., the attention network) could be divided into dorsal and ventral components. Further, several networks had left and right distinctions. This suggests that all RSNs may not be unitary entities, but may require more complicated definitions.
Now that we have described how functional connections can be measured using resting-state functional connectivity, we will explore how this information can be used to further our understanding of AD pathophysiology.
AD Staging
The discussion of AD necessarily involves the definition of terms with regard to the staging of the disease. Despite recent attempts to standardize disease staging, the extant literature contains many different standards for staging preclinical (presymptomatic) and clinical (symptomatic) AD. We adopt the following for this review based on recently developed models (Jack et al., 2010, 2013). First, the AD process can be broadly divided into two stages (Fig. 1): preclinical and clinical disease. During the preclinical period, pathology accumulates in the absence of symptoms (Price et al., 2009). This pathological accumulation can be detected using positron emission tomography (PET) imaging of amyloid (Klunk et al., 2004) or biochemical analysis of the CSF (Fagan and Holtzman, 2010). Preclinical AD can be further subdivided (Sperling et al., 2011). Stage 0 was defined as the absence of all detectable AD-related pathology. Stage 1 was defined as the presence of amyloid pathology. Stage 2 was defined as the presence of amyloid pathology and evidence of neurodegeneration [i.e., evidence of tau pathology, atrophy (e.g., hippocampus), or metabolic disruptions (e.g., fluorodeoxyglucose PET)]. Stage 3 was defined as mild (but detectable) neurocognitive deficits in addition to the presence of amyloid and neurodegenerative pathology. Individuals with stage 3 cognitive deficits are not sufficiently impaired to warrant a diagnosis of clinical AD. Clinical AD can be staged using the Clinical Dementia Rating (CDR) (Morris, 1993). Using the CDR scheme, a CDR 0.5 often refers to very mild cognitive impairment due to AD (Albert et al., 2011; Morris et al., 2014). The CDR can assume values of 0.5, 1, 2, and 3 corresponding to increasing severity of AD.
FIG. 1.
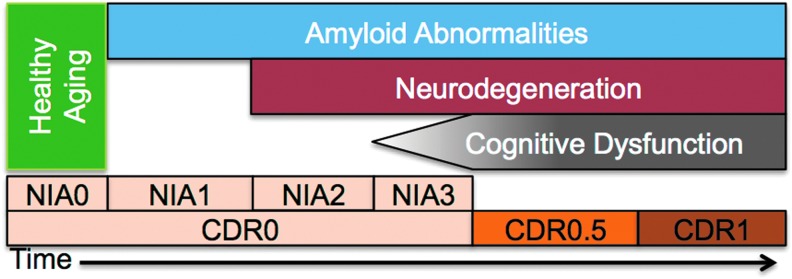
Schematic of Alzheimer's disease (AD) staging. Progression of AD is modeled in terms of amyloid abnormalities [measured via cerebrospinal fluid or PiB positron emission tomography (PET)], neurodegeneration (tau pathology or hippocampal atrophy), and cognitive dysfunction (measured by neuropsychological testing or clinical exam). The ordering of these biomarkers is based on prominent models in the field (Jack et al., 2010, 2013). Two classification schemes [Clinical Dementia Rating (CDR) and NIA] are incorporated here. The CDR indexes the presence or absence of dementia and scales its severity. The NIA criteria stage the presence of pathology in the absence of overt clinical symptoms. The absence of any of these three biomarkers is termed “healthy aging.” NIA1–3 is termed “preclinical AD” and CDR>0 is termed “clinical AD.” PiB, Pittsburgh compound B.
Functional Connectivity in Preclinical AD
Preclinical AD is the period during which histopathology accumulates in the absence of overt clinical symptoms. While it is true by definition that there are no overt symptoms present during this phase, it is unclear if and to what extent there is neural dysfunction at this stage. According to most models (Jack et al., 2013), the earliest detectable change in the AD brain is the presence of amyloid pathology. Based on this, several investigations have focused on evaluating whether cognitively normal individuals who have amyloid pathology have different functional connectivity compared with those without pathology.
The default mode network (DMN) is a constellation of brain regions of particular importance in AD, because there is a considerable, though not complete, correspondence between end-stage amyloid deposition and DMN topography (Buckner et al., 2005). The DMN is most active at rest, when the brain is in its “default” state (Raichle et al., 2001). The structural and functional anatomy of the DMN, as well as a discussion about its relevance to cognition and disease, is reviewed extensively elsewhere (Buckner et al., 2008; Raichle and Snyder, 2007). Cognitively normal older adults with evidence of amyloid deposition (as detected by amyloid imaging or as inferred from CSF levels of Aβ42) have decreased functional connectivity in the DMN compared with those without amyloid deposition (Sheline et al., 2010b). Recent work has detected a linear relationship between amyloid burden and functional connectivity derangement (Hedden et al., 2009). However, some regions outside the DMN (particularly frontal regions) demonstrate increased functional connectivity in amyloid-positive patients (Mormino et al., 2011). These increases have been attributed to compensation, but it is also possible that they represent excitotoxicity related to amyloid pathology early in the disease process. Finally, these findings have been generalized by showing that changes in functional connectivity are focused on disrupting “hub” regions that are particularly important for functionally connecting many brain regions (Drzezga et al., 2011). This collection of studies has a strong and common theme: amyloid deposition results in disruption of DMN functional connectivity. Thus, it is likely that amyloid deposition is sufficient for the disruption of at least some of the brain's large-scale coordination.
One criticism of this approach is that amyloid deposition can be seen in other diseases and not all individuals with amyloid deposition develop symptomatic AD before death. Work in dominantly inherited AD helps address some of these concerns. Individuals with mutations in one of three genes (PSEN1, PSEN2, and APP) will develop AD at a young age with 100% penetrance and almost no anticipation. Thus, researchers can investigate the relationship between amyloid deposition and functional connectivity in individuals who will certainly develop AD (due to their mutation status) but are unlikely (as a function of their young age) to have other neurodegenerative conditions. Mutation carriers who were years away from expected age of symptom onset but who already had amyloid deposition (Bateman et al., 2012) were noted to have decreased functional connectivity in the DMN either before (Chhatwal et al., 2013) or concurrent with (Thomas et al., 2013) symptom onset, confirming the previous results in sporadic AD. Together, this represents strong evidence that amyloid deposition results in functional connectivity deficits in the DMN that are related to AD.
Amyloid is only one component of AD pathology: both amyloid and tau pathology are needed for AD symptoms to develop. While amyloid imaging has facilitated the direct comparison of amyloid topography and functional connectivity, tau-imaging agents have been unavailable until recently (Chien et al., 2013; Fodero-Tavoletti et al., 2011; Maruyama et al., 2013; Small et al., 2006). Thus, studies investigating the relationship between tau and functional connectivity have been limited to CSF-derived measures that have no topography. Investigations of this relationship have found that CSF amyloid and tau independently contribute to disruption between the posterior cingulate cortex (PCC) and the medial temporal lobe (Wang et al., 2013b). This strongly suggests that the two pathologies contribute uniquely to this dysfunction. Interestingly, the PCC is a prominent location for amyloid pathology (Braak and Braak, 1991), and the medial temporal lobe is an epicenter of tau pathology (Braak et al., 2011). An additional investigation found that the amyloid/tau ratio was correlated with functional connectivity in the PCC (Li et al., 2013). Before these studies, it was unknown whether the observed amyloid effect was due to amyloid alone or whether it was due to the combination of amyloid and tau pathologies. In fact, both contribute independently to observed functional connectivity deficits. Together, these studies demonstrate that both amyloid and tau levels are related to changes in functional connectivity.
These studies suggest that during the preclinical phase of AD, significant dysfunction accumulates in the DMN. This is evidence for neural dysfunction during a period when there are no overt cognitive symptoms. Questions remain as to how this dysfunction begins, how it impacts other networks, and how this dysfunction is related to the development of cognitive symptoms.
Functional Connectivity in Those at Genetic Risk of AD
Individuals may be genetically predisposed to develop AD. The most potent risk factor for AD (apart from monogenetic causative mutations, discussed earlier) is the ApoE ɛ4 allele (Roses, 1996). This is associated with a 4- to 12-fold increase in lifetime disease risk. Carriers of this allele show decreased DMN functional connectivity similar to that seen in preclinical AD in the absence of detectable pathology (Sheline et al., 2010a). Interestingly, increased functional connectivity is seen in frontal regions of the salience network in ApoE carriers (Machulda et al., 2011). This has led some to hypothesize early compensation or disinhibition (Seeley, 2012). Both the Sheline and Machulda studies investigated older adults; however similar results have also been seen in younger carriers with ɛ4 the allele (Filippini et al., 2009). These results suggest an effect of the ɛ4 allele on brain function across the lifespan. Finally, while the ApoE effect is certainly the strongest risk factor, additional genetic risk factors exist. Many of these genetic risk factors are not described explicitly, but can be captured through investigating the family history of AD. The presence of a family history of AD is associated with decreased DMN functional connectivity. In fact, this effect is independent of ApoE status, suggesting a unique contribution of additional genetic risk factors (Wang et al., 2012). Together, these results suggest that an increased genetic risk of AD is sufficient to disrupt brain function in the brain networks commonly impacted by AD.
Default-Mode Dysfunction in Symptomatic AD
Functional connectivity studies in preclinical AD have focused on the DMN primarily because changes were observed in this network in the mild-moderate (Greicius et al., 2004) and very mild AD (Sorg et al., 2007) populations. These findings in clinical AD were particularly compelling, because the topography of the DMN was seen to have a relatively similar overlap with the patterns of amyloid deposition, glucose hypometabolism, and memory network dysfunction seen in symptomatic AD (Buckner et al., 2005).
After these studies established the link between DMN dysfunction and AD, researchers next worked to establish whether dysfunction in the DMN was binary or parametric in disease severity. Two studies investigated this question and both found that DMN functional connectivity decreased parametrically with disease severity (Brier et al., 2012; Zhang et al., 2010). Other studies focusing on functional connectivity using the PCC (a component of the DMN) as a seed found similar results, but some studies also observed increased positive functional connectivity from regions in the DMN to regions outside the DMN, primarily in frontal areas (Zhang et al., 2009). Other studies using the hippocampus (HC) as a seed (another component of the DMN) found that the HC becomes disconnected from the rest of the brain (Allen et al., 2007; Wang et al., 2006) early in the symptomatic disease process. Early symptomatic AD has been shown to particularly affect connections between the PCC and HC (Zhou et al., 2008). Together, these data suggest that DMN dysfunction develops progressively throughout the course of AD with a particular predilection for the connections between the PCC, HC, and the rest of the DMN.
While the DMN is a prominent and strongly connected network, it can be subdivided into two or three sub-networks. Investigators have used this fractionation to study the effects of AD with more spatial specificity. For example, while the posterior components of the DMN show loss in functional connectivity with AD, the anterior components show higher functional connectivity early in the disease (Jones et al., 2011). These results conflict with the prevailing evidence, suggesting that DMN functional connectivity declines in AD. Interestingly, a longitudinal study demonstrated increases within the anterior DMN early in disease. However, with disease progression, these anterior DMN areas had reduced functional connectivity in later-stage AD (Damoiseaux et al., 2012). This may suggest that observed increases are transient and its relevance to pathophysiology remains unclear. Patterns of changes are not entirely unitary in the posterior portions of the DMN either: different parts of the PCC have demonstrated differential functional connectivity disruption with AD (Xia et al., 2014). Taken together, these data suggest that while DMN dysfunction is a hallmark of AD, DMN dysfunction does not develop all at once and has spatiotemporal dynamics with regard to symptom severity.
Throughout the course of AD, from the preclinical to clinical stage, DMN dysfunction accumulates and functional connectivity between many DMN member regions is reduced. The exact sequence of regional disconnection in the DMN is unclear, but it appears that DMN regions do not disconnect simultaneously. The few studies that have tried to understand the sequence of changes suggest that dysfunction begins in the posterior regions, then affects the HC, and finally disrupts functional connections among the anterior aspects of the DMN. Notably, several of the earlier referenced studies indicated dysfunction outside the DMN (Sorg et al., 2007), which is the focus of the next few sections.
Network Disruptions Beyond the DMN
While dysfunction in the DMN is a prominent feature of AD at all stages, functional connectivity changes are not limited to the DMN. Using a high-dimensional seed-based analysis method, it was found that many brain regions demonstrate disrupted (both increased and decreased) functional connectivity in AD (Wang et al., 2007). It was later clarified using RSN classifications that AD is associated with decreased DMN functional connectivity but increased functional connectivity in a set of regions is known as the salience network (Zhou et al., 2010). The salience network is anchored in the dorsal anterior cingulate and consists primarily of frontal and parietal regions. Observed salience network increases are interesting, because they oppose the widely established theme that pathologic processes tend to result in decreased functional connectivity. In a cross-sectional study, our group has replicated this observation of increased functional connectivity in the salience network, though we showed the increase to be transient (Brier et al., 2012) (similar to the observed transience of anterior DMN increases discussed in the previous section); that is, the salience network (and certain anterior portions of the DMN) shows increased functional connectivity early in AD but then reduced functional connectivity later in the disease.
Brier et al. (2012) also showed that very mild and mild to moderate AD are associated with decreased functional connectivity in several other RSNs. Specifically, at the very mild AD stage, we observed increased salience network functional connectivity, and no change in the dorsal attention network, but we observed decreased functional connectivity in the DMN, executive control, and sensori-motor networks. At the mild-moderate AD stage, all networks showed decreased functional connectivity (Brier et al., 2012). This result was interesting, because many of the implicated brain regions manifested functional disruption even though they have not traditionally been implicated in studies of end-stage AD histopathology (see Fig. 2 discussed next). The mechanism by which the functional disruption “out runs” the histopathology remains unclear. One suggestion is based on the observation that not only are “within network” functional connections affected by AD, but also selected “between network” functional connections are disrupted (Brier et al., 2012). It is possible that network dysfunction spreads between networks along diseased connections through propagation of disordered communication (e.g., Hebbian dynamics) (Saper et al., 1987). This idea has its basis in the prion literature (de Calignon et al., 2012; Frost et al., 2009), which is summarized in a recent review (Kaufman and Diamond, 2013). The convergence of these results has led to the proposal that AD and other neurodegenerative conditions derive their pathological severity from their ability to exploit network dynamics (Seeley et al., 2009; Zhou et al., 2012). This focus on network dynamics has led to a new way of modeling the functional connections of the brain.
FIG. 2.
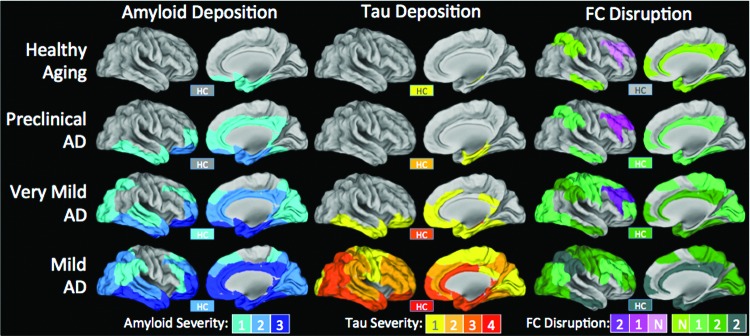
Summary maps of the extent and magnitude of amyloid and tau deposition and functional connectivity disruption parametric on disease severity. In both amyloid and tau columns, color indicates intensity of deposition as previously described (Braak and Braak, 1991; Thal et al., 2002). Amyloid patterns in preclinical AD are based on longitudinal PiB PET studies (Okello et al., 2009; Villemagne et al., 2011). Since tau imaging data do not currently exist (i.e., no longitudinal follow up in pathological studies), it is impossible to determine the topography in patients who would eventually develop clinical AD, so that each data point is omitted. Clinicopathological correlation for amyloid (Braak and Braak, 1991) and tau (Nelson et al., 2009) is based on previous studies. Functional connectivity can either be increased (pink/purple) or decreased (green-grey). No formalization for intensity of functional connectivity deficits exists, so colors indicate number of consecutive disease stages in which greater abnormalities are detected. For example, if FC in a particular region decreases in two consecutive AD stages, the value would be −2. This attempts to synthesize the entire literature but is particularly based on Zhou et al. (2010), Brier et al. (2012), Wang et al. (2013b). These effects are compared with age-matched controls. While aging alone is associated with some change in functional connectivity (Andrews-Hanna et al., 2007), observed changes due to AD are above and beyond changes typically associated with aging. Note: The hippocampus (HC) is shown in a box labeled “HC,” because it is not visible on these surface projections. FC, functional connectivity.
Application of “Network Science” to Functional Connectivity
The previous sections have dealt with functional connectivity between pairs of brain regions or sets of brain regions. Recent studies have begun to model the dynamics of the entire brain network simultaneously. The mathematical field of graph theory enables the investigation of whole-network properties by modeling the brain as a collection of “nodes” (ROIs) and “edges” (functional connectivity relationships between ROIs). Graph models may be more sensitive to subtle changes in brain function, because they enable aggregate network changes to be characterized with simple measures. The ability to measure global changes is not without cost, however, and graph theory measures may obscure focal changes between particular ROIs.
Two particularly common network measures that have been used in the AD literature are clustering coefficient (a measure of how well a node can pass information among nodes with which it is connected) and path length (how far apart on average a given node is from all other nodes of the brain network). Graphs that are highly clustered but have a relatively low path length are said to be “small-world” and have the advantage of being efficiently connected while maintaining a few long-range (and thus expensive) connections (Watts and Strogatz, 1998). Functional connectivity in normal humans was shown to exhibit small world character (Salvador et al., 2005), and it was hypothesized that this organizational property was required for normal cognition. A recent review (Tijms et al., 2013) described several studies that explored disruptions in this small-world organization in preclinical and clinical AD (Brier et al., 2014; Ciftci, 2011; Sanz-Arigita et al., 2010; Supekar et al., 2008; Wang et al., 2013a). While results in these studies varied, each described AD-associated disruptions in whole-brain small-world organization. These results give further evidence that AD disrupts network organization at a whole brain level, not just in specific systems.
An important consequence of small-world organization is that some nodes are very highly connected while others are sparsely connected. These highly connected regions are called “hubs” and are of particular importance in a network. It was shown very early on in the study of AD that hubs may be of particular importance in disease pathogenesis (Buckner et al., 2009). As the field has progressed, the definition of hub regions has been challenged and refined (Power et al., 2013b), but their theoretical importance remains. In fact, a recent study showed that while whole brain network organization was disrupted in preclinical AD, hub dysfunction was only detectable once symptoms were present (Brier et al., 2014). This suggests that the integrity of hub function is critical to the generation of normal cognition.
While some debate exists over the applicability of graph measures to functional connectivity data (Power et al., 2013b), graph techniques hold great promise for understanding network-centric pathophysiological processes. Graph theory approaches, whether investigating small-world characteristics (clustering coefficient, path length) or node importance (“hubness”), will continue to assist researchers in establishing how RSNs degrade with pathology and how other yet-unaffected brain regions adapt. Graph theory provides a computational framework in which to model these brain changes and generate new hypotheses.
Summary of Current Literature
Based on this review of the extant literature, there are several summary points that motivate further discussion. Dysfunction begins in the DMN, a set of regions that partially overlaps with amyloid deposition. It is likely that the amyloid deposition plays a causative role in DMN dysfunction (Bero et al., 2011, 2012). The timing of this dysfunction is still debated, but it certainly begins during the preclinical period. During the early stage of the clinical disease period, DMN dysfunction becomes more pronounced and, notably, this dysfunction spreads to other networks and even impacts the connections between networks. The key observation is that if one compares the topography of network dysfunction to the topography of amyloid and tau pathology, one finds that the network dysfunction is not spatially coterminous with amyloid or tau pathology (Fig. 2). That is to say, there are regions with functional connectivity disruptions which are not strongly affected by amyloid or tau, and there are regions that are strongly affected by amyloid and tau where functional connectivity disruptions are not prominent. In what follows, we reconcile this observation with the original “disconnection syndrome” hypothesis.
A Network Model of AD Pathophysiology
The field initially adopted functional connectivity methods based on the hypothesis that changes in brain connectivity may be associated with the cognitive changes seen in AD. It had been previously thought that AD might follow a “disconnection” model of disease (Delbeuck et al., 2003). The disconnection model considers disconnection to be a fully resolved event: in a “disconnection event,” disease causes a lesion to an area, leading to a reduction in communication between two brain regions, thus removing the neural communication required for healthy cognitive functioning.
To interpret AD pathology through this model, it had been posited that amyloid and/or tau cause a toxic milieu that disconnects previously connected brain regions and causes observed memory deficits. Functional connectivity was adopted as a method to quantify the extent of disconnection. Established relationships between losses in functional connectivity and cognitive symptoms (Duchek et al., 2013) provide strong evidence in support of this model. However, two observations discussed in this review suggest that the disconnection model needs to be adapted to better fit our understanding of actual AD pathophysiology.
First, in AD, brain regions are affected progressively. This means that pathology accumulates and dysfunction develops gradually over time. Individual brain regions are not summarily removed from the network in a single insult, but instead gradually deteriorate as pathology accumulates over years. Throughout the span of an AD individual's disease course, regions remain in a semi-functional state of increasingly impaired function. This enables the diseased region to interact with the still-intact parts of the network. It is, therefore, plausible that this diseased region can propagate dysfunction through its interactions with other healthy regions, through a process similar to Hebbian dynamics.
The second observation is that many functional systems largely distinct from sites of pathological accumulation also become impaired. In any AD disease stage, the topography of functional connectivity deficits cannot be fully explained by the topography of amyloid and tau pathology. Indeed, functional changes are more expansive. However, the topography of these unexplained functional changes is highly correlated with known RSNs (Brier et al., 2012). Given the topography, we hypothesize that this is not by chance. Rather, disordered inputs coming from nodes affected by tau/amyloid impact and disrupt previously unaffected nodes in multiple other brain networks. Regions that receive disordered inputs themselves develop disordered outputs and then spread disorder recursively along other functional connectivity relationships to other healthy regions.
Thus, we propose modifications to the original model (Fig. 3). For reasons that are not entirely clear, amyloid and tau pathology develop progressively in a restricted set of brain regions, inducing neural dysfunction in these regions. At this point, two processes occur in parallel (but not necessarily independently). First, amyloid and tau pathology spread through a fairly well-described network of regions (Braak and Braak, 1991). This induces direct neural dysfunction in those regions to which pathology spreads. This causes some degree of disconnection, but notably not absolute disconnection (i.e., the affected brain regions are not immediately completely destroyed). As described earlier, neither the initial hit nor the network spread of pathology fully account for all observed dysfunction and changes in functional connectivity.
FIG. 3.

Network models of brain function in AD. (A) A sample of a potential brain network containing four distinct functional regions (A–D). Region A receives inputs from other parts of the brain not depicted (large arrow) and projects to regions B and C (small arrows), which also receive inputs from other brain regions not depicted (large arrows). Brain regions (B and C) then project to region D (small arrows), which also receives inputs from other parts of the brain (large arrows). Each of these brain regions is healthy (denoted by green color) and the connections are intact (solid black lines for arrows). (B) Disconnection model. In this model, a pathological insult (lightning bolt) affects a single brain region (region A) that is completely destroyed (red color). The connections from region A to regions B and C are rendered non-functional (dotted line). In this model, the insult to region A is a fully resolved event and region A no longer contributes to the network. Regions B and C still receive inputs from the rest of the brain and communicate with region D. The observable deficits are strictly related to region A and do not progress. (C) In the proposed model, a similar insult occurs in region A; however, the region is not rendered completely silent (partial green color) and continues to communicate with regions (B and C) in a disrupted way, leading to induction of dysfunction in regions (B and C). In addition, it is known that histopathology can spread along physical connections (blue star). These two processes may overlap and may be additive (e.g., region B). The newly affected regions then provide disrupted output to region D.
To account for those unexplained disruptions, we propose a second process. The directly affected brain regions continue to send and receive input, but in a disrupted manner. Thus, their outputs are disrupted. These regions send disordered information to regions they typically communicate with in health (namely, within a RSN) and over time, they cause dysfunction in additional regions (notably, these additionally affected regions are now able to spread disordered communications further throughout the brain). Gradually, dysfunction also spreads between RSNs, but at a slower rate. These two processes progress in this way, leading to accumulation of histopathology in a restricted set of anatomical regions and functional disruptions in broadly distributed and topographically distinct functional networks. Of course, these processes sometimes converge and interact, which may further accelerate brain degradation.
While this model is highly speculative, we offer the following evidence in support of its plausibility. First, RSNs tend to become dysfunctional together (Brier et al., 2012). This would suggest that highly connected regions tend to behave as a group, which is consistent with a process that is dependent on the density of functional connectivity in that group. In our model, regions that are highly connected will cause dysfunction to rapidly spread among them. Second, we note that several studies have identified disrupted functional connectivity between RSNs; that is, between a region in one RSN and another region in a different RSN (Brier et al., 2012; Wang et al., 2007). Anecdotally, many of these between-RSN disruptions are between networks affected early in the disease (e.g., DMN) and networks affected later (e.g., dorsal attention). This preliminary evidence is consistent with the model, but direct tests of this hypothesis should be performed. Specifically, longitudinal analyses of data sets currently being acquired could test the hypothesis of predictable disease spread based on current disease status. In addition, new analysis techniques that increase spatial specificity and relate those changes to underlying histopathology will shed new light on how AD develops and spreads.
Our proposed model is similar to others in the literature, but has important differences. The model we describe here adapts the disconnection hypothesis and employs Hebbian theory. This model does not make strong statements about the progression of histopathology in the form of amyloid or tau, though those dynamics are consistent with a network spread of pathology (Kaufman and Diamond, 2013). One model of particular interest is the “nexopathy” model of disease progression (Warren et al., 2012b). In this model, it is proposed that molecular disease factors interact with the properties of brain networks (e.g., RSNs) to produce disease. Importantly, this model proposes that “[t]he rapidity of network breakdown might depend on the relative proportion of connection types [long range vs. local] affected by the pathological process” (Warren et al., 2013). The present model concurs with this approach and extends it by suggesting that the disruption of the network itself may further exacerbate the spread of dysfunction. The extent to which each model is accurate should be tested in future studies.
A significant challenge facing all models of AD development, progression, and treatment is the existence of distinct phenotypic variations, including posterior cortical atrophy, logopenic primary progressive aphasia, and frontal AD (Warren et al., 2012a). These distinct phenotypes are associated with potentially distinct functional connectivity profiles (Lehmann et al., 2013). Future work should explicitly account for phenotypic variation in order to accurately characterize disease progression and to avoid obscuring interesting phenomena through averaging.
Conclusions and Future Directions
Here, we reviewed the existing functional connectivity literature and proposed a new model to account for the many observations made. These results highlight the need for additional work investigating functional connectivity changes across the disease spectrum. The existing literature and our model of disease spread highlight the need for network-centric approaches to understanding AD as well as for the development of metrics that enable more focal evaluation of single region dysfunction. Future projects combining those approaches with a new understanding of AD pathological processes may provide valuable insights into how AD originates, how it spreads, and how it disrupts the human brain.
Acknowledgments
The authors would like to thank Abraham Z. Snyder and Liang Wang for their helpful discussions. This work was supported by the Alzheimer's Association New Investigator grant (NIRP 12 257747) as well as by NIH grants (R01NR014449, R01NR012657, R01NR012907, and R21MH099979).
Author Disclosure Statement
M.R.B., J.B.T., and B.M.A. have no conflicts of interest.
References
- Adachi Y, Osada T, Sporns O, Watanabe T, Matsui T, Miyamoto K, Miyashita Y. 2012. Functional connectivity between anatomically unconnected areas is shaped by collective network-level effects in the macaque cortex. Cerebral cortex 22:1586–1592 [DOI] [PubMed] [Google Scholar]
- Albert MS, DeKosky ST, Dickson D, Dubois B, Feldman HH, Fox NC, Gamst A, Holtzman DM, Jagust WJ, Petersen RC, Snyder PJ, Carrillo MC, Thies B, Phelps CH. 2011. The diagnosis of mild cognitive impairment due to Alzheimer's disease: recommendations from the National Institute on Aging-Alzheimer's Association workgroups on diagnostic guidelines for Alzheimer's disease. Alzheimers Dement 7:270–279 [DOI] [PMC free article] [PubMed] [Google Scholar]
- Allen G, Barnard H, McColl R, Hester AL, Fields JA, Weiner MF, Ringe WK, Lipton AM, Brooker M, McDonald E, Rubin CD, Cullum CM. 2007. Reduced hippocampal functional connectivity in Alzheimer disease. Arch Neurol 64:1482–1487 [DOI] [PubMed] [Google Scholar]
- Andrews-Hanna JR, Snyder AZ, Vincent JL, Lustig C, Head D, Raichle ME, Buckner RL. 2007. Disruption of large-scale brain systems in advanced aging. Neuron 56:924–935 [DOI] [PMC free article] [PubMed] [Google Scholar]
- Bateman RJ, Xiong C, Benzinger TL, Fagan AM, Goate A, Fox NC, Marcus DS, Cairns NJ, Xie X, Blazey TM, Holtzman DM, Santacruz A, Buckles V, Oliver A, Moulder K, Aisen PS, Ghetti B, Klunk WE, McDade E, Martins RN, Masters CL, Mayeux R, Ringman JM, Rossor MN, Schofield PR, Sperling RA, Salloway S, Morris JC, Dominantly Inherited Alzheimer N. 2012. Clinical and biomarker changes in dominantly inherited Alzheimer's disease. N Engl J Med 367:795–804 [DOI] [PMC free article] [PubMed] [Google Scholar]
- Beckmann CF, DeLuca M, Devlin JT, Smith SM. 2005. Investigations into resting-state connectivity using independent component analysis. Philos Trans R Soc Lond B Biol Sci 360:1001–1013 [DOI] [PMC free article] [PubMed] [Google Scholar]
- Behzadi Y, Restom K, Liau J, Liu TT. 2007. A component based noise correction method (CompCor) for BOLD and perfusion based fMRI. Neuroimage 37:90–101 [DOI] [PMC free article] [PubMed] [Google Scholar]
- Bero AW, Bauer AQ, Stewart FR, White BR, Cirrito JR, Raichle ME, Culver JP, Holtzman DM. 2012. Bidirectional relationship between functional connectivity and amyloid-beta deposition in mouse brain. J Neurosci 32:4334–4340 [DOI] [PMC free article] [PubMed] [Google Scholar]
- Bero AW, Yan P, Roh JH, Cirrito JR, Stewart FR, Raichle ME, Lee JM, Holtzman DM. 2011. Neuronal activity regulates the regional vulnerability to amyloid-beta deposition. Nat Neurosci 14:750–756 [DOI] [PMC free article] [PubMed] [Google Scholar]
- Biswal B, Yetkin Z, Haughton VM, Hyde JS. 1995. Functional connectivity in the motor cortex of resting human brain using echo-planar MRI. Magn Reson Med 34:537–541 [DOI] [PubMed] [Google Scholar]
- Blennow K, de Leon MJ, Zetterberg H. 2006. Alzheimer's disease. Lancet 368:387–403 [DOI] [PubMed] [Google Scholar]
- Braak H, Braak E. 1991. Neuropathological stageing of Alzheimer-related changes. Acta Neuropathol 82:239–259 [DOI] [PubMed] [Google Scholar]
- Braak H, Thal DR, Ghebremedhin E, Tredici KD. 2011. Stages of the pathological process in Alzheimer disease: age categories from 1 to 100 years. J Neuropathol Exp Neurol 70:960–969 [DOI] [PubMed] [Google Scholar]
- Brier MR, Thomas JB, Fagan AM, Hassenstab J, Holtzman DM, Benzinger TL, Morris JC, Ances BM. 2014. Functional connectivity and graph theory in preclinical Alzheimer's disease. Neurobiol Aging 35:757–768 [DOI] [PMC free article] [PubMed] [Google Scholar]
- Brier MR, Thomas JB, Snyder AZ, Benzinger TL, Zhang D, Raichle ME, Holtzman DM, Morris JC, Ances BM. 2012. Loss of intranetwork and internetwork resting state functional connections with Alzheimer's disease progression. J Neurosci 32:8890–8899 [DOI] [PMC free article] [PubMed] [Google Scholar]
- Buckner RL, Andrews-Hanna JR, Schacter DL. 2008. The brain's default network: anatomy, function, and relevance to disease. Ann N Y Acad Sci 1124:1–38 [DOI] [PubMed] [Google Scholar]
- Buckner RL, Sepulcre J, Talukdar T, Krienen FM, Liu H, Hedden T, Andrews-Hanna JR, Sperling RA, Johnson KA. 2009. Cortical hubs revealed by intrinsic functional connectivity: mapping, assessment of stability, and relation to Alzheimer's disease. J Neurosci 29:1860–1873 [DOI] [PMC free article] [PubMed] [Google Scholar]
- Buckner RL, Snyder AZ, Shannon BJ, LaRossa G, Sachs R, Fotenos AF, Sheline YI, Klunk WE, Mathis CA, Morris JC, Mintun MA. 2005. Molecular, structural, and functional characterization of Alzheimer's disease: evidence for a relationship between default activity, amyloid, and memory. J Neurosci 25:7709–7717 [DOI] [PMC free article] [PubMed] [Google Scholar]
- Bullmore E, Sporns O. 2009. Complex brain networks: graph theoretical analysis of structural and functional systems. Nat Rev Neurosci 10:186–198 [DOI] [PubMed] [Google Scholar]
- Cabral J, Kringelbach ML, Deco G. 2014. Exploring the network dynamics underlying brain activity during rest. Prog Neurobiol 114:102–131 [DOI] [PubMed] [Google Scholar]
- Calhoun VD, Adali T, Pearlson GD, Pekar JJ. 2001. A method for making group inferences from functional MRI data using independent component analysis. Hum Brain Mapp 14:140–151 [DOI] [PMC free article] [PubMed] [Google Scholar]
- Chai XJ, Castanon AN, Ongur D, Whitfield-Gabrieli S. 2012. Anticorrelations in resting state networks without global signal regression. Neuroimage 59:1420–1428 [DOI] [PMC free article] [PubMed] [Google Scholar]
- Chhatwal JP, Schultz AP, Johnson K, Benzinger TL, Jack C, Jr., Ances BM, Sullivan CA, Salloway SP, Ringman JM, Koeppe RA, Marcus DS, Thompson P, Saykin AJ, Correia S, Schofield PR, Rowe CC, Fox NC, Brickman AM, Mayeux R, McDade E, Bateman R, Fagan AM, Goate AM, Xiong C, Buckles VD, Morris JC, Sperling RA. 2013. Impaired default network functional connectivity in autosomal dominant Alzheimer disease. Neurology 81:736–744 [DOI] [PMC free article] [PubMed] [Google Scholar]
- Chien DT, Bahri S, Szardenings AK, Walsh JC, Mu F, Su MY, Shankle WR, Elizarov A, Kolb HC. 2013. Early clinical PET imaging results with the novel PHF-tau radioligand [F-18]-T807. J Alzheimers Dis 34:457–468 [DOI] [PubMed] [Google Scholar]
- Ciftci K. 2011. Minimum spanning tree reflects the alterations of the default mode network during Alzheimer's disease. Ann Biomed Eng 39:1493–1504 [DOI] [PubMed] [Google Scholar]
- Damoiseaux JS, Prater KE, Miller BL, Greicius MD. 2012. Functional connectivity tracks clinical deterioration in Alzheimer's disease. Neurobiol Aging 33:828e819–e830 [DOI] [PMC free article] [PubMed] [Google Scholar]
- Damoiseaux JS, Rombouts SA, Barkhof F, Scheltens P, Stam CJ, Smith SM, Beckmann CF. 2006. Consistent resting-state networks across healthy subjects. Proc Natl Acad Sci U S A 103:13848–13853 [DOI] [PMC free article] [PubMed] [Google Scholar]
- de Calignon A, Polydoro M, Suarez-Calvet M, William C, Adamowicz DH, Kopeikina KJ, Pitstick R, Sahara N, Ashe KH, Carlson GA, Spires-Jones TL, Hyman BT. 2012. Propagation of tau pathology in a model of early Alzheimer's disease. Neuron 73:685–697 [DOI] [PMC free article] [PubMed] [Google Scholar]
- Delbeuck X, Van der Linden M, Collette F. 2003. Alzheimer's disease as a disconnection syndrome? Neuropsychol Rev 13:79–92 [DOI] [PubMed] [Google Scholar]
- Drzezga A, Becker JA, Van Dijk KRA, Sreenivasan A, Talukdar T, Sullivan C, Schultz AP, Sepulcre J, Putcha D, Greve D, Johnson KA, Sperling RA. 2011. Neuronal dysfunction and disconnection of cortical hubs in non-demented subjects with elevated amyloid burden. Brain 134:1635–1646 [DOI] [PMC free article] [PubMed] [Google Scholar]
- Duchek JM, Balota DA, Thomas JB, Snyder AZ, Rich P, Benzinger TL, Fagan AM, Holtzman DM, Morris JC, Ances BM. 2013. Relationship between Stroop performance and resting state functional connectivity in cognitively normal older adults. Neuropsychology 27:516–528 [DOI] [PMC free article] [PubMed] [Google Scholar]
- Fagan AM, Holtzman DM. 2010. Cerebrospinal fluid biomarkers of Alzheimer's disease. Biomark Med 4:51–63 [DOI] [PMC free article] [PubMed] [Google Scholar]
- Filippini N, MacIntosh BJ, Hough MG, Goodwin GM, Frisoni GB, Smith SM, Matthews PM, Beckmann CF, Mackay CE. 2009. Distinct patterns of brain activity in young carriers of the APOE-epsilon4 allele. Proc Natl Acad Sci U S A 106:7209–7214 [DOI] [PMC free article] [PubMed] [Google Scholar]
- Fodero-Tavoletti MT, Okamura N, Furumoto S, Mulligan RS, Connor AR, McLean CA, Cao D, Rigopoulos A, Cartwright GA, O'Keefe G, Gong S, Adlard PA, Barnham KJ, Rowe CC, Masters CL, Kudo Y, Cappai R, Yanai K, Villemagne VL. 2011. 18F-THK523: a novel in vivo tau imaging ligand for Alzheimer's disease. Brain 134:1089–1100 [DOI] [PubMed] [Google Scholar]
- Fox MD, Raichle ME. 2007. Spontaneous fluctuations in brain activity observed with functional magnetic resonance imaging. Nat Rev Neurosci 8:700–711 [DOI] [PubMed] [Google Scholar]
- Fox MD, Snyder AZ, Vincent JL, Corbetta M, Van Essen DC, Raichle ME. 2005. The human brain is intrinsically organized into dynamic, anticorrelated functional networks. Proc Natl Acad Sci U S A 102:9673–9678 [DOI] [PMC free article] [PubMed] [Google Scholar]
- Fox MD, Zhang D, Snyder AZ, Raichle ME. 2009. The global signal and observed anticorrelated resting state brain networks. J Neurophysiol 101:3270–3283 [DOI] [PMC free article] [PubMed] [Google Scholar]
- Frost B, Jacks RL, Diamond MI. 2009. Propagation of tau misfolding from the outside to the inside of a cell. J Biol Chem 284:12845–12852 [DOI] [PMC free article] [PubMed] [Google Scholar]
- Geschwind N. 1965. Disconnexion syndromes in animals and man. Brain 88:237–294 [DOI] [PubMed] [Google Scholar]
- Glover GH, Li TQ, Ress D. 2000. Image-based method for retrospective correction of physiological motion effects in fMRI: RETROICOR. Magn Reson Med 44:162–167 [DOI] [PubMed] [Google Scholar]
- Gomez-Ramirez J, Wu J. 2014. Network based biomarkers in Alzheimer's disease: review and future directions. Front Neurol 6:12. [DOI] [PMC free article] [PubMed] [Google Scholar]
- Greicius MD, Srivastava G, Reiss AL, Menon V. 2004. Default-mode network activity distinguishes Alzheimer's disease from healthy aging: evidence from functional MRI. Proc Natl Acad Sci U S A 101:4637–4642 [DOI] [PMC free article] [PubMed] [Google Scholar]
- Hacker CD, Laumann TO, Szrama NP, Baldassarre A, Snyder AZ, Leuthardt EC, Corbetta M. 2013. Resting state network estimation in individual subjects. Neuroimage 82:616–633 [DOI] [PMC free article] [PubMed] [Google Scholar]
- Hafkemeijer A, van der Grond J, Rombouts SA. 2012. Imaging the default mode network in aging and dementia. Biochim Biophys Acta 1822:431–441 [DOI] [PubMed] [Google Scholar]
- Hallquist MN, Hwang K, Luna B. 2013. The nuisance of nuisance regression: spectral misspecification in a common approach to resting-state fMRI preprocessing reintroduces noise and obscures functional connectivity. Neuroimage 82:208–225 [DOI] [PMC free article] [PubMed] [Google Scholar]
- Hedden T, Van Dijk KR, Becker JA, Mehta A, Sperling RA, Johnson KA, Buckner RL. 2009. Disruption of functional connectivity in clinically normal older adults harboring amyloid burden. J Neurosci 29:12686–12694 [DOI] [PMC free article] [PubMed] [Google Scholar]
- Jack CR, Knopman DS, Jagust WJ, Petersen RC, Weiner MW, Aisen PS, Shaw LM, Vemuri P, Wiste HJ, Weigand SD, Lesnick TG, Pankratz VS, Donohue MC, Trojanowski JQ. 2013. Tracking pathophysiological processes in Alzheimer's disease: an updated hypothetical model of dynamic biomarkers. Lancet Neurol 12:207–216 [DOI] [PMC free article] [PubMed] [Google Scholar]
- Jack CR, Jr., Knopman DS, Jagust WJ, Shaw LM, Aisen PS, Weiner MW, Petersen RC, Trojanowski JQ. 2010. Hypothetical model of dynamic biomarkers of the Alzheimer's pathological cascade. Lancet Neurol 9:119–128 [DOI] [PMC free article] [PubMed] [Google Scholar]
- Jones DT, Machulda MM, Vemuri P, McDade EM, Zeng G, Senjem ML, Gunter JL, Przybelski SA, Avula RT, Knopman DS, Boeve BF, Petersen RC, Jack CR., Jr. 2011. Age-related changes in the default mode network are more advanced in Alzheimer disease. Neurology 77:1524–1531 [DOI] [PMC free article] [PubMed] [Google Scholar]
- Kaufman SK, Diamond MI. 2013. Prion-like propagation of protein aggregation and related therapeutic strategies. Neurotherapeutics 10:371–382 [DOI] [PMC free article] [PubMed] [Google Scholar]
- Keller CJ, Bickel S, Honey CJ, Groppe DM, Entz L, Craddock RC, Lado FA, Kelly C, Milham M, Mehta AD. 2013. Neurophysiological investigation of spontaneous correlated and anticorrelated fluctuations of the BOLD signal. J Neurosci 33:6333–6342 [DOI] [PMC free article] [PubMed] [Google Scholar]
- Klunk WE, Engler H, Nordberg A, Wang Y, Blomqvist G, Holt DP, Bergstrom M, Savitcheva I, Huang GF, Estrada S, Ausen B, Debnath ML, Barletta J, Price JC, Sandell J, Lopresti BJ, Wall A, Koivisto P, Antoni G, Mathis CA, Langstrom B. 2004. Imaging brain amyloid in Alzheimer's disease with Pittsburgh Compound-B. Ann Neurol 55:306–319 [DOI] [PubMed] [Google Scholar]
- Lee MH, Hacker CD, Snyder AZ, Corbetta M, Zhang D, Leuthardt EC, Shimony JS. 2012. Clustering of resting state networks. PLoS One 7:e40370. [DOI] [PMC free article] [PubMed] [Google Scholar]
- Lehmann M, Madison CM, Ghosh PM, Seeley WW, Mormino E, Greicius MD, Gorno-Tempini ML, Kramer JH, Miller BL, Jagust WJ, Rabinovici GD. 2013. Intrinsic connectivity networks in healthy subjects explain clinical variability in Alzheimer's disease. Proc Natl Acad Sci U S A 110:11606–11611 [DOI] [PMC free article] [PubMed] [Google Scholar]
- Li X, Li TQ, Andreasen N, Wiberg MK, Westman E, Wahlund LO. 2013. Ratio of Abeta42/P-tau181p in CSF is associated with aberrant default mode network in AD. Sci Rep 3:1339. [DOI] [PMC free article] [PubMed] [Google Scholar]
- Liu Y, Wang K, Yu C, He Y, Zhou Y, Liang M, Wang L, Jiang T. 2008. Regional homogeneity, functional connectivity and imaging markers of Alzheimer's disease: a review of resting-state fMRI studies. Neuropsychologia 46:1648–1656 [DOI] [PubMed] [Google Scholar]
- Logothetis NK. 2002. The neural basis of the blood-oxygen-level-dependent functional magnetic resonance imaging signal. Philos Trans R Soc Lond B Biol Sci 357:1003–1037 [DOI] [PMC free article] [PubMed] [Google Scholar]
- Machulda MM, Jones DT, Vemuri P, McDade E, Avula R, Przybelski S, Boeve BF, Knopman DS, Petersen RC, Jack CR., Jr. 2011. Effect of APOE epsilon4 status on intrinsic network connectivity in cognitively normal elderly subjects. Arch Neurol 68:1131–1136 [DOI] [PMC free article] [PubMed] [Google Scholar]
- Mangialasche F, Solomon A, Winblad B, Mecocci P, Kivipelto M. 2010. Alzheimer's disease: clinical trials and drug development. Lancet Neurol 9:702–716 [DOI] [PubMed] [Google Scholar]
- Maruyama M, Shimada H, Suhara T, Shinotoh H, Ji B, Maeda J, Zhang MR, Trojanowski JQ, Lee VM, Ono M, Masamoto K, Takano H, Sahara N, Iwata N, Okamura N, Furumoto S, Kudo Y, Chang Q, Saido TC, Takashima A, Lewis J, Jang MK, Aoki I, Ito H, Higuchi M. 2013. Imaging of tau pathology in a tauopathy mouse model and in Alzheimer patients compared to normal controls. Neuron 79:1094–1108 [DOI] [PMC free article] [PubMed] [Google Scholar]
- Matthews PM, Filippini N, Douaud G. 2013. Brain structural and functional connectivity and the progression of neuropathology in Alzheimer's disease. J Alzheimers Dis 33Suppl1:S163–S172 [DOI] [PubMed] [Google Scholar]
- Mormino EC, Smiljic A, Hayenga AO, Onami SH, Greicius MD, Rabinovici GD, Janabi M, Baker SL, Yen IV, Madison CM, Miller BL, Jagust WJ. 2011. Relationships between beta-amyloid and functional connectivity in different components of the default mode network in aging. Cereb Cortex 21:2399–2407 [DOI] [PMC free article] [PubMed] [Google Scholar]
- Morris JC. 1993. The Clinical Dementia Rating (CDR): current version and scoring rules. Neurology 43:2412–2414 [DOI] [PubMed] [Google Scholar]
- Morris JC, Blennow K, Froelich L, Nordberg A, Soininen H, Waldemar G, Wahlund LO, Dubois B. 2014. Harmonized diagnostic criteria for Alzheimer's disease: recommendations. J Intern Med 275:204–213 [DOI] [PubMed] [Google Scholar]
- Murphy K, Birn RM, Handwerker DA, Jones TB, Bandettini PA. 2009. The impact of global signal regression on resting state correlations: are anti-correlated networks introduced? Neuroimage 44:893–905 [DOI] [PMC free article] [PubMed] [Google Scholar]
- Nelson PT, Braak H, Markesbery WR. 2009. Neuropathology and cognitive impairment in Alzheimer disease: a complex but coherent relationship. J Neuropathol Exp Neurol 68:1–14 [DOI] [PMC free article] [PubMed] [Google Scholar]
- Ogawa S, Menon RS, Tank DW, Kim SG, Merkle H, Ellermann JM, Ugurbil K. 1993. Functional brain mapping by blood oxygenation level-dependent contrast magnetic resonance imaging. A comparison of signal characteristics with a biophysical model. Biophys J 64:803–812 [DOI] [PMC free article] [PubMed] [Google Scholar]
- Okello A, Koivunen J, Edison P, Archer HA, Turkheimer FE, Nagren K, Bullock R, Walker Z, Kennedy A, Fox NC, Rossor MN, Rinne JO, Brooks DJ. 2009. Conversion of amyloid positive and negative MCI to AD over 3 years: an 11C-PIB PET study. Neurology 73:754–760 [DOI] [PMC free article] [PubMed] [Google Scholar]
- Pievani M, de Haan W, Wu T, Seeley WW, Frisoni GB. 2011. Functional network disruption in the degenerative dementias. Lancet Neurol 10:829–843 [DOI] [PMC free article] [PubMed] [Google Scholar]
- Power JD, Barnes KA, Snyder AZ, Schlaggar BL, Petersen SE. 2012. Spurious but systematic correlations in functional connectivity MRI networks arise from subject motion. Neuroimage 59:2142–2154 [DOI] [PMC free article] [PubMed] [Google Scholar]
- Power JD, Mitra A, Laumann TO, Snyder AZ, Schlaggar BL, Petersen SE. 2013a. Methods to detect, characterize, and remove motion artifact in resting state fMRI. Neuroimage 84C:320–341 [DOI] [PMC free article] [PubMed] [Google Scholar]
- Power JD, Schlaggar BL, Lessov-Schlaggar CN, Petersen SE. 2013b. Evidence for hubs in human functional brain networks. Neuron 79:798–813 [DOI] [PMC free article] [PubMed] [Google Scholar]
- Price JL, McKeel DW, Jr., Buckles VD, Roe CM, Xiong C, Grundman M, Hansen LA, Petersen RC, Parisi JE, Dickson DW, Smith CD, Davis DG, Schmitt FA, Markesbery WR, Kaye J, Kurlan R, Hulette C, Kurland BF, Higdon R, Kukull W, Morris JC. 2009. Neuropathology of nondemented aging: presumptive evidence for preclinical Alzheimer disease. Neurobiol Aging 30:1026–1036 [DOI] [PMC free article] [PubMed] [Google Scholar]
- Raichle ME. 2011. The restless brain. Brain Connect 1:3–12 [DOI] [PMC free article] [PubMed] [Google Scholar]
- Raichle ME, MacLeod AM, Snyder AZ, Powers WJ, Gusnard DA, Shulman GL. 2001. A default mode of brain function. Proc Natl Acad Sci U S A 98:676–682 [DOI] [PMC free article] [PubMed] [Google Scholar]
- Raichle ME, Snyder AZ. 2007. A default mode of brain function: a brief history of an evolving idea. Neuroimage 37:1083–1090; discussion 1097–1089. [DOI] [PubMed] [Google Scholar]
- Reitz C, Brayne C, Mayeux R. 2011. Epidemiology of Alzheimer disease. Nat Rev Neurol 7:137–152 [DOI] [PMC free article] [PubMed] [Google Scholar]
- Roman G, Pascual B. 2012. Contribution of neuroimaging to the diagnosis of Alzheimer's disease and vascular dementia. Arch Med Res 43:671–676 [DOI] [PubMed] [Google Scholar]
- Roses AD. 1996. Apolipoprotein E alleles as risk factors in Alzheimer's disease. Annu Rev Med 47:387–400 [DOI] [PubMed] [Google Scholar]
- Salvador R, Suckling J, Schwarzbauer C, Bullmore E. 2005. Undirected graphs of frequency-dependent functional connectivity in whole brain networks. Philos Trans R Soc Lond B Biol Sci 360:937–946 [DOI] [PMC free article] [PubMed] [Google Scholar]
- Sanz-Arigita EJ, Schoonheim MM, Damoiseaux JS, Rombouts SA, Maris E, Barkhof F, Scheltens P, Stam CJ. 2010. Loss of ‘small-world’ networks in Alzheimer's disease: graph analysis of FMRI resting-state functional connectivity. PLoS One 5:e13788. [DOI] [PMC free article] [PubMed] [Google Scholar]
- Saper CB, Wainer BH, German DC. 1987. Axonal and transneuronal transport in the transmission of neurological disease: potential role in system degenerations, including Alzheimer's disease. Neuroscience 23:389–398 [DOI] [PubMed] [Google Scholar]
- Seeley WW. 2012. Divergent network connectivity changes in healthy APOE e4 carriers: disinhibition or compensation? Arch Neurol 68:1107–1108 [DOI] [PubMed] [Google Scholar]
- Seeley WW, Crawford RK, Zhou J, Miller BL, Greicius MD. 2009. Neurodegenerative diseases target large-scale human brain networks. Neuron 62:42–52 [DOI] [PMC free article] [PubMed] [Google Scholar]
- Shehzad Z, Kelly AM, Reiss PT, Gee DG, Gotimer K, Uddin LQ, Lee SH, Margulies DS, Roy AK, Biswal BB, Petkova E, Castellanos FX, Milham MP. 2009. The resting brain: unconstrained yet reliable. Cereb Cortex 19:2209–2229 [DOI] [PMC free article] [PubMed] [Google Scholar]
- Sheline YI, Morris JC, Snyder AZ, Price JL, Yan Z, D'Angelo G, Liu C, Dixit S, Benzinger T, Fagan A, Goate A, Mintun MA. 2010a. APOE4 allele disrupts resting state fMRI connectivity in the absence of amyloid plaques or decreased CSF Abeta42. J Neurosci 30:17035–17040 [DOI] [PMC free article] [PubMed] [Google Scholar]
- Sheline YI, Raichle ME, Snyder AZ, Morris JC, Head D, Wang S, Mintun MA. 2010b. Amyloid plaques disrupt resting state default mode network connectivity in cognitively normal elderly. Biol Psychiatry 67:584–587 [DOI] [PMC free article] [PubMed] [Google Scholar]
- Small GW, Kepe V, Ercoli LM, Siddarth P, Bookheimer SY, Miller KJ, Lavretsky H, Burggren AC, Cole GM, Vinters HV, Thompson PM, Huang SC, Satyamurthy N, Phelps ME, Barrio JR. 2006. PET of brain amyloid and tau in mild cognitive impairment. N Engl J Med 355:2652–2663 [DOI] [PubMed] [Google Scholar]
- Sorg C, Riedl V, Muhlau M, Calhoun VD, Eichele T, Laer L, Drzezga A, Forstl H, Kurz A, Zimmer C, Wohlschlager AM. 2007. Selective changes of resting-state networks in individuals at risk for Alzheimer's disease. Proc Natl Acad Sci U S A 104:18760–18765 [DOI] [PMC free article] [PubMed] [Google Scholar]
- Sorg C, Riedl V, Perneczky R, Kurz A, Wohlschlager AM. 2009. Impact of Alzheimer's disease on the functional connectivity of spontaneous brain activity. Curr Alzheimer Res 6:541–553 [DOI] [PubMed] [Google Scholar]
- Sperling RA, Aisen PS, Beckett LA, Bennett DA, Craft S, Fagan AM, Iwatsubo T, Jack CR, Jr., Kaye J, Montine TJ, Park DC, Reiman EM, Rowe CC, Siemers E, Stern Y, Yaffe K, Carrillo MC, Thies B, Morrison-Bogorad M, Wagster MV, Phelps CH. 2011. Toward defining the preclinical stages of Alzheimer's disease: recommendations from the National Institute on Aging-Alzheimer's Association workgroups on diagnostic guidelines for Alzheimer's disease. Alzheimers Dement 7:280–292 [DOI] [PMC free article] [PubMed] [Google Scholar]
- Stam CJ, Jones BF, Nolte G, Breakspear M, Scheltens P. 2007. Small-world networks and functional connectivity in Alzheimer's disease. Cereb Cortex 17:92–99 [DOI] [PubMed] [Google Scholar]
- Supekar K, Menon V, Rubin D, Musen M, Greicius MD. 2008. Network analysis of intrinsic functional brain connectivity in Alzheimer's disease. PLoS Comput Biol 4:e1000100. [DOI] [PMC free article] [PubMed] [Google Scholar]
- Thal DR, Rub U, Orantes M, Braak H. 2002. Phases of A-deposition in the human brain and its relevance for the development of AD. Neurology 58:1791–1800 [DOI] [PubMed] [Google Scholar]
- Thomas JB, Brier MR, Bateman R, Snyder AZ, Benzinger T, Xiong C, Raichle ME, Sperling RA, Mayeux R, Ghetti B, Ringman JM, Salloway S, McDade E, Rossor MN, Schofield E, Masters C, Martins R, Jack CR, Oliver A, Blazey TM, Moulder K, Buckles V, Hornbeck R, Chhatwal JP, Schultz AP, Goate A, Fagan A, Cairns NJ, Marcus D, Morris JC, Ances B. 2013. Resting state functional connectivity in autosomal dominant and sporadic Alzheimer's disease. Alzheimer Dement 9:P105 [Google Scholar]
- Tijms BM, Wink AM, de Haan W, van der Flier WM, Stam CJ, Scheltens P, Barkhof F. 2013. Alzheimer's disease: connecting findings from graph theoretical studies of brain networks. Neurobiol Aging 34:2023–2036 [DOI] [PubMed] [Google Scholar]
- Van Dijk KR, Sabuncu MR, Buckner RL. 2012. The influence of head motion on intrinsic functional connectivity MRI. Neuroimage 59:431–438 [DOI] [PMC free article] [PubMed] [Google Scholar]
- Villemagne VL, Pike KE, Chetelat G, Ellis KA, Mulligan RS, Bourgeat P, Ackermann U, Jones G, Szoeke C, Salvado O, Martins R, O'Keefe G, Mathis CA, Klunk WE, Ames D, Masters CL, Rowe CC. 2011. Longitudinal assessment of Abeta and cognition in aging and Alzheimer disease. Ann Neurol 69:181–192 [DOI] [PMC free article] [PubMed] [Google Scholar]
- Wang J, Zuo X, Dai Z, Xia M, Zhao Z, Zhao X, Jia J, Han Y, He Y. 2013a. Disrupted functional brain connectome in individuals at risk for Alzheimer's disease. Biol Psychiatry 73:472–481 [DOI] [PubMed] [Google Scholar]
- Wang K, Liang M, Wang L, Tian L, Zhang X, Li K, Jiang T. 2007. Altered functional connectivity in early Alzheimer's disease: a resting-state fMRI study. Hum Brain Mapp 28:967–978 [DOI] [PMC free article] [PubMed] [Google Scholar]
- Wang L, Brier MR, Snyder AZ, Thomas JB, Fagan AM, Xiong C, Benzinger TL, Holtzman DM, Morris JC, Ances BM. 2013b. Cerebrospinal fluid Abeta42, phosphorylated Tau181, and resting-state functional connectivity. JAMA Neurol 70:1242–1248 [DOI] [PMC free article] [PubMed] [Google Scholar]
- Wang L, Roe CM, Snyder AZ, Brier MR, Thomas JB, Xiong C, Benzinger TL, Morris JC, Ances BM. 2012. Alzheimer disease family history impacts resting state functional connectivity. Ann Neurol 72:571–577 [DOI] [PMC free article] [PubMed] [Google Scholar]
- Wang L, Zang Y, He Y, Liang M, Zhang X, Tian L, Wu T, Jiang T, Li K. 2006. Changes in hippocampal connectivity in the early stages of Alzheimer's disease: evidence from resting state fMRI. Neuroimage 31:496–504 [DOI] [PubMed] [Google Scholar]
- Warren JD, Fletcher PD, Golden HL. 2012a. The paradox of syndromic diversity in Alzheimer disease. Nat Rev Neurol 8:451–464 [DOI] [PubMed] [Google Scholar]
- Warren JD, Rohrer JD, Hardy J. 2012b. Disintegrating brain networks: from syndromes to molecular nexopathies. Neuron 73:1060–1062 [DOI] [PMC free article] [PubMed] [Google Scholar]
- Warren JD, Rohrer JD, Schott JM, Fox NC, Hardy J, Rossor MN. 2013. Molecular nexopathies: a new paradigm of neurodegenerative disease. Trends Neurosci 36:561–569 [DOI] [PMC free article] [PubMed] [Google Scholar]
- Watts DJ, Strogatz SH. 1998. Collective dynamics of ‘small-world’ networks. Nature 393:440–442 [DOI] [PubMed] [Google Scholar]
- Wig GS, Laumann TO, Cohen AL, Power JD, Nelson SM, Glasser MF, Miezin FM, Snyder AZ, Schlaggar BL, Petersen SE. 2013. Parcellating an individual subject's cortical and subcortical brain structures using snowball sampling of resting-state correlations. Cereb Cortex [Epub ahead of print]; DOI: 10.1093/cercor/bht056 [DOI] [PMC free article] [PubMed] [Google Scholar]
- Wig GS, Laumann TO, Petersen SE. 2014. An approach for parcellating human cortical areas using resting-state correlations. Neuroimage 93P2:276–291 [DOI] [PMC free article] [PubMed] [Google Scholar]
- Xia M, Wang Z, Dai Z, Liang X, Song H, Shu N, Li K, He Y. 2014. Differentially Disrupted functional connectivity in posteromedial cortical subregions in Alzheimer's disease. J Alzheimers Dis 39–527–543 [DOI] [PubMed] [Google Scholar]
- Yeo BT, Krienen FM, Sepulcre J, Sabuncu MR, Lashkari D, Hollinshead M, Roffman JL, Smoller JW, Zollei L, Polimeni JR, Fischl B, Liu H, Buckner RL. 2011. The organization of the human cerebral cortex estimated by intrinsic functional connectivity. J Neurophysiol 106:1125–1165 [DOI] [PMC free article] [PubMed] [Google Scholar]
- Zhang HY, Wang SJ, Liu B, Ma ZL, Yang M, Zhang ZJ, Teng GJ. 2010. Resting brain connectivity: changes during the progress of Alzheimer disease. Radiology 256:598–606 [DOI] [PubMed] [Google Scholar]
- Zhang HY, Wang SJ, Xing J, Liu B, Ma ZL, Yang M, Zhang ZJ, Teng GJ. 2009. Detection of PCC functional connectivity characteristics in resting-state fMRI in mild Alzheimer's disease. Behav Brain Res 197:103–108 [DOI] [PubMed] [Google Scholar]
- Zhou J, Gennatas ED, Kramer JH, Miller BL, Seeley WW. 2012. Predicting regional neurodegeneration from the healthy brain functional connectome. Neuron 73:1216–1227 [DOI] [PMC free article] [PubMed] [Google Scholar]
- Zhou J, Greicius MD, Gennatas ED, Growdon ME, Jang JY, Rabinovici GD, Kramer JH, Weiner M, Miller BL, Seeley WW. 2010. Divergent network connectivity changes in behavioural variant frontotemporal dementia and Alzheimer's disease. Brain 133:1352–1367 [DOI] [PMC free article] [PubMed] [Google Scholar]
- Zhou Y, Dougherty JH, Jr., Hubner KF, Bai B, Cannon RL, Hutson RK. 2008. Abnormal connectivity in the posterior cingulate and hippocampus in early Alzheimer's disease and mild cognitive impairment. Alzheimers Dement 4:265–270 [DOI] [PubMed] [Google Scholar]
- Zou QH, Zhu CZ, Yang Y, Zuo XN, Long XY, Cao QJ, Wang YF, Zang YF. 2008. An improved approach to detection of amplitude of low-frequency fluctuation (ALFF) for resting-state fMRI: fractional ALFF. J Neurosci Methods 172:137–141 [DOI] [PMC free article] [PubMed] [Google Scholar]