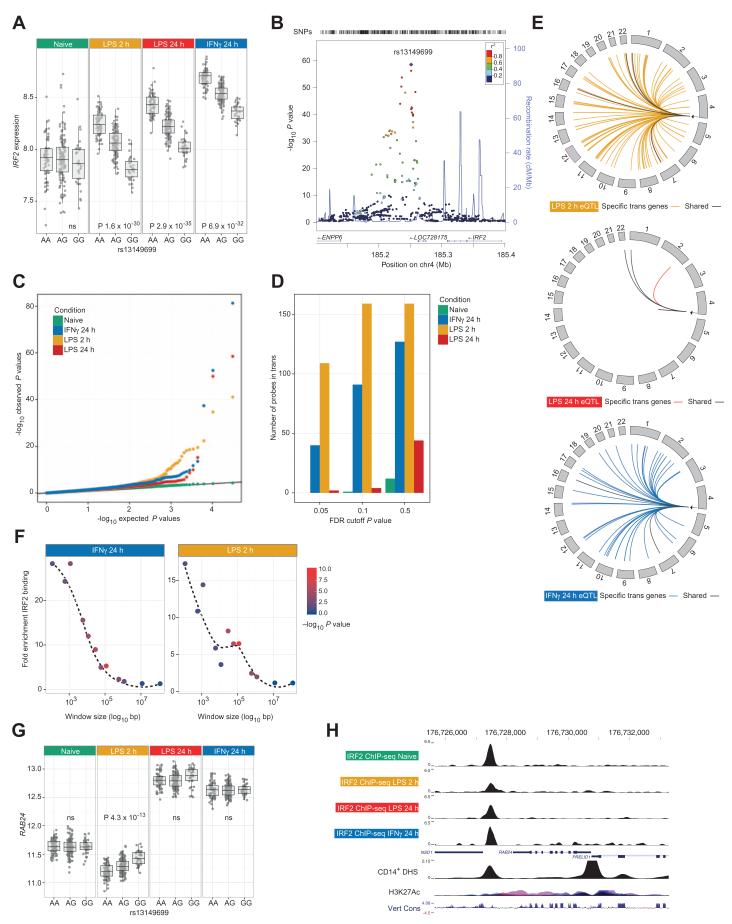
Fig. 4. Cis regulation of IRF2 at rs13149699 has profound transcriptional consequences in trans.
(A) A significant cis-eQTL to the transcription factor IRF2 seen only after treatment (P values shown for shared data set; in the full data sets, PLPS2 = 2.1 × 10⁻³⁵, PLPS24 = 6.4 × 10−55 , PIFNγ = 2.6 × 10−59, and Pnaïve = ns). (B) Local association plot for 367 individuals after IFN-γ treatment including imputed genotypes. The peak eQTL for IRF2 remains rs13149699, 57-kb 3′ to the gene. (C) eQTL analysis was performed on rs13149699 alone in the shared (n = 228) data set to identify associated genes missed due to correction for multiple testing across all SNPs—qq plots demonstrating number of probes with expression associated with rs13149699 across treatments. Treatment results in significant numbers of probes deviating from expected, with greatest deviation after 2-hour LPS. (D) Bar charts demonstrating number of significantly associated probes at different FDR thresholds. Note relative absence of associations in untreated state despite the same number of tests being performed. (E) Circular plots demonstrating location of transeQTL (FDR < 0.05) after analysis on rs13149699 in the complete data sets. (F) Windows flanking probes tested for eQTL were defined, and the number of IRF2 ChIP-seq binding sites per treatment was counted. Probes in trans to rs13149699 were significantly enriched for IRF2 binding in both treatments (Fisher’s exact test). (G) Box plot showing allelic expression of RAB24 by rs13149699. (H) ChIP-seq for IRF2 from primary monocytes for different treatments illustrating differential binding 0.5-kb 3′ to RAB24. Also shown are ENCODE tracks for CD14+ DNase I hypersensitivity, H3K27Ac (seven cell lines), and vertebrate conservation (Multiz Alignment & Conservation 100 Species).

