

We experience the visual world through a series of saccadic eye movements, each one shifting our gaze to bring objects of interest to the fovea for further processing. Although such movements lead to frequent and substantial displacements of the retinal image, those displacements go unnoticed. It is widely assumed that a primary mechanism underlying this apparent stability is an anticipatory shifting of visual receptive fields (RFs) from their presaccadic to their postsaccadic locations prior to movement onset1. Evidence of this predictive “remapping” of RFs has been particularly apparent within brain structures involved in gaze control2-4. However, critically absent among that evidence are detailed measurements of visual RFs prior to movement onset. Here we show that during saccade preparation, rather than remap, RFs of neurons in a prefrontal gaze control area massively converge toward the saccadic target. We mapped the visual RFs of prefrontal neurons during stable fixation and immediately prior to the onset of eye movements, using multi-electrode recordings in monkeys. Following movements from an initial fixation point to a target, RFs remained stationary in retinocentric space. However, in the period immediately before movement onset, RFs shifted by as much as 18 degrees of visual angle (dva), and converged toward the target location. This convergence resulted in a 3-fold increase in the proportion of RFs responding to stimuli near the target region. In addition, like human observers5,6, the population of prefrontal neurons grossly mislocalized presaccadic stimuli as being closer to the target. Our results show that RF shifts do not predict the retinal displacements due to saccades, but instead reflect the overriding perception of target space during eye movements.
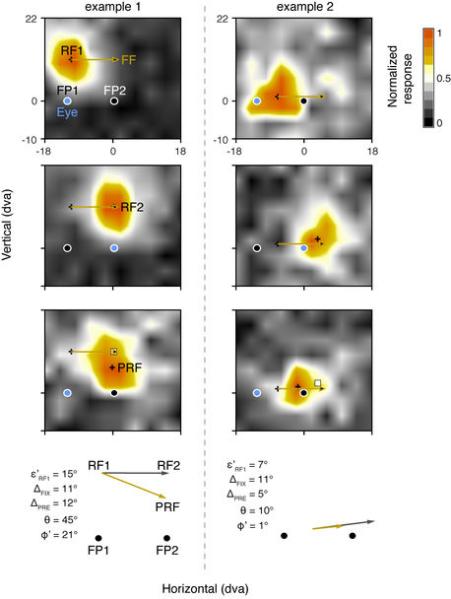
We recorded from neurons within the FEF of monkeys (macaca mulatta) using linear electrode arrays (Fig. 1a) (Methods). The FEF is an area of prefrontal cortex with a known involvement in gaze control7 and visual attention8-11. Previous studies have found evidence that visual RFs of FEF neurons predictively remap prior to saccades1,4. That is, this body of evidence suggests that FEF RFs shift from their presaccadic locations to their anticipated, postsaccadic locations prior to onset of each saccade (Extended Data Fig. 1). However, because these studies inferred RF shifts from visual responses to stimuli presented at only a few locations, the validity of the remapping framework remains uncertain. We therefore mapped the RFs of simultaneously recorded FEF neurons with flashed (25 ms) “probe” stimuli while monkeys performed a standard saccade task4 (Methods, Extended Data Fig. 2). To obtain detailed measurements of RFs during the task, we used a dense array of visual probes: 10 by 9 positions covering an area of 36 by 32 dva (Fig. 1b). Using this arrangement, we mapped RFs during 3 separate periods: during fixation at each of two fixation points (FP1 and FP2) and just prior (69 ms, SD = 35) to a saccade from FP1 to FP2. Fig. 1c shows four examples of FEF RFs mapped during fixation at FP1 and FP2, and their corresponding RF centers (RF1s and RF2s) (Methods). In each example, the change in fixation from one location to the other was accompanied by a RF displacement that was equivalent to the displacement of fixation, reflecting the retinocentric property of FEF RFs. RFs measured at FP2 also served as empirical estimates of the expected shifts due to predictive remapping. When measured while monkeys were still fixating at FP1, but preparing saccades to FP2, RFs were remarkably different from those measured during stable fixation. As shown in the examples, presaccadic RF centers (PRFs) differed both from the RF1s and the RF2s (Fig. 1d). Furthermore, PRFs tended to be much closer to the saccade target (FP2), in some cases shifting from their RF1 location in a direction orthogonal (example 3) or opposite (example 4) to the saccade direction, and thus were inconsistent with remapping.
Figure 1. Multi-electrode recordings and high-density mapping of FEF neuronal RFs.

a, The FEF in the macaque cortex (left) and in a coronal magnetic resonance image from Monkey N (middle). Right, linear array microelectrode and traces of FEF visual responses recorded simultaneously across 16 electrode contacts. b, FEF RFs were mapped with a 10 by 9 array (36 by 32 dva) of probe stimuli (squares) flashed during fixation at FP1 and FP2 and immediately before saccades from FP1 to FP2. c, Four example neuronal RF maps. Left, mean peri-stimulus response histogram for the most effective probe location during fixation at FP1 (top) and FP2 (bottom). Blue traces and circles indicate eye position and fixation location, respectively. d, Presaccadic RF maps of the same neurons mapped immediately before saccades from FP1 to FP2. Left, mean peri-stimulus response histogram for the most effective probe location. Probe presentation (vertical gray shading) was completed prior to saccadic onset on all trials. Bottom, measurement of changes in RF centers (black crosses, RF1, RF2, and PRF) during fixation (gray vectors) and saccade preparation (gold vectors).
Extended Data Figure 1. Schematic illustration of expected RF shifts due to “predictive remapping”.

a, Three RFs (highlighted circles A1, B1, and C1) during stable fixation at FP1. b, The same RFs as in a are shown during stable fixation at FP2 (A2, B2, and C2). In retinocentric areas like the FEF, RFs are displaced across fixations by the direction and amplitude equal to the saccade vector. c, According to predictive remapping, RFs are shifted from their presaccadic locations (gray circles) to their postsaccadic locations (gold circles) prior to movement onset. That is, RF shifts anticipate the upcoming eye movement.
Extended Data Figure 2. Saccadic reaction time.

Plotted are the average deviations from the mean saccadic reaction time of a given recording session for the two monkeys as a function of probe location.
We measured the changes in RF2s and PRFs from their corresponding RF1s (ΔFIX and ΔPRE) for a population of 179 RFs mapped in two monkeys (Fig. 2a) (Methods). As expected, the average displacement of RF2s (11.2 dva, SD = 1.5) was approximately equal to the saccade amplitude (12 dva, SD = 0.2), and was independent of the RF1 distance to the saccade target (ε’RF1 ) (r = 0.05, p = 0.49) (Methods). Without presaccadic RF modulation, we would expect PRFs to be identical to their corresponding RF1s, given that retinal stimulation is essentially identical in these two conditions. However, FEF RFs are dramatically altered during saccade preparation, and are shifted by an average of 8.4 dva (SD = 3.6) and as much as 18 dva (Methods, Extended Data Figure 3). This shift was greater (p < 10-10) than the small variations in RFs measured between the fixation conditions (Extended Data Fig. 4). Furthermore, in contrast to RF2s, PRFs depended on the RF1 distance to the saccade target (r = 0.44, p < 10-9), with larger PRF shifts occurring for more distant RFs. Note that this dependence should not occur if the presaccadic RFs predictively shift from RF1s to their postsaccadic RF2s. Moreover, the angular differences (ϕ’) between the RF2 displacement vectors and the PRF shift vectors were not uniform as expected with remapping, but depended on the angular deviation (θ) of RF1 from the saccade vector (r = 0.75, p < 10-10) (Fig. 2b). Thus, we observed substantial presaccadic shifts that were inconsistent with the remapping prediction (Extended Data Fig. 5). Furthermore, the overall pattern of RF shifts reveals how individual shifts can appear consistent with remapping at some locations in space (Methods, Extended Data Fig. 10).
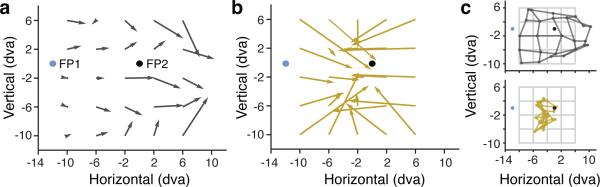
Figure 2. Shifting of FEF neuronal RFs prior to saccade onset.

a, The presaccadic shift amplitude (ΔPRE) as a function of the distance of RF1 from the saccade target (FP2) (ε’RF1) for 179 FEF RFs. The distance between RF1 and RF2 (ΔFIX) as a function of ε’RF1 is shown for comparison. Lines denote linear regression fits. b, The angular deviation of the presaccadic RF shift from the remapping prediction (ϕ’) as a function of θ. c, Comparison of the population of presaccadic RF shifts (gold vectors) with the remapping prediction (gray vectors). Vectors were averaged within the 6 by 6 dva spatial bins depicted in the lower right along with the distribution of individual RF1s. Upper right plot shows the distances between the PRF and the saccade target compared with the distances between RF2 and the saccade target. Black line denotes the line of unity. Vector origins and endpoints are based on, respectively, RF1 and RF2 and RF1 and PRF.
Extended Data Figure 3. Time dependency of RF shifts.
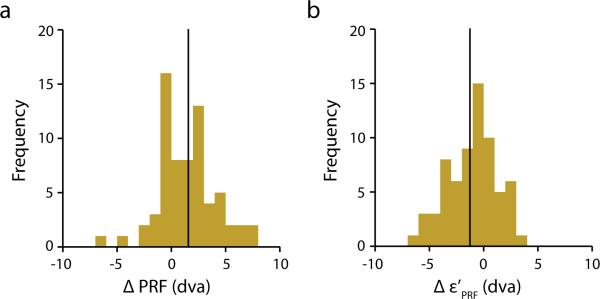
a, Distribution of changes in shift amplitude (ΔPRE) between “early” and “late” PRFs (n = 68). Solid line indicates the mean (1.56 dva) of the distribution. b, Distribution of changes in the distance of PRFs (late –early) to the saccade target. Solid line indicates the mean (−1.26 dva) of the distribution.
Extended Data Figure 4. Retinocentric properties of FEF RFs (I).

a, Distribution of RF1s and RF2s in retinocentric coordinates shown together with the average retinocentric difference between corresponding centers across fixations. Error bars indicate SD. b, Distribution of RF1s and RF2s projected into the same quadrant shown together with the average retinocentric difference between corresponding centers. This was done to control for possible systematic effects that might cancel each other out across quadrants in a. Error bars indicate SD.
Extended Data Figure 5. Retinocentric properties of FEF RFs (II) and their presaccadic changes.

a, Correlations between the distances of RF1s to FP1 (ε’RF1) (r = 0.95, t = 39.59, df = 177, p < 10−10)* and between the angles ϕRF1 and θRF2 (r = 0.96, t = 45.32, df = 177, p < 10−10) are shown. Lines denote best regression fits. b, Correlations between εRF1 and the distances of PRFs to FP2 (ε’PRF) (r = 0.51, t = 7.81, df = 177, p = 2.1·10−8) and between the angles ϕRF1 and θPRF are shown. If the predictive remapping hypothesis were true, the relationships shown in a and b should not differ. However, the correlation between εRF1 and ε’PRF (b, top) is significantly different from the correlation between εRF1 and ε’RF2 (a, top) (Steiger's Z-test for dependent correlations, Z = 13.4, p < 10−10), as are the intercepts b0 (t = 5.23, df = 283, p = 3.3·10−7 and the slopes b1 (t = 12.87, df = 283, p < 10−10) of the respective regressions. Furthermore, instead of a positive correlation close to 1 (a, bottom) we find a significant negative circular correlation** between ϕRF1 and θPRF (b, bottom) (r = -0.53, p < 10−10). c, Correlations between εRF1 and the distances of PRFs to FP1 (εPRF) (r = 0.43, t = 6.4, df = 177, p = 1.1·10−9) and between the angles ϕRF1 and θPRF (r = 0.68, t = 12.4, df = 177, p < 10−10) are shown. If there were no presaccadic shifts of RFs the relationships shown in a and c should not differ. Again, however, we find the correlation between εRF1 and εPRF (c, top) to be significantly different from the correlation between εRF1 and ε’RF2 (a, top) (Z = 14.03, p < 10−10), as are the intercepts (t = 20.81, df = 286, p < 10−10) and the slopes (t = 14.4, df = 286, p < 10−10) of the regressions. The same is true for the correlation between ϕRF1 and θRF2 (a, bottom) and the correlation between ϕRF1 and θPRF (c, bottom) (Z = 13.02, p < 10−10), and for the intercepts (t = 17.69, df = 352, p < 10−10) and slopes (t = 20.74, df = 352, p < 10−10).
* Note, the significance of all correlations in this Figure, reported as Pearson's r, was assessed by computing Spearman's rho and Kendall's tau as well. All correlations were significant using these measures (p values not reported).
** Note, circular statistics (correlation and regression)37 that are independent of a particular coordinate system had to be used in this case since the plotted angles fell outside the linear region. For the relationship between ϕRF1 and θRF2 and between ϕRF1 and ϕPRF ordinary statistics could be used. For comparisons, the respective circular correlations are 0.96 and 0.71.
Extended Data Figure 10. Spike count correlations of recorded FEF neurons.

a, Decrease in mean spike count correlation (rSC) as a function of electrode distance. Solid line denotes the best fitting power function (a·xb; a = 0.12, p < 10−10; b = −0.45, p < 10−10). Data points are averages across neuronal pairs (N = 677) recorded at a fixed electrode distance, across all probe locations and across all three experimental conditions (fixation 1, fixation 2, and Presaccadic). The number of neuronal pairs for each electrode distance, in order of increasing distance, was n = (128, 106, 92, 86, 68, 55, 44, 28, 24, 18, 14, 10, 4). Note that the fit was based on the non-averaged data. b, Top, Mean rSC plotted as a function of baseline normalized firing rate during fixation (gray) and prior to saccade onset (gold). Positive values on the abscissa indicate combined responses above baseline. Error bars indicate SEM. Number of combined responses, in order of increasing baseline normalized response, was n = (8805, 8805, 8806, 8804, 8806, 7738, 7737, 7738, 7737, 7737, 7738, 7737, 7738, 7737, 7737) for fixation, and n = (2827, 1742, 1416, 1185, 1144, 1026, 1298, 1655, 2511, 3876, 6013, 7342, 7679, 9013, 11329) for the presaccadic condition. Middle, cumulative percentage of paired neuronal responses for which each individual response exceeds baseline during fixation (gray) and prior to saccade onset (gold). Bottom, difference in the mean rSC during fixation and prior to saccades. Error bars indicate Bonferroni-corrected (15 comparisons) 95% confidence intervals. Gray area indicates non-significant differences.
To further understand the presaccadic RF modulation, we examined PRF shift vectors across the entire distribution of measured RF locations (Fig. 2c) (Methods, Extended Data Fig. 6). We observed that PRFs shifted in the direction of the saccade target independent of their corresponding RF1 location. On average, PRFs were 6.1 dva closer to the saccade target than the RF1s (p < 10-10). We further compared PRFs to the remapping prediction, using the RF2s as an empirical estimate, and found PRFs to be closer to the saccade target than expected with remapping (p < 10-10). Thus, PRFs deviated from the remapping prediction and instead converged toward the saccade target. This pattern of results was the same when considering only single neurons, indicating that the convergence reflected the shifting of individual neuronal RFs rather than a differential gain change across multiple neurons (Methods, Extended Data Fig. 7,8).
Extended Data Figure 6. Centers of all measured FEF RFs.

Distribution of RF1s (dark gray), RF2s (light gray) and PRFs (gold) are shown in head centered (screen) coordinates. For RF1s and PRFs the monkey fixated FP1. For RF2s the monkey fixated FP2.
Extended Data Figure 7. Example of single neuron isolation, corresponding RF measurements, and waveform stability.

a, Density plot of isolated (left panel) and all other waveforms (right panel) recorded from a single U-Probe channel. b, Inter spike interval (ISI) histogram of the isolated waveform. The number of ISI violations and the estimated false positive rate are based on a refractory period of 1.5 ms. b, Averaged (arithmetic mean) waveforms (solid lines) for the fixation (left) and presaccadic (middle) condition, and their differences (right). Grey and gold dashed lines indicate 2 SDs. Black dashed lines enclose 95% confidence intervals. None of the depicted differences are statistically significant. d, Projection of fixation (grey) and presaccadic (gold) waveforms into principal component (PC) space. First two PC dimensions are shown. e, Distribution of Pseudo R2s (n = 40) resulting from logistic regression fits for each PC dimension in order to separate between fixation and presaccadic waveforms. Dnull designates the null deviance using the intercept in the regression exclusively. Dk designates the model deviance using a single PC dimension as predictor in addition. Perfect seperation would result in an R2 of 1. The mean of the depicted R2s is 0.01 (min = 2.9 · 10−6, max = 0.04). None of the R2s reached statistical significance (likelihood ratio chi square test). f, Performance of a linear support vector machine trained to discriminate between fixation and presaccadic waveforms using all 40 PC dimensions simultaneously. The estimated performance (gold line) of 59.4 % correct classifications falls well within the 95% range (37.1, 62.9) (red lines) of the expected chance performance. g, Fixation and presaccadic RF maps are shown together with their respective RF centers (black crosses, RF1, RF2, and PRF). Same conventions as in Figure 1. h, Histogram of the Pseudo R2s as obtained by logistic regressions for 21 neurons with stable waveforms. The mean R2 is 0.01 (min = 0, max = 0.23). None of the individual R2s reached statistical significance. i, Support vector machine classification performance of fixation and presaccadic waveforms for the same set of neurons. The mean correct classification performance is 50.1% (SD = 7.3). All performance estimates (gold ellipses) fall well within the expected ranges of chance performance (grey lines).
Extended Data Figure 8. RF shifts of single neurons and comparison with RF shifts in the remaining population.

a, The presaccadic shift amplitude (ΔPRE) as a function of the distance of RF1 from the saccade target (FP2) (ε’RF1) for well-isolated single neurons with stable waveforms (left) and for the remaining set of RFs (right). Lines denote fits of a linear regression. b, The angular deviation of the presaccadic RF shift from the remapping prediction (ϕ’) as a function of θ for the two subpopulations of RFs. c, Comparison of the population of presaccadic RF shifts (gold vectors) with the remapping prediction (gray vectors) for the two subpopulations of RFs. Vector origins and endpoints are based on, respectively, RF1 and RF2 (gray) and RF1 and PRF (gold).
We next examined how presaccadic changes in RFs altered the representation of visual space by the population of recorded FEF neurons. Rather than focus solely on RF centers, however, we instead measured how saccade preparation altered the degree to which each visual probe elicited responses from the neuronal population (Methods). Fig. 3a shows the percentage of “population RFs” yielding responses across all probe locations during fixation and saccade preparation. These distributions of “RF density” illustrate how the representation of visual space is displaced by the change in fixation from FP1 to FP2 in the population. Moreover, these RF density distributions revealed a substantial effect of saccade preparation on the representation of space. Specifically, we observed an increase in RF density centered on the saccade target. Within a 20 by 20 dva region around the saccade target, RF density increased more than twofold (106.4 %, p < 10-3). Note the more than threefold increase in the proportion of RFs with responses at locations nearest the target (Fig. 3b). These changes in RF density were accompanied by alterations in the presaccadic spike count correlations of simultaneously recorded neurons (Methods, Extended Data Figure 10), suggesting changes in effective connectivity12,13 during saccade preparation. The above observations point toward a substantial enhancement in the representation of visual space at the saccade target.
Figure 3. Fixation and presaccadic population RF densities of recorded FEF neurons.
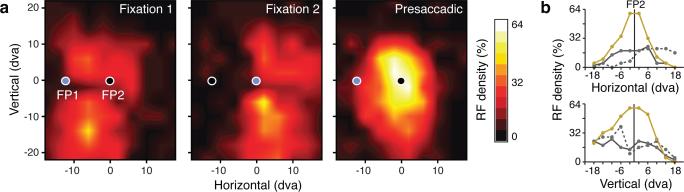
a, Panels plot the percentage of population RFs responsive for a given probe location. Blue circles denote the location of fixation. b, Panels show horizontal and vertical cross-sections through RF density plots centered on the saccade target (FP2) for fixation 1 (solid gray), fixation 2 (dotted gray) and presaccadic (gold) conditions.
Finally, we considered whether the presacaddic convergence of RFs to the saccade target results in a distorted “read-out” of stimulus location. In human observers, stimulus location during saccade execution is grossly misjudged. This mislocalization results in a “compression of visual space”, with observers reporting stimuli as appearing much closer to the saccade target than they actually are5,6. Therefore, we decoded probe positions from the full population of recorded FEF neurons during fixation at FP1 (Fig. 4a) and during saccade preparation (Fig. 4b) (Methods). During fixation, the location of probe stimuli near FP1 (x = [-10, -2], y = [-10, 6]), where most of the RFs were sampled, could be accurately decoded from the population response (average error = 1.3 dva). In contrast, during saccade preparation, probe locations within the same region of space were grossly mislocalized by the population of neurons (average error = 7 dva). Furthermore, the error was systematic in that the population response consistently mislocalized probes as being closer to the saccade target (Fig. 4c). The distance between the population estimate of probe location and the saccade target was reduced by 47% compared to fixation (-3.7 dva, p < 10-5) and by 46% compared to veridical (-3.6 dva, p < 10-4). Thus, the convergence of RFs resulted in a compression of visual space toward the target.
Figure 4. Localization of probe stimuli by the population of recorded FEF neurons.
a, Population estimate of probe locations within a 16 by 16 dva area of visual space during fixation at FP1. Vector origins denote the veridical probe location and the endpoints the average population estimate. Vector lengths denote the errors, measured as the average Euclidean distance to the veridical probe location. b, Population estimate of probe locations during saccade preparation to FP2. c, Left, reconstruction of probe stimulus grid from population estimates during fixation (dark gray) and during saccade preparation (gold).
Predictive remapping of RFs is widely assumed to be the mechanism by which perceptual stability is achieved during saccades1, specifically by a global anticipatory updating of visual space. Although our results demonstrate robust presaccadic shifts of FEF RFs, those shifts clearly violate the remapping prediction, and instead reveal a compression of visual space toward the saccade target. This observation raises an important question about the role of RF shifts in maintaining stability across eye movements. Specifically, how, if at all, might the convergence of RFs, rather than remapping, contribute to stable vision? It has been hypothesized by some that visual stability may be due to a strong bias of perceptual processing toward the targets of saccades14. This hypothesis argues that the failure to detect retinal image displacements results from a reduced representation of non-target locations, as compared to the overriding perception of target space15. Consistent with this hypothesis is psychophysical evidence of enhanced perception at the saccade target prior to movement onset16,17, as well as enhanced visual cortical signals18-21. Furthermore, the perception of visual space is massively compressed prior to saccades5,6. Our results reveal a neuronal correlate of these perceptual effects. In particular, we found that populations of FEF neurons grossly mislocalize stimuli as being closer to the target, resembling psychophysical compression. Thus, regardless of the role of the above perceptual phenomena in visual stability, the representation within the FEF mirrors them.
FEF neurons have been causally implicated in the control of visual attention8 and the corresponding modulation of stimulus-driven activity in posterior visual cortex9,10,22-24. Several recent studies suggest that the influence exerted by FEF neurons on visual cortex during attention originates from predominantly visual signals11,25. Our results indicate that FEF visual signals conveyed to posterior areas prior to saccades grossly overrepresent the space occupied by the target. Thus, prior to each eye movement, or during covert attention26,27, feedback from FEF neurons may impose the same distortion onto visual cortex28-30, and this biased representation of target space could result in the aforementioned attentional enhancement within that space.
Methods
General surgical and electrophysiological procedures
We used two male adult rhesus monkeys (Macaca mulatta, 8 and 12 kg), Monkey N and Monkey B, in the experiments. All experimental procedures were in compliance with the US Public Health Service policy on the humane care and use of laboratory animals, the Society for Neuroscience Guidelines and Policies, and Stanford University Animal Care and Use Committee. Each animal was surgically implanted with a titanium head post, a scleral search coil, and a cylindrical titanium recording chamber (20 mm diameter) overlaying the arcuate sulcus. A craniotomy was performed on each animal, allowing access to the FEF. All surgeries were conducted using aseptic techniques under general anesthesia (isoflurane), and analgesics were provided during postsurgical recovery.
Electrodes were lowered into the cortex using a hydraulic microdrive (Narishige International). Activity was recorded extracellularly using linear array electrodes (U-Probe, Plexon) with 16 contacts spaced 150 μm apart. Neural activity was sampled at 40 kHz. Waveforms were sorted using offline techniques. The FEF was confirmed by the ability to evoke fixed-vector, short latency saccadic eye movements with stimulation at low currents31,32. U-Probes were then lowered for simultaneous recordings of visual RFs at the same coordinates.
RF measurements and monkey behavior
We measured visual RFs of FEF neurons by randomly presenting a single probe stimulus out of a 10 by 9 probe grid extending 36 by 32 degree of visual angle (dva). In each recording session we placed the probe grid to cover the area where we expected most of the RF locations based on the evoked saccade vectors by microstimulation of a given recording site. The probes consisted of white squares with an area of 1 dva2 resulting in a positive luminance contrast of 60% (Michelson) and 3 (Weber) to the gray background (23.7 cd/m2). The probe duration was less than 25 ms as measured with a photodiode and thus comparable in duration to previous studies4,29.
In all three conditions (fixation 1, fixation 2, and presaccadic) the monkey was required to fixate one out of two fixation points (FP1 and FP2) placed 12 dva apart along the horizontal meridian. The fixation points FP1 and FP2 consisted of small (0.5 dva in diameter) red disks (23.6 cd/m2). The saccade task consisted of a standard step task4 in which the fixation point (FP1) was displaced to a new location and the monkey rewarded for shifting its gaze to it. The fixation and presaccadic conditions differed in terms of the timing of the visual probe stimulus with respect to the saccade. In the two fixation conditions, the probe stimulus was presented at least 500 ms before a saccade. In the presaccadic condition, the probe presentation occurred while the monkey was still fixating at the location of FP1 but already planning a saccade to FP2. The monkey was rewarded with a drop of juice if he was still fixating at the required location at the end of the trial (> 500 ms after probe presentation).
Fixation and saccade accuracy was excellent in both monkeys with an average horizontal error of 0.01 dva (SD = 0.29) and an average vertical error of -0.02 dva (SD = 0.29) in fixation. The average saccade vector was 11.98 dva (SD = 0.52) with an horizontal landing error of -0.19 (SD = 0.35) and a vertical error of -0.05 dva (SD = 0.4). The average saccadic reaction time, i.e. the time between target onset and saccade initiation, for Monkey N was 113 ms (SD = 35) and 229 ms (SD = 37) for Monkey B. We observed little or no evidence that monkeys were distracted by the probe appearance during saccade preparation. First, for both monkeys the rate at which stray saccades were made to probes was well below 1% (0.26% for monkey B and 0.11% for monkey N. Second, there was no systematic dependency of saccadic reaction time and probe location across the two monkeys (Extended Data Fig. 2). For all reported analyses we used the responses to probes that were presented within a time window of 150 ms prior to saccade onset. The average probe onset time was 64 ms before saccade onset (SD = 32) for Monkey N and 82 ms (SD = 38) for Monkey B.
RF maps and centers
We computed RF maps as shown in Fig. 1 as follows. For a given probe location k we obtained the neuronal activity akn for the time interval (50, 350] ms after probe onset for a given trial n. We then computed the average activity āk for each k as the arithmetic mean across n. This was done separately for the two fixation and the presaccadic conditions. Within each of these three conditions we then normalized mean activities āk by
with and linearly interpolated across space to obtain RF maps with a resolution of 0.1 by 0.1 dva.
The center (x̄,ȳ) in Cartesian coordinates for a given RF was then computed as the center of mass for all locations with responses greater or equal than 75 % of the maximum, that is
with
, and λ =0.75.
Dataset
In total, 27 experimental sessions yielded 179 recordings with measurable RFs in all of the three behavioral conditions (fixation 1, fixation 2, presaccadic) and were used for further analyses. We found no significant differences regarding the main results between RFs of well-isolated single neurons with stable waveforms and remaining RFs and thus combined all RFs for further analyses.
Statistical Analyses
Statistical analyses were performed using Mathematica (Wolfram Research) and R. In general, statistical tests were two-tailed. All reported p values regarding mean differences are based on t-tests. Non-parametric controls using Wilcoxon signed rank tests were significant as well for all reported effects regarding central tendencies (p values not shown). All reported correlations are based on Pearson's r. For all significant correlations Spearman's rho and Kendall's tau yielded the same result (p values not reported). Finally, all reported linear regressions are based on ordinary least square fits.
Time dependency of PRF shifts
Although our experiment was designed specifically to obtain spatially detailed measurements of presaccadic RFs, rather than to explore their temporal dynamics, we nonetheless considered whether the RF shifts were time dependent with respect to saccade onset. To address this question, we divided the distribution of probe presentation times into two periods by the median for each of the 179 presaccadic RFs. This reduced the data by half in each of the two periods. Nevertheless, we were able to obtain clear presaccadic RFs in 68 cases. The average probe presentation for the “earlier” half was 103 ms before saccade onset; whereas the average time for the “later” half was 55 ms. For the former, earlier period, we found that the average PRF shift was 8.09 dva, and for the latter, later period, the average PRF shift was 9.65 dva from their respective RF1s. The difference between these two shift amplitudes was significant (p < 10-4) (Extended Data Figure 3a), as was the difference in the distance of the PRFs to the saccade target, the later PRFs being closer on average by 1.26 dva (p < 10-4) (Extended Figure 3b). These data indicate that while there was already a substantial PRF shift as of the earlier time period, there was still significant shifting of the PRF in the later time period.
RF shift across space
To illustrate the average shift of RFs across space as shown in Fig. 2c, we averaged adjacent RF centers. Visual space was divided into equally sized bins (6 by 6 dva) ranging from −16 to 8 dva horizontally and from −24 to 24 dva vertically centered around the saccade target (FP2) (Fig. 2c lower right). This range included all RF1s, that is, centers of RFs measured while the monkey was fixating at FP1 long before and after a saccade. RF1s were than simply averaged (arithmetic mean) if they fell inside the same bin. The respective average RF2 and PRF was obtained accordingly based on the pairings obtained by the binned RF1s. Extended Data Fig. 6 shows all individual RF1s, RF2s, and PRFs.
Shifting of RFs in single neurons
We considered that the observed convergence of RFs toward the saccade target might be the result of two different processes. First, it could result from RF shifts in individual neurons toward the saccade target. A second, though less likely possibility, is that it reflects a differential gain change across multiple neurons. Specifically, it could result from a relative increase in the activity of neurons with RFs adjacent to the target, together with a simultaneous decrease in the activity of neurons with RFs at more distant locations. Importantly, RFs measured from multi unit activity do not allow one to easily distinguish between these two possibilities as this activity by definition includes the visual responses from multiple neurons. We therefore carried out separate analyses of RF shifts on a subpopulation of well-isolated, single neurons and confirmed that the spike waveforms from these neurons were identical across stimulus location and experimental conditions (fixation and presaccadic).
To accomplish this, we first considered a set of well-clustered waveforms (Extended Data Fig. 7a) as potential single-neuron isolations depending on the distribution of inter-spike intervals (ISI), and the corresponding estimated rate of false positive occurrences33 (Extended Data Fig. 7b). Out of the pool of well-isolated clusters, we identified 23 single neurons for which we were able to measure RFs in all 3 conditions. For these neurons the estimated false positive rates averaged 3.5% (1.5 ms refractory period)34. However, to directly assess the degree to which multiple neurons contributed differently to the fixation and presaccadic RFs, we systematically compared the waveforms of isolated neurons across the two conditions, specifically fixation 1 and presaccadic. In order to do so, we first subtracted the average waveforms (arithmetic mean) obtained from the two conditions by comparing waveforms obtained from responses at the most effective probe location for each condition (Extended Data Fig. 7c). Each waveform comparison yielded 40 differences (40 samples/ms) that were tested independently for statistical significance by constructing Bonferroni corrected 95% confidence intervals (α’ = α /40, α = 0.05). Thereafter, we projected waveforms for each neuron into principal component (PC) space (Extended Data Fig. 7d). For each PC dimension (40 in total) we fitted a logistic regression to test the separability of the two sets of waveforms independently within each dimension (Extended Data Fig. 7e). We accessed the statistical significance of the Pseudo R2 using Bonferroni correction again for each independent test. Finally, to test how well waveforms can be separated using all 40 PC dimensions simultaneously, we trained a linear Support Vector Machine (SVM) for each neuron using a “leave-one-out” cross validation based on all unique combination of fixation and presaccadic waveforms. We then compared the resulting estimate of classification performance to a distribution of performance estimates based on 10000 samples in which both fixation and presaccadic waveforms have been randomly assigned to one out of two groups for classification (Extended Data Fig. 7f). We found that 21 of the 23 isolations satisfied all of above criteria and thus allowed us to interpret the visual responses elicited during fixation and in the presaccadic period as coming from a single neuron. Extended Data Fig. 7g shows the corresponding fixation RFs and the presaccadic RF for the example neuron. Extended Data Fig. 7h,i shows the distributions of Pseudo R2s and the SVM performance for all neurons meeting the above criteria.
Finally, we compared the RF shifts observed in the above-selected neurons (well-isolated neurons with stable waveforms) to the remaining RFs in the overall population (Extended Data Fig. 8). This comparison revealed that for both populations the nature of the PRF shifts were statistically indistinguishable. First, the average displacement of RF2s from RF1s (ΔFIX) in both populations was approximately equal to the amplitude of the saccade, and was independent of the distance of RF1s to the saccade target (ε’RF1 ) (RFs of selected neurons: r = 0.36, p = 0.1; remaining RFs: r = 0.03, p = 0.66 ) (Extended Data Fig. 8a). More importantly, for both populations, the PRFs (ΔPRE) depended on the distance of RF1 to the saccade target (RFs of selected neurons: r = 0.48, p = 0.02; remaining RFs: r = 0.46, p < 10−8), with larger presaccadic shifts occurring for more distant RFs in both cases. Moreover, neither the intercepts (b0,p = 0.3) nor the slopes (b1, p = 0.42) of the fitted regressions were significantly different between the two populations. For the combined data shown in Fig. 2a we estimate for ΔFIX , b0 = 10.9 (p < 10−10 ) and b1 = 0.03 (p = 0.49 ) and for ΔPRE, b0 = 3.8 (p = 7.1·10−7) and b1 = 0.4 (p = 6·10−10). Second, the angular differences (ϕ’) between the RF2 displacement vectors and the PRF shift vectors in both populations depended on the angular deviation (θ) of the RF1 from the saccade vector (RFs of selected neurons: r = 0.87, p < 10−6; remaining RFs: r = 0.77, p < 10−9) (Extended Data Fig. 8b). Again, neither the intercepts (p = 0.43) nor the slopes (p = 0.06) of the fitted regressions were significantly different between the two populations. For the combined data shown in Fig. 2b we estimate b0 = −0.4 (p = 0.9) and b1 = 0.8 (p < 10−10). Lastly, in both populations, the PRFs were located closer to the saccade target (Extended Data Fig. 8c). Thus, overall the presaccadic RF shifts in both populations deviated from the remapping prediction, and instead converged toward the saccade target.
Relationship of our results to previous evidence of predictive remapping
Our results clearly demonstrate that rather than predictively remap, RFs in the FEF converge toward the saccade target. However, it is important to consider how previous evidence of predictive remapping in this area, and perhaps other areas, might have instead been indicative of RF convergence. Below, we summarize two key ways in which the present results provide a means of reinterpreting past studies in terms of RF convergence.
Our results illustrate the importance of obtaining a broad sampling of RF position across the visual field in a sample of neurons in order to understand the nature of presaccadic RF shifts. As illustrated in Figure 2a-c, both the shift direction and amplitude depend heavily on the initial RF position. Moreover, it illustrates how evidence consistent with remapping can be obtained within some portions of the visual field. The remapping hypothesis predicts that the PRF shifts to a neuron's post-saccadic location, sometimes called its “future field”4, in anticipation of the impending movement. Our results illustrate how evidence consistent with the remapping hypothesis can be obtained within select portions of the visual field, particularly locations near the fovea where RF convergence toward the saccade target, and shifts toward a hypothetical future field will look similar.
Our results can also explain how previous experiments using only a single presaccadic probe stimulus found evidence consistent with the remapping hypothesis. In the absence of a complete RF map, any observations of visual responses at or near the expected future field can be interpreted as consistent with remapping, even when the actual presaccadic RF shift is not predictive, and instead moves in an alternative manner, e.g. toward the saccade target. As is evident in Figures 1a and 1b, the deviation of the empirical presaccadic shift from the remapping prediction depends on the position of the RF within the visual field. At many RF locations, the results clearly deviate from remapping. However, at others locations the differences between remapping and convergence are smaller, and thus measurement of the presaccadic RF with only 1 probe stimuli cannot distinguish between them. This ambiguity is depicted in two additional examples shown in Extended Data Fig. 9. See also Zirnsak et al.35 for a discussion of this topic.
Extended Data Figure 9. Examples of RFs in which single probe results would be consistent with the remapping hypothesis.
Two examples of RF maps in which the presaccadic RF converges toward the saccade target, rather than remap, yet it is clear that sampling of responses from only a single location would yield results consistent with remapping. In each example, the two fixation and one presaccadic RF response maps, and corresponding RF centers (black crosses, RF1, RF2, and PRF) are shown from top to bottom, respectively. As in previous figures, the blue filled circle indicates the location of fixation during probe presentation, though in the presaccadic RF plot the monkey is preparing a saccade to FP2 (target). In addition, in each plot, the gold arrow denotes the vector describing the RF shift expected with remapping if that shift is exactly equal to the saccade vector (as in most studies). In addition, indicated along with the PRF of each example is the location to which the RF1 center is expected to shift with remapping if the location is based on the empirically mapped postsaccadic RF (RF2) (white square). Since FEF RFs are retinocentric, both predictions are virtually the same, but shown for clarity. Note that in both examples, although the PRF clearly deviates from the remapping prediction overall, the predicted remapping location nonetheless yields a clear visual response. Thus, if only a single probe is used, the results would be consistent with the remapping hypothesis. The vector plots below show the comparison of the empirical remapping prediction based on RF2 with the measured PRF shifts. Conventions are as in Figure 1.
RF density
To provide an estimate of how the representation of visual space by FEF RFs changes prior to a saccade, we first averaged RFs with adjacent centers. Visual space was divided into the same bins as described in Methods, ‘RF shift across space’. However, instead of just averaging the centers of RFs falling in a given bin we averaged the whole RFs. That is, based on the normalized RFs as described in Methods, ‘RF maps and centers’, the ith activity with i ∈ {1,...,22} to a probe stimulus at location k was computed as
where n is the number of RFs with RF1s falling in the same bin. Thereafter activities were again normalized by
with Aik' ∈ {0,...,1}. This was done for the two fixation and the presaccadic conditions and we refer to the resulting RFs as “population RFs”. We then counted the number of the population RFs for which the normalized activity to a given probe location k was equal to, or exceeded 50% of the maximum normalized activity. That is,
with
We refer to this quantity dRFas “RF density”. Note that this measure is minimally affected by the sampling bias of measured RFs.
Spike count correlations
Our multi-electrode recordings enabled us to explore the extent to which the RF convergence during saccade preparation is accompanied by changes in correlated neuronal responses. Correlated fluctuations in neuronal responses have been interpreted as reflecting effective connectivity12,13, so we hypothesized that the presaccadic RF convergence might lead to increases in these correlated fluctuations. From the 179 neuronal RFs, we computed spike count correlations from responses to all 90 probes in 677 neuronal pairs recorded simultaneously at varying inter-neuronal distances (Extended Data Fig. 10a). The spike count correlation was computed as
where is simply the Pearson product-moment correlation coefficient between the ith and jth neuronal response a over n trials for a given probe location k. The respective sample mean response is denoted by ā. Spikes were counted in the same time interval (50,350] ms after probe onset that was used to estimate the RF maps.
Given the known property of the Pearson product-moment correlation as a biased estimator of the true population correlation ρ for small samples and given the systematically fewer trials in the presaccadic condition as compared to the fixation condition (n̄pre = 9.5, n̄fix = 11.7), spike count correlations in the fixation condition have been computed as follows to match the number of trials in the presaccadic condition. For a given presaccadic correlation coefficient the corresponding fixation correlation coefficient was computed as the arithmetic mean of all which are based on all unique combinations of neuronal responses and if . For a given pair ij and k the rSC was only considered for further analyses if the number of trials was the ≥3.
The hypothesized increase in spike count correlation during saccade preparation should be observed particularly when neurons are visually driven. Thus, we related spike count correlations to driven activity, relative to baseline activity. To do so, we combined the responses of a given neuronal pair ij to a particular probe k, and normalized those responses to the baseline activity. That is, we first divided the individual mean response āk to a given probe by the respective baseline activity b̄, which was obtained from the average (arithmetic mean) of the spike rate bn, during fixation at the beginning of each trial n, before probe presentation, across all trials of a recording session. The time window within which spikes were counted for a given n to get bn was of the same size (300 ms) as was the window to obtain the probe related activity akn. The normalized response for a given pair and probe was then computed as
with ln(·) denoting the natural logarithm. Note that combined responses driven by the probe stimulus were thus > 0, with 0 indicating no change in the combined response compared to baseline.
The bins used in Extended Data Fig. 10b are based on data obtained during the fixation conditions, and were broken into quintiles for all , and deciles otherwise, given the higher number of normalized responses greater than 0. The same bins were then applied to compute the average spike count correlations in the presaccadic condition. For each bin, we also determined the percentage of combined responses for which both individual responses in the pair exceeded baseline activity (Extended Data Fig. 10b, middle.
First, we observed that the average spike count correlation decreased overall as a function of electrode distance between recorded responses (Extended Data Fig. 10a). Second, whereas the spike count correlation was reduced during saccade preparation, compared to fixation, when the combined response was at or below baseline (−0.06, p < 10−10), there was an increase when the combined response exceeded baseline (0.02, p < 10−7) (Extended Data Fig. 10b, top and bottom). Although the majority of combined above-baseline responses consisted of pairs in which both neuronal responses exceeded baseline (Extended Data Fig. 10b, middle), we also computed the overall change in spike count correlation for those pairs exclusively. The observed presaccadic increase in spike count correlation for those pairs was significantly greater than that of fixation (0.03, p < 10−10). Thus, as hypothesized, an increase in spike count correlation was observed when neuronal pairs were driven above baseline. This increase in spike count correlation during saccade preparation is consistent with the increase in the shared representation of visual space among neurons (Fig. 3), at least insofar as correlated fluctuations in neuronal responses reflect effective connectivity between pairs of neurons.
Population decoding
To decode the population activity of the recorded FEF neurons with respect to stimulus location during stable fixation and shortly before saccade onset we maximized the term
over probe location l 36. That is, for all N = 179 RFs we compare the vector a consisting of single responses a to a given probe location k on the nth trial to all vectors consisting of the averaged activity to l across all trials. The decoded location is simply the probe l that maximizes the above term, which is equivalent in finding the minimal angle between a given a and each . We did so by randomly and independently sampling aik with respect to n 10000 times for each the fixation condition (fixation 1) and the presaccadic condition. Note we assume that the same activity space () is used to infer the location of a stimulus that is presented just prior to a saccade as it is used to infer the location of a stimulus that is presented during stable fixation. That is, all are exclusively based on the neuronal activity recorded during the fixation condition. When decoding the stimulus location during fixation, representing the averaged activity to a stimulus at location l did not include a if k = l.
Acknowledgements
This work was supported by NIH grant EY014924 and HHMI (T.M.). We thank D.S. Aldrich for technical assistance.
Footnotes
Author Contributions M.Z. and T.M. designed the study. M.Z., B.N. and K.Z.X. performed the experiments. M.Z. and N.S. analyzed the data. M.Z., N.S. and T.M. wrote the manuscript.
References
- 1.Sommer MA, Wurtz RH. Brain circuits for the internal monitoring of movements. Annu. Rev. Neurosci. 2008;31:317–338. doi: 10.1146/annurev.neuro.31.060407.125627. [DOI] [PMC free article] [PubMed] [Google Scholar]
- 2.Duhamel JR, Colby CL, Goldberg ME. The updating of the representation of visual space in parietal cortex by intended eye movements. Science. 1992;255:90–92. doi: 10.1126/science.1553535. [DOI] [PubMed] [Google Scholar]
- 3.Walker MF, Fitzgibbon EJ, Goldberg ME. Neurons in the monkey superior colliculus predict the visual result of impending saccadic eye movements. J. Neurophysiol. 1995;73:1988–2003. doi: 10.1152/jn.1995.73.5.1988. [DOI] [PubMed] [Google Scholar]
- 4.Sommer MA, Wurtz RH. Influence of the thalamus on spatial visual processing in frontal cortex. Nature. 2006;444:374–377. doi: 10.1038/nature05279. [DOI] [PubMed] [Google Scholar]
- 5.Ross J, Morrone MC, Burr DC. Compression of visual space before saccades. Nature. 1997;386:598–601. doi: 10.1038/386598a0. [DOI] [PubMed] [Google Scholar]
- 6.Kaiser M, Lappe M. Perisaccadic mislocalization orthogonal to saccade direction. Neuron. 2004;41:293–300. doi: 10.1016/s0896-6273(03)00849-3. [DOI] [PubMed] [Google Scholar]
- 7.Robinson DA, Fuchs AF. Eye movements evoked by stimulation of frontal eye fields. J. Neurophysiol. 1969;32:637–648. doi: 10.1152/jn.1969.32.5.637. [DOI] [PubMed] [Google Scholar]
- 8.Moore T, Fallah M. Control of eye movements and spatial attention. Proc. Natl. Acad. Sci. U. S. A. 2001;98:1273–1276. doi: 10.1073/pnas.021549498. [DOI] [PMC free article] [PubMed] [Google Scholar]
- 9.Buschman TJ, Miller EK. Serial, covert shifts of attention during visual search are reflected by the frontal eye fields and correlated with population oscillations. Neuron. 2009;63:386–396. doi: 10.1016/j.neuron.2009.06.020. [DOI] [PMC free article] [PubMed] [Google Scholar]
- 10.Gregoriou GG, Gotts SJ, Zhou H, Desimone R. High-frequency, long-range coupling between prefrontal and visual cortex during attention. Science. 2009;324:1207–1210. doi: 10.1126/science.1171402. [DOI] [PMC free article] [PubMed] [Google Scholar]
- 11.Gregoriou GG, Gotts SJ, Desimone R. Cell-type-specific synchronization of neural activity in FEF with V4 during attention. Neuron. 2012;73:581–594. doi: 10.1016/j.neuron.2011.12.019. [DOI] [PMC free article] [PubMed] [Google Scholar]
- 12.Averbeck BB, Lee D. Coding and transmission of information by neural ensembles. Trends Neurosci. 2004;27:225–230. doi: 10.1016/j.tins.2004.02.006. [DOI] [PubMed] [Google Scholar]
- 13.Ecker AS, Berens P, Keliris GA, Bethge M, Logothetis NK, Tolias AS. Decorrelated neuronal firing in cortical microcircuits. Science. 2010;327:584–587. doi: 10.1126/science.1179867. [DOI] [PubMed] [Google Scholar]
- 14.Dodge R. The illusion of clear vision during eye movement. Psychol. Bull. 1905;2:193–199. [Google Scholar]
- 15.Currie CB, McConkie GW, Carlson-Radvansky LA, Irwin DE. The role of the saccade target object in the perception of a visually stable world. Percept. Pyschophys. 2000;62:673–683. doi: 10.3758/bf03206914. [DOI] [PubMed] [Google Scholar]
- 16.Deubel H, Schneider WX. Saccade target selection and object recognition: Evidence for a common attentional mechanism. Vision Res. 1996;36:1827–1837. doi: 10.1016/0042-6989(95)00294-4. [DOI] [PubMed] [Google Scholar]
- 17.Rolfs M, Carrasco M. Rapid simultaneous enhancement of visual sensitivity and perceived contrast during saccade preparation. J. Neurosci. 2012;32:13744–13752. doi: 10.1523/JNEUROSCI.2676-12.2012. [DOI] [PMC free article] [PubMed] [Google Scholar]
- 18.Sheinberg DL, Logothetis NK. Noticing familiar objects in real world scenes: the role of temporal cortical neurons in natural vision. J. Neurosci. 2001;21:1340–1350. doi: 10.1523/JNEUROSCI.21-04-01340.2001. [DOI] [PMC free article] [PubMed] [Google Scholar]
- 19.Khavat PS, Spekreijse H, Roelfsema PR. Correlates of transsaccadic integration in the primary visual cortex of the monkey. Proc. Natl. Acad. Sci. U. S. A. 2004;101:12712–12717. doi: 10.1073/pnas.0301935101. [DOI] [PMC free article] [PubMed] [Google Scholar]
- 20.Khavat PS, Spekreijse H, Roelfsema PR. Visual information transfer across eye movements in the monkey. Vision Res. 2004;44:2901–2917. doi: 10.1016/j.visres.2004.06.018. [DOI] [PubMed] [Google Scholar]
- 21.Bichot NP, Rossi AF, Desimone R. Parallel and serial neural mechanisms for visual search in macaque area V4. Science. 2005;308:529–534. doi: 10.1126/science.1109676. [DOI] [PubMed] [Google Scholar]
- 22.Moore T, Armstrong KM. Selective gating of visual signals by microstimulation of frontal cortex. Nature. 2003;421:370–373. doi: 10.1038/nature01341. [DOI] [PubMed] [Google Scholar]
- 23.Ekstrom LB, Roelfsema PR, Arsenault JT, Bonmassar G, Vanduffel W. Bottom-up dependent gating of frontal signals in early visual cortex. Science. 2008;321:414–417. doi: 10.1126/science.1153276. [DOI] [PMC free article] [PubMed] [Google Scholar]
- 24.Noudoost B, Moore T. Control of visual cortical signals by prefrontal dopamine. Nature. 2011;474:372–375. doi: 10.1038/nature09995. [DOI] [PMC free article] [PubMed] [Google Scholar]
- 25.Thompson KG, Bichot NP, Sato TR. Frontal eye field activity before visual search errors reveals the integration of bottom-up and top-down salience. J. Neurophysiol. 2005;93:337–351. doi: 10.1152/jn.00330.2004. [DOI] [PMC free article] [PubMed] [Google Scholar]
- 26.Connor CE, Preddie DC, Gallant JL, Van Essen DC. Spatial attention effects in macaque area V4. J. Neurosci. 1997;17:3201–3214. doi: 10.1523/JNEUROSCI.17-09-03201.1997. [DOI] [PMC free article] [PubMed] [Google Scholar]
- 27.Womelsdorf T, Anton-Erxleben K, Pieper F, Treue S. Dynamic shift of visual receptive fields in cortical area MT by spatial attention. Nat. Neurosci. 2006;9:1156–1160. doi: 10.1038/nn1748. [DOI] [PubMed] [Google Scholar]
- 28.Tolias AS, Moore T, Smirnakis SM, Tehovnik EJ, Siapas AG, Schiller PH. Eye movements modulate visual receptive fields of V4 neurons. Neuron. 2001;29:757–767. doi: 10.1016/s0896-6273(01)00250-1. [DOI] [PubMed] [Google Scholar]
- 29.Nakamura K, Colby CL. Updating of the visual representation in monkey striate and extrastriate cortex during saccades. PNAS. 2002;99:4026–4031. doi: 10.1073/pnas.052379899. [DOI] [PMC free article] [PubMed] [Google Scholar]
- 30.Hamker FH, Zirnsak M, Calow D, Lappe M. The peri-saccadic perception of objects and space. PLoS Comput. Biol. 2008;4:e31. doi: 10.1371/journal.pcbi.0040031. [DOI] [PMC free article] [PubMed] [Google Scholar]
- 31.Bruce CJ, Goldberg ME. Primate frontal eye fields. I. Single neurons discharging before saccades. J. Neurophysiol. 1985;53:603–635. doi: 10.1152/jn.1985.53.3.603. [DOI] [PubMed] [Google Scholar]
- 32.Moore T, Fallah M. Control of eye movements and spatial attention. Proc. Natl. Acad. Sci. U. S. A. 2001;98:1273–1276. doi: 10.1073/pnas.021549498. [DOI] [PMC free article] [PubMed] [Google Scholar]
- 33.Hill DN, Mehta SB, Kleinfeld D. Quality metrics to accompany spike sorting of extracellular signals. J. Neurosci. 2011;31:8699–8705. doi: 10.1523/JNEUROSCI.0971-11.2011. [DOI] [PMC free article] [PubMed] [Google Scholar]
- 34.Harris KD, Henze DA, Csicsvari J, Hirase H, Buzsaki G. Accuracy of tetrode spike separation as determined by simultaneous intracellular and extracellular measurements. J. Neurophysiol. 2000;84:401–414. doi: 10.1152/jn.2000.84.1.401. [DOI] [PubMed] [Google Scholar]
- 35.Zirnsak M, Lappe M, Hamker FH. The spatial distribution of receptive field changes in a model of peri-saccadic perception: predictive remapping and shifts towards the saccade target. Vision Res. 2010;50:1328–1337. doi: 10.1016/j.visres.2010.02.002. [DOI] [PubMed] [Google Scholar]
- 36.Abbott LF. Decoding neuronal firing and modeling neural networks. Q. Rev. Biophys. 1994;27:291–331. doi: 10.1017/s0033583500003024. [DOI] [PubMed] [Google Scholar]
- 37.Rao JS, SenGupta S. Topics in Circular Statistics. World Scientific; Singapore: 2001. [Google Scholar]