Abstract
Quantal neurotransmitter release at excitatory synapses depends on glutamate import into synaptic vesicles by vesicular glutamate transporters (VGLUTs). Of the three known transporters, VGLUT1 and VGLUT2 are expressed prominently in the adult brain, but during the first two weeks of postnatal development, VGLUT2 expression predominates. Targeted deletion of VGLUT1 in mice causes lethality in the third postnatal week. Glutamatergic neurotransmission is drastically reduced in neurons from VGLUT1-deficient mice, with a specific reduction in quantal size. The remaining activity correlates with the expression of VGLUT2. This reduction in glutamatergic neurotransmission can be rescued and enhanced with overexpression of VGLUT1. These results show that the expression level of VGLUTs determines the amount of glutamate that is loaded into vesicles and released and thereby regulates the efficacy of neurotransmission.
Vesicular release of glutamate is the major pathway of excitatory neurotransmission in the mammalian brain. Glutamatergic neurons express at least one of three known vesicular glutamate transporters, VGLUT1, VGLUT2, or VGLUT3. These transporters mediate glutamate uptake into synaptic vesicles and are driven by a proton electrochemical gradient generated by the vacuolar H+-ATPase (1–9). VGLUTs were initially identified as members of the type I Na+/inorganic phosphate transporter family (10, 11). Although other vesicular neurotransmitter carriers also depend on the activity of the vacuolar H+-ATPase, they belong to distinct protein families, one containing the vesicular γ-aminobutyric acid (GABA)/glycine transporter and the other the vesicular monoamine transporters as well as the vesicular acetylcholine transporter (12). Expression of VGLUTs may define glutamatergic phenotypes in neurons, given that forced expression of VGLUT1 and VGLUT2 in inhibitory neurons induces quantal glutamate release (2, 3).
In addition to their close resemblance at the sequence level, VGLUT1, VGLUT2, and VGLUT3 are highly similar with respect to substrate specificity, kinetics, and pharmacology (1–9). Glutamate transport by all three isoforms shows a characteristic biphasic dependence on chloride concentration (1, 5, 8, 9), that was first identified in the glutamate uptake activity of native synaptic vesicles (13–15).
In contrast to these similarities, the three VGLUTs differ in their expression profiles. In the adult brain the two predominant isoforms, VGLUT1 and VGLUT2, display roughly complementary expression patterns. For instance, VGLUT1 predominates in the cerebral and cerebellar cortices and hippocampus, whereas VGLUT2 expression is prominent in diencephalon, brainstem, and spinal cord (5, 6, 8). However, none of these brain regions exclusively express one isoform, and although the majority of glutamatergic neurons express either VGLUT1 or VGLUT2, several studies describe coexpression of both isoforms, for example, in cerebellar mossy fiber terminals (16, 17) and cerebellar unipolar brush cells (18). Most remarkably, a developmental switch from VGLUT2 to VGLUT1 occurs in the hippocampus, cortex, and cerebellum (19). The third isoform, VGLUT3, is less widely expressed than the other two. Surprisingly, this transporter is not expressed in bona-fide glutamatergic neurons but is rather found in cholinergic, serotoninergic, and even GABAergic neurons. VGLUT3 may therefore play a unique role in nonconventional glutamatergic neurotransmission (7, 9, 20). Although no differences in the transport characteristics of VGLUT1 and VGLUT2 have been identified to date, it is conceivable that they are associated with different modes of synaptic glutamate release, such as high- and low-fidelity synaptic transmission (5, 8, 21).
To investigate the role of VGLUTs in glutamatergic transmission, we generated and analyzed mice deficient for VGLUT1. We show that VGLUT1 expression becomes essential for survival at the time of the developmental switch from VGLUT2 to VGLUT1. Furthermore, although release probability does not seem to be controlled by the VGLUT isoform, the quantal size of glutamate release depends on the VGLUT expression level.
Methods
Generation of VGLUT1-/- Mice. The coding region of the VGLUT1 gene between the start codon and a BglII site in the fifth coding exon was replaced with a synaptobrevin 2-enhanced yellow fluorescent protein minigene followed by a loxP flanked neomycin resistance cassette through homologous recombination in embryonic stem cells (129/ola). Expression of synaptobrevin 2-enhanced yellow fluorescent protein was not detected before or after excision of the neomycin resistance cassette. Genomic regions used in construction of the targeting vector were cloned from a 129/Sv mouse genomic library in λfixII (Stratagene).
Protein Analysis and Morphology. Protein levels in crude synaptosomes were assessed by immunoblotting with commercially available primary (Chemicon and Synaptic Systems, Göttingen, Germany) and secondary antibodies (Bio-Rad), followed by visualization through enhanced chemiluminescence (Amersham Pharmacia). Paraformaldehyde perfusion, fixation, cryoprotection of brains, and subsequent sectioning and immunofluorescence analysis were performed as described (6, 7). Brain sections and cultured neurons were stained by using commercially available antibodies (Chemicon and Synaptic Systems), followed by detection with IgG-coupled Alexa Fluor dyes (Molecular Probes). False-color images of brain sections were obtained with a conventional epifluorescence microscope (Olympus BX61), and single plane images of cultured neurons were acquired with a Zeiss Axiovert 200-LSM510 laser scanning microscope.
Electrophysiology and Cell Culture. Microisland cultures of mouse postnatal-day-0 hippocampal neurons were prepared according to published procedures (22). Experiments were performed with hippocampal neurons between day in vitro 10 and 20, except for FM1-43 imaging experiments, for which neurons were assayed on day in vitro 15–24 according to published protocols (23). VGLUT1 rescue and overexpression experiments with Semliki Forest virus infection were performed with a modified VGLUT1 construct as published (2, 23, 24). Detection of the amplitudes of -/- evoked excitatory postsynaptic currents (EPSCs), which in most cases were extremely small, was confirmed by application of 30 μM AMPA receptor antagonist (2,3-dihydroxy-6-nitro-7-sulfamoylbenzo(f)quinoxaline). Recordings of miniature EPSCs (mEPSCs) were done in the presence of 300 nM tetrodotoxin, and for subtraction of noise, 3 mM kynurenic acid was applied. Exogenous GABA and kainate were applied at concentrations of 30 μM. Data acquisition and analyses were done as described (22), with values expressed as mean ± SE. Statistical significance of the release probability was assessed by an unpaired Kolmogorov–Smirnov test.
Results
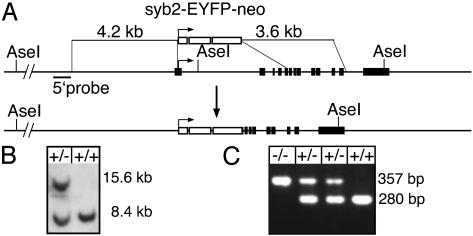
VGLUT1 Knockout (KO) Mice. We generated mice deficient for VGLUT1 through gene targeting in embryonic stem cells (Fig. 1A). Of 200 screened clones, one clone with the desired homologous recombination was identified by Southern blot analysis with a 5′ external probe (Fig. 1B). The recombination event was confirmed with a 3′ external probe and an internal probe (data not shown), and the clone was injected into C57BL/6 blastocysts. The offspring of chimeric males and subsequent generations were genotyped by PCR (Fig. 1C). VGLUT1-/- animals were born at the expected Mendelian frequency and were indistinguishable from their VGLUT1+/+ and VGLUT1+/- littermates at birth. The mutant animals displayed normal movements and feeding behavior for the first two weeks of postnatal development. However, at the beginning of the third week a failure to thrive became apparent. The VGLUT1-/- animals started lagging behind in their growth and began to differ noticeably from their littermates in their movements and behavior. The VGLUT1-/- animals developed a hunched posture and, although they continued to feed, became increasingly emaciated and less responsive toward the end of the third week, and they died between P18 and P21.
Fig. 1.
Targeting of VGLUT1. (A) Targeting vector and VGLUT1 locus before and after homologous recombination. The horizontal arrow indicates the start codon. Coding exons 1–5 were replaced by a synaptobrevin 2-enhanced yellow fluorescent protein neomycin resistance (syb2-EYFP-neo) cassette, the positions of AseI restriction sites and 5′ Southern probe are marked. (B) Genomic Southern blot with 5′ probe after AseI digest of stem-cell DNA. The replacement of 6.2 kb of the VGLUT1 locus with the 2.5-kb synaptobrevin 2-enhanced yellow fluorescent protein neomycin resistance cassette results in a shift of the 8.4-kb WT band to 15.6 kb. (C) Genomic PCR with 280 bp for WT and 357 bp for targeted locus.
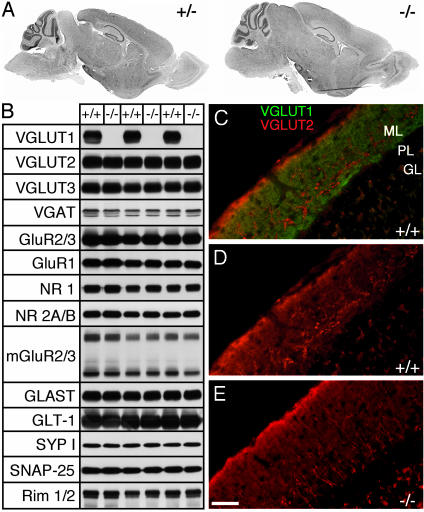
We chose animals at P17 to investigate whether the lack of VGLUT1 protein (Fig. 2B) causes defects in brain development. Comparison of Nissl-stained parasagittal sections of P17 -/-, +/+ and +/- brains revealed no morphological abnormalities in the -/- animals, although a general delay in growth and development was apparent (Fig. 2 A). We then examined the protein levels of the synaptic marker proteins synaptophysin, Synaptosomal-associated protein 25, and Rim by Western blotting, but we found no signs of altered expression (Fig. 2B). In addition, we detected no changes in the amount of VGLUT2, VGLUT3, vesicular GABA transporter, several glutamate receptor subunits (GluR2/3, GluR1, NR1, NR2A/B, mGluR2/3), and the plasma membrane glutamate transporters GLAST and GLT-1 (Fig. 2B), indicating that the absence of VGLUT1 did not induce compensatory changes in other proteins required for glutamatergic neurotransmission. Immunofluorescence analysis of VGLUT2 (Fig. 2) and VGLUT3 (Fig. 7 A and B, which is published as supporting information on the PNAS web site) revealed no obvious differences in the expression patterns in +/+ and -/- brains. Particularly, the developmental down-regulation of VGLUT2, which has been studied in most detail in the parallel fibers of the cerebellar cortex (19), was not changed in VGLUT1-/- mice (Fig. 2 D and E and data not shown). At P17, when VGLUT1 is found in parallel fibers throughout the molecular layer of the cerebellum in +/+ animals (Fig. 2C), both +/+ and -/- animals showed similar weak parallel fiber and bright climbing fiber VGLUT2 labeling (Fig. 2 D and E).
Fig. 2.
Protein and morphological analyses. (A) Parasagittal Nissl-stained brain sections of a P17 -/- animal and a +/- littermate. (B) Western blot of +/+ and -/- synaptosomes. VGAT, vesicular GABA transporter. SNAP-25, synaptosomal-associated protein 25. GluR, glutamate receptors. (C and D) Immunofluorescence analysis of VGLUT1 (green) and VGLUT2 (red) in P17 +/+ and -/- cerebellum. (C) VGLUT1+/+ staining is found throughout parallel fibers in the molecular layer (ML). VGLUT2 staining is weak, except in climbing fibers. PL, purkinje layer. GL, granular layer. (D) VGLUT2 staining alone in +/+, for comparison with VGLUT2 staining (E) in -/- cerebellum. (Scale bar, 40 μm.)
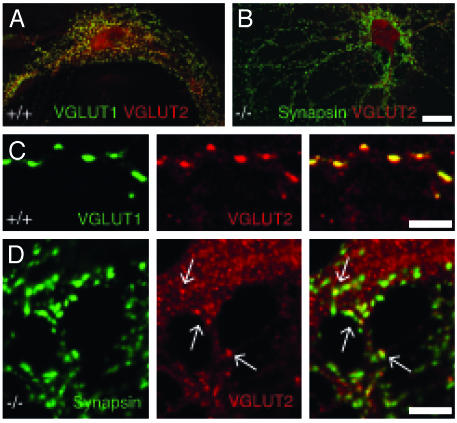
Expression of VGLUT1, VGLUT2, and VGLUT3 in Neuronal Cultures. To determine whether VGLUT1-/- glutamatergic neurons are completely silent or can still release residual glutamate, we used electrophysiological whole-cell recordings from individual autaptic hippocampal neurons grown on astrocyte microislands (22, 25). As VGLUT1 and VGLUT2 are coexpressed in vivo, we examined the degree of coexpression of VGLUT1 and VGLUT2 in the cultures used for electrophysiological recordings. Immunofluorescence analysis showed that in +/+ cultures the majority of neurons were positive for VGLUT1. In both +/+ and -/- cultures, ≈12% of neurons gave a strong signal for VGLUT2. In +/+ cultures, the VGLUT2 positive cells coexpressed VGLUT1 (Fig. 3 A and C). However, closer examination of the VGLUT2 staining in both +/+ and -/- cultures revealed that, in addition to the strongly labeled VGLUT2-positive cells we had originally counted, many neurons showed weak synaptic VGLUT2 staining apparent only at higher magnification (Fig. 3 B and D). In the neurons with weak VGLUT2 staining, not all synapses were stained for VGLUT2 equally well (Fig. 3D), indicating that in those neurons VGLUT2 protein levels were at the detection limit. VGLUT3-positive neurons were rare in our cultures, accounting for <1% of cells (Fig. 7 C and E).
Fig. 3.
VGLUT1 and VGLUT2 expression in autaptic neurons. (A) VGLUT1+/+ neuron with strong staining for VGLUT1 (green) and VGLUT2 (red). Colocalization is shown in yellow. (Scale bar: 25 μm.) (B) VGLUT1-/- neuron with small EPSC that is weakly positive for VGLUT2 (red), apparent at higher magnification in D. Synapses are stained for synapsin (green). (Scale bar, 25 μm.) (C) High magnification of VGLUT1 (green) and VGLUT2 (red) colocalization (yellow) in the +/+ neuron from A. (Scale bar, 5 μm.) (D) High magnification of -/- synapses labeled for synapsin (green). Some synapses are also positive for VGLUT2 (red). Clearly VGLUT2-positive synapses are marked with arrows, and colocalization with synapsin is shown in yellow. (Scale bar, 5 μm.)
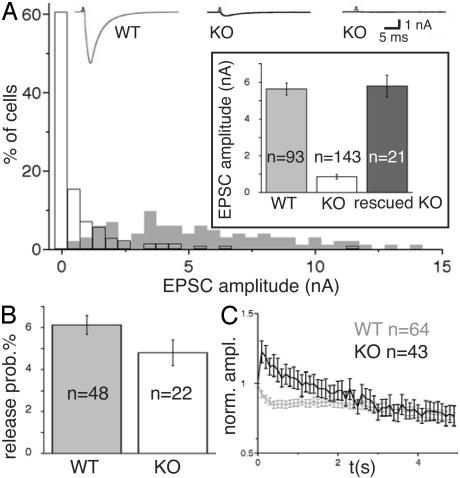
Reduced Evoked Release in VGLUT1 KO Neurons. When we recorded evoked responses (EPSCs) from the VGLUT1-/- autaptic cultures, in 12% of cells no EPSCs were detectable. The majority of cells produced small EPSCs, with the largest fraction in the 0.0–0.5 nA range (Fig. 4A). In contrast, amplitudes recorded from +/+ or +/- cultures were consistently >0.9 nA (Fig. 4A). Because +/+ and +/- cultures were indistinguishable from each other, we pooled +/+ and +/- data, designating them as WT and -/- as KO (Figs. 4, 5, and 6). The overall shift of EPSC amplitudes to significantly smaller sizes resulted in mean KO EPSC amplitudes of 0.9 ± 0.1 nA compared with mean WT EPSC amplitudes of 5.6 ± 0.3 nA (Fig. 4A Inset). We also performed immunofluorescence analysis of neurons used for EPSC recording. Of six KO cells with small amplitudes, VGLUT2 staining was weak in five cells (Fig. 3 B and D) and below detection limit in one cell. These data indicate that the expression of VGLUT2 is responsible for the majority of small EPSCs recorded from VGLUT1 KO autaptic neurons.
Fig. 4.
EPSC amplitudes and release probability. (A) Sample traces from WT and small response KO cells and distribution of EPSC amplitudes from WT (gray) and KO neurons. (Inset) Mean amplitudes of WT, KO, and KO neurons rescued with a VGLUT1 Semliki Forest virus. (B) Release probabilities calculated from the ratio of EPSC and readily releasable pool size. (C) EPSC amplitudes during a 10-Hz stimulation, normalized to the size of the first response.
Fig. 5.
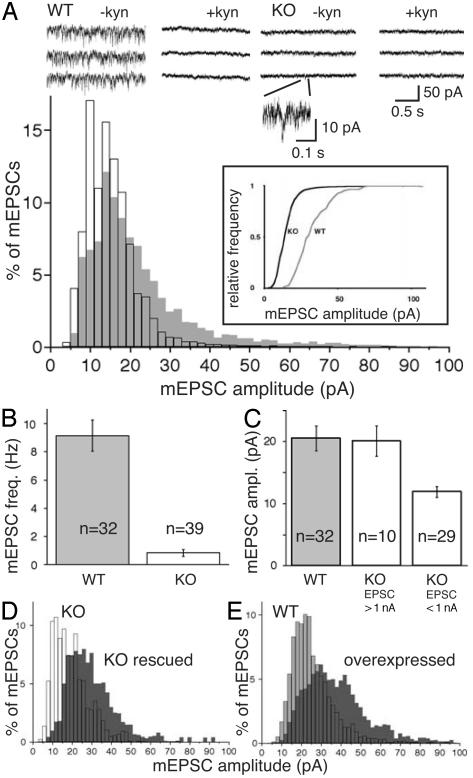
mEPSC frequency and amplitude. (A) Sample traces of mEPSC recordings in WT and KO neurons in the presence and absence of kynurenic acid. A KO mEPSC is magnified, and distribution of mEPSC amplitudes in WT (gray) and KO neurons is shown. (Inset) Cumulative representation of mEPSC distribution. (B) mEPSC frequency, silent KO neurons not included. (C) Mean mEPSC amplitudes with KO neurons sorted according to evoked EPSC size. (D) Rescue of KO cells with VGLUT1 (dark gray) shifts mEPSC amplitudes to larger values. (E) VGLUT1 overexpression in WT cells (dark gray) shifts mEPSC amplitudes to sizes larger than WT (gray) amplitudes.
Fig. 6.
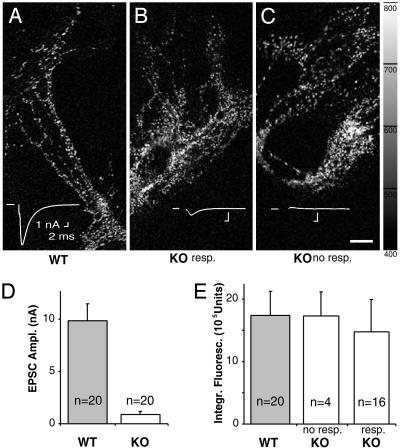
FM1-43 staining and destaining. The fluorescence difference before and after specific destaining is shown. Synaptic FM1-43 uptake and release is indistinguishable between WT neurons (A), KO neurons with small EPSCs (B), and silent KO neurons (C). (D) Mean EPSC sizes of imaged WT and KO neurons. (E) Mean integrated FM1-43 fluorescence differences in WT cells and KO cells with small evoked responses and no response. (Scale bar, 20 μm.)
Rescue of KO cells by overexpressing VGLUT1 through infection with Semliki Forest virus restored the KO EPSC amplitudes to values comparable with WT amplitudes (rescued KO, 5.8 ± 0.6 nA) (Fig. 4A Inset). However, even without rescue, VGLUT1 KO cultures contained some cells with WT-like amplitudes (Fig. 4A), which presumably corresponded to the cells expressing high levels of VGLUT2 or to cells with weak VGLUT2 expression but a large number of synapses.
To test whether the development of autapses under the influence of reduced glutamate release results in alterations of postsynaptic ionotropic receptor expression, we examined responses to exogenously applied kainate (at a concentration sufficient to activate AMPA receptors) and GABA. Responses in VGLUT1 KO cells were indistinguishable from WT responses (kainate: WT, 1.9 ± 0.2 nA; KO, 2.0 ± 0.2 nA, and GABA: WT, 67.6 ± 6.3 nA; KO, 63.0 ± 4.9 nA), indicating that postsynaptic changes are unlikely to contribute to the reduced KO EPSC amplitudes.
Release Probability in VGLUT1 KO Neurons. VGLUT1 and VGLUT2 expression in vivo has been associated with neurons that display low and high release probabilities, respectively (5, 8, 21). To determine whether VGLUT2 expression is associated with high release probability, we assessed the ratio between average EPSC charge and size of the vesicle pool released in response to application of hypertonic sucrose solution, which is a measure of release probability. VGLUT1 KO cells with sufficient amplitude sizes had slightly smaller average release probabilities than WT cells, but the difference was statistically not significant (Fig. 4B). Another measure of release probability is the direction of change in amplitude size during high frequency stimulation. During a 10-Hz stimulation protocol, the EPSC amplitude steadily decreased in WT cells, whereas in KO cells the second EPSC during the train exceeded the size of the first response, and responses only then fell to values smaller than the first EPSC (Fig. 4C). This transient facilitation indicates that the VGLUT1 KO cells have a slightly lower initial release probability. Thus, VGLUT2 expression as such is not sufficient to determine an increase in release probability.
Reduced Spontaneous Release and Quantal Size in VGLUT1 KO Neurons. Because most VGLUT1 KO cells showed reduced EPSC amplitudes, we determined whether the reduced evoked responses were produced through the release of normal numbers of partially filled vesicles, release of a reduced pool of completely filled vesicles, or a combination of both. For that purpose, we recorded the release frequency and amplitude of spontaneous events (mEPSCs). From 26% of KO cells, no mEPSCs were recorded. KO cells with detectable mEPSCs showed both a drastically reduced release frequency (WT, 9.2 ± 1.1 Hz; KO, 0.8 ± 0.2 Hz) (Fig. 5B) and a significant shift of mEPSC amplitude sizes to smaller values (Fig. 5A), which is best seen if the amplitude distribution is plotted cumulatively (Fig. 5A Inset). This shift in mEPSC amplitude size is at least a partial explanation for the reduction in mEPSC frequency, because events smaller than noise level escape detection. Because we were concerned about the validity of mEPSC signals detected in KO cells, experiments comparing KO with WT mEPSCs were done in the presence and absence of kynurenic acid (Fig. 5A) to achieve a reversible block of the AMPA receptor-mediated mEPSCs. Background noise recorded during the kynurenate blockade was then subtracted for each individual recording. Sorting of VGLUT1 KO cells according to EPSC amplitude size revealed that KO cells with WT-like evoked responses also showed mean mEPSC amplitudes of WT size (WT, 20.5 ± 2.0 pA; KO, 20.1 ± 2.5 pA) (Fig. 5C). In remarkable contrast to this finding, the mean mEPSC amplitude of KO cells with small evoked responses was reduced to ≈60% of WT size (KO, 11.9 ± 0.8 pA) (Fig. 5C).
Increased Quantal Size in Neurons Overexpressing VGLUT1. Given the weak VGLUT2 immunostaining in the majority of neurons in VGLUT1 KO cultures, we assumed that the levels of VGLUT2 in these cells falls short of the protein levels usually achieved by the presence of VGLUT1 in combination with VGLUT2. Because removal of VGLUT1 resulted in a reduction of both mEPSC size and frequency, we speculated that the total level of VGLUTs present in a given neuron controls quantal size of vesicular release. Remarkably, rescue of KO cells with Semliki Forest virus mediated overexpression of VGLUT1 resulted in a shift in the mEPSC amplitude distribution to sizes larger than WT values (Fig. 5D). The same effect was apparent in WT cells overexpressing VGLUT1 (Fig. 5E), confirming the hypothesis that levels of VGLUTs determine quantal size.
Synaptic Exocytosis and Endocytosis in Silent VGLUT1 KO Neurons. The influence of VGLUT levels on quantal size indicated that partially filled vesicles undergo fusion and that WT vesicles are not necessarily filled to their maximal capacity. Because of the severe reduction in mEPSC frequency in KO cells, we determined whether neurons have a checkpoint mechanism to prevent fusion of empty or minimally filled vesicles. For that purpose, we measured activity-dependent recycling of synaptic vesicles by using the lipophilic dye FM1-43. EPSC amplitudes were determined, and the synapses were then loaded with FM1-43 and subsequently unloaded under high frequency stimulation. The difference in fluorescence signals before and after unloading was used as a measure of specific endocytosis and exocytosis and integrated for each neuron. As seen previously, mean EPSCs of KO cells were drastically reduced compared with WT (Fig. 6D). The cells were sorted according to genotype and EPSC size, which resulted in three groups: WT cells (Fig. 6 A and E), KO cells with a measurable response (Fig. 6 B and E), and silent KO cells (Fig. 6 C and E). There was no significant difference in the specific FM1-43 staining and destaining of WT cells, KO cells with measurable EPSCs, and silent KO neurons, indicating that there was no difference in exocytotic and endocytotic activity of WT and KO synapses.
Discussion
The survival of the VGLUT1-deficient mice to the end of the third postnatal week and their normal development during the first two weeks underscore the predominance of VGLUT2-driven glutamatergic transmission during early brain maturation. The VGLUT1 KO mice die at the age when a strong up-regulation of VGLUT1 through newly emerging VGLUT1 synapses as well as a replacement of the previously predominant VGLUT2 isoform in cerebellar, hippocampal, and cortical neurons occur (19, 26). This down-regulation of VGLUT2 is independent of VGLUT1 up-regulation and biological activity, given that it occurs in VGLUT1 KO mice. Although the cause of death of the VGLUT1 KOs is unclear, the progressive lack of glutamatergic transmission in many areas of the developing brain and peripheral systems may lead to the shutdown of multiple organ systems. Given that VGLUT1 is also expressed in pancreas, where glutamate may influence hormone secretion (27, 28), the emaciated appearance of the older KO mice despite continuing feeding indicates a role of glutamatergic transmission in control of nutrient uptake and metabolism.
To determine the function of VGLUT1 in excitatory synaptic transmission, we concentrated on the synaptic effects in individual neurons lacking VGLUT1. KO cells fell into three groups with respect to their EPSC amplitudes. Cells in the first two groups, which represent the majority, were either silent or showed drastically reduced evoked responses. The normal synaptic FM1-43 uptake and release activity of these cells, combined with the fact that spontaneous mEPSCs were either detected at very low frequencies and amplitudes or not at all, are indicative of exocytosis of empty or partially empty synaptic vesicles.
Cells in the third group showed EPSC sizes similar to those in WT cultures. This finding was not unexpected, because strongly VGLUT2-positive cells were present in our cultures. However, the high number of weakly VGLUT2-positive cells was surprising and provides the most likely explanation for the small EPSCs we measured. VGLUT2 is the predominant isoform in neonates, from which the hippocampal neurons were prepared; whereas, in the adult hippocampus, VGLUT1 is more prevalent (8, 9, 19). Given that in WT cultures all VGLUT2-positive cells also expressed VGLUT1, the switch from VGLUT2 to VGLUT1 was at least partially recapitulated during maturation in vitro but was incomplete at the time of analysis. Although it is not possible to quantify VGLUT1 and VGLUT2 protein levels in individual cells, the correlation between weak VGLUT2 staining and small EPSC amplitudes indicates that VGLUT2 expression in these cells was too low to sustain complete filling of all vesicles.
The residual presence of VGLUT2 in VGLUT1 KO cells allowed us to assess the effects of VGLUT protein levels on vesicle filling status. In the absence of VGLUT1, the mEPSC amplitude distribution was shifted to smaller values. However, mEPSC mean amplitude size was not reduced in all cells but rather specifically in the group of KO cells that also showed reduced EPSC size. This result indicates that only in those cells, VGLUT2 levels were inadequate for filling individual vesicles to WT levels. Even more strikingly, overexpression of VGLUT1 in KO and WT cells enhanced mEPSC amplitudes to sizes larger than WT values. Taken together, our data indicate that the number of VGLUT molecules per synaptic vesicle has a major impact on quantal size in glutamatergic neurons. Thus, the number of VGLUT molecules per vesicle not only determines the filling rate but also the maximal filling level. Dynamic changes in filling rates would be important under conditions of maximal synaptic activity but have not been shown to occur in vivo. However, the change in quantal size of spontaneous release as a function of VGLUT expression levels seen here indicates that dynamic changes in the maximal filling level of vesicles do occur in vivo.
A scenario in which the number of VGLUT molecules per vesicle controls the maximal vesicular glutamate concentration is best explained by a dynamic equilibrium between transporter-mediated uptake and efflux by a mechanism that is at least partially independent of VGLUTs. Indeed, glutamate is known to leak from synaptic vesicle preparations, but the mechanism of this leak and the bioenergetics of vesicular glutamate transport remain to be clarified (12, 29). Although glutamate uptake is known to be chloride-dependent and to stimulate acidification of vesicles (13–15), it is not clear how pH, net charge, and osmotic balance are maintained (30), whether cotransport or antiport of other ions takes place, or whether the regulatory mechanisms are partially independent of VGLUTs. Nonetheless, our data support a model according to which the maximal vesicular glutamate concentration, rather than having a fixed set-point, reaches a variable steady-state defined by uptake and efflux rates (31), with uptake depending not only on the properties of the transporter but also on the number of transporter molecules per vesicle. Variations in either VGLUT expression levels or synaptic delivery of VGLUTs could therefore have significant impact on synaptic transmission.
The strength of a synaptic connection is defined by the size of the postsynaptic response, but both postsynaptic and presynaptic factors determine response size and contribute to short-term and long-term forms of synaptic plasticity (32–34). On the presynaptic side, changes in release probability are one source of the variability of synaptic efficacy. However, variations in quantal size represent a second major contributing factor (21). For instance, variability in EPSC size in hippocampal neurons is to a large degree due to variations in the glutamate concentration reached in the synaptic cleft (35), although quantal variance appears to undergo developmental down-regulation at some CNS synapses (36). Even though several factors, such as the site of release, may play a role in such effects, the present study shows that vesicular content at glutamatergic synapses is variable and therefore a potential control point in presynaptic plasticity.
Although it remains to be seen how exactly and on what time scale vesicular transporters affect modulation of neurotransmitter content, several other studies also suggest a general role for vesicular transporters at least in the long-term control of quantal size (37). At the frog neuromuscular junction, the vesicular acetylcholine transporter expression level seems to be the limiting factor for cholinergic quantal size (38), and the same appears to be true for vesicular packaging of monoamines, which is enhanced by vesicular monoamine transporter 2 overexpression in PC12 cells and ventral midbrain neurons, whereas total monoamine stores are reduced in the brains of vesicular monoamine transporter 2+/- mice (39–41). In vivo, demands made on the vesicular filling rate are likely to differ between vesicular acetylcholine transporter, vesicular monoamine transporter, and VGLUT, and they might be particularly high for VGLUT. Because of the small pool of recycling vesicles at glutamatergic synapses, rapid refilling has to occur (42, 43), and differences between synapses in the number of transporter molecules present per vesicle are likely to affect the efficacy of synaptic transmission. In this context, it should be noted that vesicular neurotransmitter transporters have been shown to be regulated by heterotrimeric G proteins (44), hence both filling rate and filling levels might be controlled by multiple mechanisms.
Given the similar properties of VGLUT1 and VGLUT2, it is likely that the absolute number of VGLUTs per vesicle and not subtle kinetic differences between the two transporters are responsible for the effects on quantal size in VGLUT1 KOs. Thus, the question of the functional significance of the expression of three different isoforms remains unresolved. Based on their expression patterns, a functional correlation between expression of VGLUT2 and high fidelity neurotransmission and between VGLUT1 and connections with lower release probabilities (and therefore higher plasticity) has been postulated (5, 8, 21). However, in contradiction to the apparent association between VGLUT2 and neurons with presumably high release probabilities in vivo, our analysis of VGLUT1 KO cultures revealed a slightly lower release probability for VGLUT2-expressing cells. Our data therefore argue against the possibility that the VGLUT isoform expressed by a glutamatergic neuron is a major factor in determining release probability.
Nonetheless, whether a neuron expresses VGLUT1 or VGLUT2 may still be of relevance to the type of synaptic connection, because the transporters may for instance have distinct synaptic interaction partners. Moreover, they may differ in the control of their transcription levels or synaptic delivery. A detailed assessment of the degree to which VGLUT1 and VGLUT2 are functionally interchangeable could be achieved through genetic replacement of one isoform with the other. For example, VGLUT2 in place of the VGLUT1 locus might not fully rescue the VGLUT1 KO phenotype and could aid in the uncovering of subtle differences between VGLUT1 and VGLUT2 expressing neurons.
Supplementary Material
Acknowledgments
We thank M. Schindler, A. Zeuch, I. Herfort, F. Benseler, I. Thanhäuser, and S. Handt for excellent technical assistance; G. Meyer for critical reading of the manuscript; and A. Miyawaki for plasmids. S.T. is a recipient of the Japan Society for the Promotion of Science Postdoctoral Fellowship for Research Abroad, and N.B. is a recipient of the Human Frontier Science Program Grant RG00124/2000-B.
Abbreviations: VGLUT, vesicular glutamate transporter; GABA, γ-aminobutyric acid; EPSC, excitatory postsynaptic currents; mEPSC, miniature EPSC; KO, knockout.
References
- 1.Bellocchio, E. E., Reimer, R. J., Fremeau, R. T., Jr. & Edwards, R. H. (2000) Science 289, 957-960. [DOI] [PubMed] [Google Scholar]
- 2.Takamori, S., Rhee, J. S., Rosenmund, C. & Jahn, R. (2000) Nature 407, 189-194. [DOI] [PubMed] [Google Scholar]
- 3.Takamori, S., Rhee, J. S., Rosenmund, C. & Jahn, R. (2001) J. Neurosci. 21, RC182. [DOI] [PMC free article] [PubMed] [Google Scholar]
- 4.Takamori, S., Malherbe, P., Broger, C. & Jahn, R. (2002) EMBO Rep. 3, 798-803. [DOI] [PMC free article] [PubMed] [Google Scholar]
- 5.Fremeau, R. T., Jr., Troyer, M. D., Pahner, I., Nygaard, G. O., Tran, C. H., Reimer, R. J., Bellocchio, E. E., Fortin, D., Storm-Mathisen, J. & Edwards, R. H. (2001) Neuron 31, 247-260. [DOI] [PubMed] [Google Scholar]
- 6.Herzog, E., Bellenchi, G. C., Gras, C., Bernard, V., Ravassard, P., Bedet, C., Gasnier, B., Giros, B. & El Mestikawy, S. (2001) J. Neurosci. 21, RC181. [DOI] [PMC free article] [PubMed] [Google Scholar]
- 7.Gras, C., Herzog, E., Bellenchi, G. C., Bernard, V., Ravassard, P., Pohl, M., Gasnier, B., Giros, B. & El Mestikawy, S. (2002) J. Neurosci. 22, 5442-5451. [DOI] [PMC free article] [PubMed] [Google Scholar]
- 8.Varoqui, H., Schafer, M. K., Zhu, H., Weihe, E. & Erickson, J. D. (2002) J. Neurosci. 22, 142-155. [DOI] [PMC free article] [PubMed] [Google Scholar]
- 9.Schafer, M. K., Varoqui, H., Defamie, N., Weihe, E. & Erickson, J. D. (2002) J. Biol. Chem. 277, 50734-50748. [DOI] [PubMed] [Google Scholar]
- 10.Ni, B., Rosteck, P. R., Jr., Nadi, N. S. & Paul, S. M. (1994) Proc. Natl. Acad. Sci. USA 91, 5607-5611. [DOI] [PMC free article] [PubMed] [Google Scholar]
- 11.Aihara, Y., Mashima, H., Onda, H., Hisano, S., Kasuya, H., Hori, T., Yamada, S., Tomura, H., Yamada, Y., Inoue, I., et al. (2000) J. Neurochem. 74, 2622-2625. [DOI] [PubMed] [Google Scholar]
- 12.Gasnier, B. (2000) Biochimie 82, 327-337. [DOI] [PubMed] [Google Scholar]
- 13.Maycox, P. R., Deckwerth, T., Hell, J. W. & Jahn, R. (1988) J. Biol. Chem. 263, 15423-15428. [PubMed] [Google Scholar]
- 14.Naito, S. & Ueda, T. (1985) J. Neurochem. 44, 99-109. [DOI] [PubMed] [Google Scholar]
- 15.Hartinger, J. & Jahn, R. (1993) J. Biol. Chem. 268, 23122-23127. [PubMed] [Google Scholar]
- 16.Hisano, S., Sawada, K., Kawano, M., Kanemoto, M., Xiong, G., Mogi, K., Sakata-Haga, H., Takeda, J., Fukui, Y. & Nogami, H. (2002) Brain Res. Mol. Brain Res. 107, 23-31. [DOI] [PubMed] [Google Scholar]
- 17.Hioki, H., Fujiyama, F., Taki, K., Tomioka, R., Furuta, T., Tamamaki, N. & Kaneko, T. (2003) Neuroscience 117, 1-6. [DOI] [PubMed] [Google Scholar]
- 18.Nunzi, M. G., Russo, M. & Mugnaini, E. (2003) Neuroscience 122, 359-371. [DOI] [PubMed] [Google Scholar]
- 19.Miyazaki, T., Fukaya, M., Shimizu, H. & Watanabe, M. (2003) Eur. J. Neurosci. 17, 2563-2572. [DOI] [PubMed] [Google Scholar]
- 20.Fremeau, R. T., Jr., Burman, J., Qureshi, T., Tran, C. H., Proctor, J., Johnson, J., Zhang, H., Sulzer, D., Copenhagen, D. R., Storm-Mathisen, J., et al. (2002) Proc. Natl. Acad. Sci. USA 99, 14488-14493. [DOI] [PMC free article] [PubMed] [Google Scholar]
- 21.Liu, G. (2003) Curr. Opin. Neurobiol. 13, 324-331. [DOI] [PubMed] [Google Scholar]
- 22.Pyott, S. J. & Rosenmund, C. (2002) J. Physiol. 539, 523-535. [DOI] [PMC free article] [PubMed] [Google Scholar]
- 23.Rosenmund, C., Sigler, A., Augustin, I., Reim, K., Brose, N. & Rhee, J. S. (2002) Neuron 33, 411-424. [DOI] [PubMed] [Google Scholar]
- 24.Ashery, U., Varoqueaux, F., Voets, T., Betz, A., Thakur, P., Koch, H., Neher, E., Brose, N. & Rettig, J. (2000) EMBO J. 19, 3586-3596. [DOI] [PMC free article] [PubMed] [Google Scholar]
- 25.Bekkers, J. M. & Stevens, C. F. (1991) Proc. Natl. Acad. Sci. USA 88, 7834-7838. [DOI] [PMC free article] [PubMed] [Google Scholar]
- 26.Minelli, A., Edwards, R. H., Manzoni, T. & Conti, F. (2003) Brain Res. Dev. Brain Res. 140, 309-314. [DOI] [PubMed] [Google Scholar]
- 27.Hayashi, M., Morimoto, R., Yamamoto, A. & Moriyama, Y. (2003) J. Histochem. Cytochem. 51, 1375-1390. [DOI] [PubMed] [Google Scholar]
- 28.Bai, L., Zhang, X. & Ghishan, F. K. (2003) Am. J. Physiol. Gastrointest. Liver Physiol. 284, G808-G814. [DOI] [PubMed] [Google Scholar]
- 29.Reimer, R. J., Fremeau, R. T., Jr., Bellocchio, E. E. & Edwards, R. H. (2001) Curr. Opin. Cell Biol. 13, 417-421. [DOI] [PubMed] [Google Scholar]
- 30.Maycox, P. R., Hell, J. W. & Jahn, R. (1990) Trends Neurosci. 13, 83-87. [DOI] [PubMed] [Google Scholar]
- 31.Williams, J. (1997) Neuron 18, 683-686. [DOI] [PubMed] [Google Scholar]
- 32.Atwood, H. L. & Karunanithi, S. (2002) Nat. Rev. Neurosci. 3, 497-516. [DOI] [PubMed] [Google Scholar]
- 33.Malenka, R. C. & Nicoll, R. A. (1999) Science 285, 1870-1874. [DOI] [PubMed] [Google Scholar]
- 34.Conti, F. & Weinberg, R. J. (1999) Trends Neurosci. 22, 451-458. [DOI] [PubMed] [Google Scholar]
- 35.Liu, G., Choi, S. & Tsien, R. W. (1999) Neuron 22, 395-409. [DOI] [PubMed] [Google Scholar]
- 36.Wall, M. J. & Usowicz, M. M. (1998) Nat. Neurosci. 1, 675-682. [DOI] [PubMed] [Google Scholar]
- 37.Reimer, R. J., Fon, E. A. & Edwards, R. H. (1998) Curr. Opin. Neurobiol. 8, 405-412. [DOI] [PubMed] [Google Scholar]
- 38.Song, H., Ming, G., Fon, E., Bellocchio, E., Edwards, R. H. & Poo, M. (1997) Neuron 18, 815-826. [DOI] [PubMed] [Google Scholar]
- 39.Fon, E. A., Pothos, E. N., Sun, B. C., Killeen, N., Sulzer, D. & Edwards, R. H. (1997) Neuron 19, 1271-1283. [DOI] [PubMed] [Google Scholar]
- 40.Pothos, E. N., Larsen, K. E., Krantz, D. E., Liu, Y., Haycock, J. W., Setlik, W., Gershon, M. D., Edwards, R. H. & Sulzer, D. (2000) J. Neurosci. 20, 7297-7306. [DOI] [PMC free article] [PubMed] [Google Scholar]
- 41.Wang, Y. M., Gainetdinov, R. R., Fumagalli, F., Xu, F., Jones, S. R., Bock, C. B., Miller, G. W., Wightman, R. M. & Caron, M. G. (1997) Neuron 19, 1285-1296. [DOI] [PubMed] [Google Scholar]
- 42.Harata, N., Pyle, J. L., Aravanis, A. M., Mozhayeva, M., Kavalali, E. T. & Tsien, R. W. (2001) Trends Neurosci. 24, 637-643. [DOI] [PubMed] [Google Scholar]
- 43.Schikorski, T. & Stevens, C. F. (1997) J. Neurosci. 17, 5858-5867. [DOI] [PMC free article] [PubMed] [Google Scholar]
- 44.Ahnert-Hilger, G., Holtje, M., Pahner, I., Winter, S. & Brunk, I. (2003) Rev. Physiol. Biochem. Pharmacol. 150, 140-160. [DOI] [PubMed] [Google Scholar]
Associated Data
This section collects any data citations, data availability statements, or supplementary materials included in this article.


