Abstract
Faithful maintenance and propagation of eukaryotic genomes is ensured by three-step DNA ligation reactions employed by ATP-dependent DNA ligases1,2. Paradoxically, when DNA ligases encounter nicked DNA structures with abnormal DNA termini, DNA ligase catalytic activity can generate and/or exacerbate DNA damage through abortive ligation that produces chemically adducted, toxic 5′-adenylated (5′-AMP) DNA lesions3–6 (Fig. 1a). Aprataxin (Aptx) reverses DNA-adenylation but the context for deadenylation repair is unclear. Here we examine the importance of Aptx to RNaseH2-dependent excision repair (RER) of a lesion that is very frequently introduced into DNA, a ribonucleotide. We show that ligases generate adenylated 5′-ends containing a ribose characteristic of RNaseH2 incision. Aptx efficiently repairs adenylated RNA-DNA, and acting in an RNA-DNA damage response (RDDR), promotes cellular survival and prevents S-phase checkpoint activation in budding yeast undergoing RER. Structure-function studies of human Aptx/RNA-DNA/AMP/Zn complexes define a mechanism for detecting and reversing adenylation at RNA-DNA junctions. This involves A-form RNA-binding, proper protein folding and conformational changes, all of which are impacted by heritable APTX mutations in Ataxia with Oculomotor Apraxia 1 (AOA1). Together, these results suggest that accumulation of adenylated RNA-DNA may contribute to neurological disease.
Previous studies indicate that abortive ligation (AL) (Fig. 1a) may occur during attempts to repair DNA lesions generated by oxidation4–7 or alkylation7,8. We explored a much more abundant opportunity for AL, i.e., during ribonucleotide excision repair (RER)9. RER is initiated when RNase H2 cleaves on the 5′ side of a ribonucleotide found in a 5′-RNA-DNA-3′ junction (Fig. 1b, referred to hereafter as RNA-DNA junction). This event is estimated to generate more than 1,000,000 nicked RNA-DNA junctions per cell cycle in mice10 and more than 10,000 nicked RNA-DNA junctions per cell cycle in budding yeast 11–13. Our study was promoted by the fact that ribonucleotides are introduced into the nuclear genome at levels that are much greater than all known types of DNA damage combined, and evidence that DNA ligation in vitro is impaired at incised RNA-DNA junctions 1, 14. We compared the ability of human DNA ligase I to seal a nick containing canonical 3′-OH and 5′-P termini to a nick containing a 3′-OH and a 5′-P attached to a rG that mimics a nick generated when RNase H2 initiates RER (Fig. 1b). Greater than 95 % of the nicked DNA substrate containing the 3′-OH and 5′-P termini was ligated within 10 min. In contrast, the presence of a single ribonucleotide (rG) on the 5′ side of the nick (5′-RNA substrate, Fig. 1b) significantly impaired generation of the 39 nt ligation product (< 1% ligation at 10 minutes, Extended Data Fig. 1a). Ligase I processing of the 5′-RNA substrate also produced an additional species migrating at a size of ~20 nt, that corresponds to a bona-fide 5′-adenylated product (5′-AMPRNA-DNA) (Fig. 1b and Extended data Fig. 1b). The adenylated product comprises greater than 50% of all ligase I catalytic events on the 5′-RNA substrate at all time points measured (Fig. 1c and Extended Data Fig. 1a). Also, human DNA ligase III and phage T4 DNA ligase, but not E. coli NAD-dependent LigA, generated similar amounts of ribonucleotide-triggered AL products (Fig. 1c). Thus, incised RNA-DNA junctions are poor substrates for eukaryotic DNA ligase nick sealing reactions, and also trigger AL at high frequency in vitro.
Figure 1. Abortive ligation at RNA-DNA junctions is resolved by Aptx.
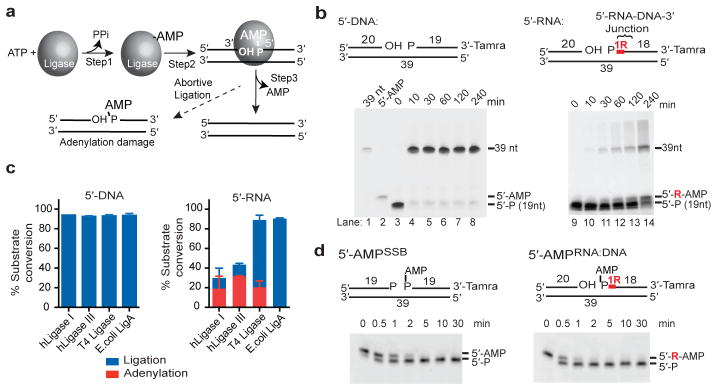
a, ATP-dependent DNA ligation: 1, ATP-dependent DNA ligase adenylation. 2, AMP is transferred to the DNA 5′ phosphate to form 5′-AMP. 3, alignment of a DNA 3′-hydroxyl with 5′-AMP within the ligase active site facilitates the nick sealing reaction. Ligase encounter with distorting termini triggers AL. b, DNA ligation is aborted at RNA-DNA junctions. Red “R” shows position of ribonucleotide. c, Quantification of total catalytic events producing sealed DNA ends (39 nt product, blue bars) or abortive DNA adenylation (red bars) by DNA ligases. Mean ± s.d. (n=2 replicates) is displayed for 60 min ligation reactions. d, hAptx DNA-adenylate hydrolysis. Reactions contained 2 nM hAptx and 10 nM of the indicated substrate.
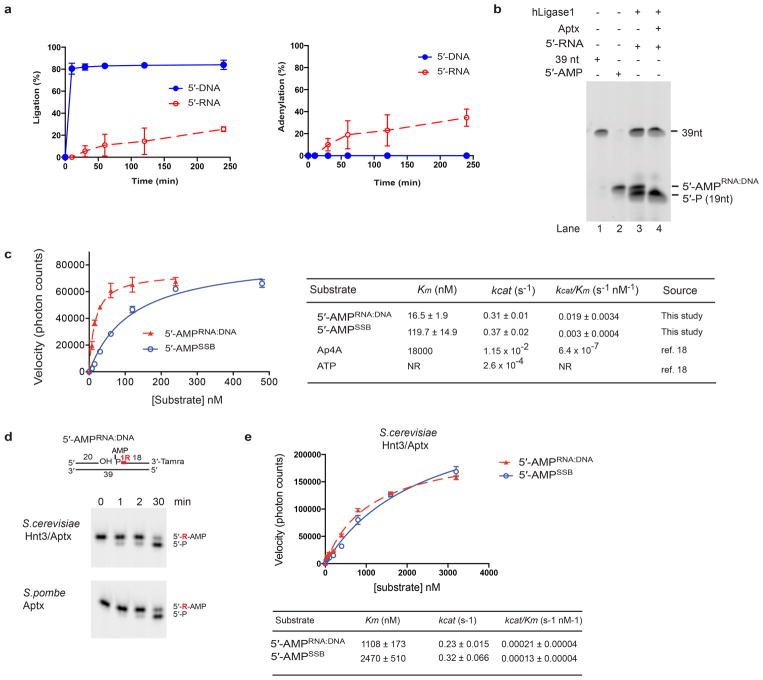
Extended Data Figure 1. Aptx homologs efficiently process products of abortive DNA ligation at RNA-DNA junctions.
a, Abortive DNA ligation reaction time course. DNA ligation reactions for human DNA ligase I were monitored at the indicated time points. The percent ligation was measured by quantitating the total amount of 39 nt ligation product evolved as a percentage of total unprocessed substrate (Fig. 1b, 5′-P species). The percent adenylation was measured by quantitating the total amount of 5′-AMP product evolved as a percentage of total unprocessed substrate. Substrates used are those described in Figure 1b. Mean ± s.d. (n=2 technical replicates) is displayed. b, Recombinant human Aptx specifically processes the adenylated product of DNA ligase I abortive ligation at an incised RNA-DNA junction. DNA ligation reactions (see Fig. 1b) on 5′-RNA substrates were stopped with addition of 5 mM EDTA at 240 min. Recombinant hAptx (165–342) catalytic domain was added following abortive ligation (lane 4). hAptx specifically processed the “5′-AMPRNA:DNA” species generated by abortive ligation at the RNA-DNA junction, but does not process the 19 nt 5′-P substrate, or the 39 nt ligation product, confirming the “5′-AMPRNA:DNA” species is a bona fide adenylation product. c, Kinetic parameters of hAptx processing of oxidative DNA damage and RNA-DNA junction derived adenylated substrates. Mean ± s.e.m (n=2 technical replicates) is displayed. d, 5′-AMPRNA-DNA deadenylation activity is an evolutionary conserved function of fission and budding yeast Aptx/Hnt3. Reaction conditions used were as for Fig. 1d. e, Kinetic parameters of S. cerevisiae Aptx (Hnt3) deadenylation processing. Kinetic experiments were performed as described in the Methods. Mean ± s.e.m (n=2 technical replicates) is displayed.
Aprataxin deadenylase (Aptx in mammals and Schizosaccharomyces pombe, and Hnt3 in Saccharomyces cerevisiae) reverses DNA adenylation4. Inactivation of APTX in Ataxia Oculomotor Apraxia 1 (AOA1)15–17 suggests that persistent adenylated DNA strand breaks drive cerebellar degeneration in neurological disease4. However, the molecular context for Aptx deadenylation remains uncertain. To examine a potential role for Aptx during RER, we compared steady state kinetic parameters for deadenylation by human Aptx on gel-purified AL substrates arising from metabolism of RNA-DNA junctions (5′-AMPRNA-DNA) to those representative of AL on DNA single strand breaks created by reactive oxygen species4 (5′-AMPSSB) (Fig. 1d and Extended Data Fig. 1c). Both substrates were efficiently processed with comparable rates (kcat = 0.31 vs. 0.37 s−1) with catalytic efficiencies that are ~30,000 fold higher than those reported on nucleotide substrates18. A ~6-fold higher kcat/km for 5′-AMPRNA-DNA versus 5′-AMPSSB indicates hAptx displays an in vitro preference for the RNA-DNA-derived substrates.
Both S. pombe Aptx and S. cerevisiae Hnt3Aptx also harbor 5′-AMPRNA-DNA deadenylase activity (Extended Data Fig. 1d and 1e). To determine if Aptx deadenylates AL products generated at RNA-DNA junctions in vivo, we examined if the phenotypes of budding yeast strains with varying capacity to incorporate and repair ribonucleotides were altered by Hnt3Aptx deficiency (Fig. 2). A M644G variant of the leading strand replicase, DNA polymerase ε (Pol ε, encoded by the POL2 gene, see Extended Data Table 1), has increased capacity to incorporate ribonucleotides into DNA in vitro and in vivo13,19. We generated heterozygous diploids in which one copy of HNT3 was replaced with the NatMX4 marker. Tetrad analysis shows that although HNT3 was dispensable for growth in a wild-type Pol ε (POL2) strain, growth of pol2-M644G hnt3Δ haploids was severely impaired (Fig. 2a), with macroscopic colonies only observed following extended incubation (Extended Data Fig. 2a).
Figure 2. Yeast Hnt3Aptx is critical for resolving AL intermediates that arise following incision at genomic ribonucleotides by RNase H2.
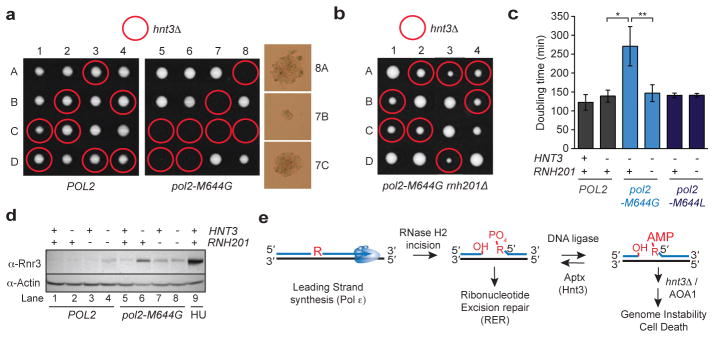
a, Tetrad analysis of HNT3/hnt3::natMX diploids. 1–8 are tetrad dissections and A-D are haploid spore colonies. Right: Day 3 microscopic spore colonies in the pol2-M644G hnt3Δ strains. b, Tetrad analysis of a HNT3/hnt3::natMX diploids in the pol2-M644G rnh201Δ background. Plates imaged at 3 days. c, Deletion of HNT3 in the pol2-M644G mutator confers a slow growth phenotype that is eliminated by deleting RNH201. Doubling times (Dt) were calculated from cultures in the logarithmic phase of growth in rich medium at 30 °C. Average Dt ± s.d. are calculated from 4 biological replicates (8 for the pol2-M644G hnt3Δ genotype, *, P < 0.0007; **, P < 0.0011 (two-tailed t-test). d, Immunoblotting of whole cell extracts was performed using an antibody to Rnr3. e, RNase H2 cleavage at ribonucleotides incorporated during Pol ε leading strand DNA synthesis leads to AL intermediates requiring Aptx processing. Aptx deficiency or in Ataxia Oculomotor Apraxia 1 (AOA1) (or the deletion hnt3Δ) creates persistent adenylated strand breaks.
Extended Data Table 1.
Saccharomyces cerevisiae strains
| Name | Strain | Relevant Genotype | Source |
|---|---|---|---|
| wt | SNM8 | POL2 | ref. 13 |
| rnh201Δ | SNM106 | POL2 rnh201::hphMX4 | ref. 13 |
| pol2-M644G | SNM70 | pol2-M644G | ref. 13 |
| pol2-M644L | SNM82 | pol2-M644L | ref. 13 |
|
pol2-M644G rnh201Δ |
SNM120 | pol2-M644G rnh201::hphMX4 | ref. 13 |
|
pol2-M644L rnh201Δ |
SNM132 | pol2-M644L rnh201::hphMX4 | ref. 13 |
|
pol2-M644G rnh201Δ hnt3Δ |
YJW122 | pol2-M644G rnh201::hphMX4 hnt3::natMX4 | This study |
| hnt3Δ | YJW131 | POL2 hnt3::natMX4 | This study |
|
hnt3Δ rnh201Δ |
YJW132 | POL2 hnt3::natMX4 rnh201::hphMX4 | This study |
|
pol2-M644G hnt3Δ |
YJW177 | pol2-M644G hnt3::natMX4 isolate 1 | This study |
|
pol2-M644G hnt3Δ |
YJW208 | pol2-M644G hnt3::natMX4 isolate 2 | This study |
|
pol2-M644G hnt3Δ |
YJW210 | pol2-M644G hnt3::natMX4 isolate 3 | This study |
|
pol2-M644L hnt3Δ |
YJW183 | pol2-M644L hnt3::natMX4 | This study |
|
pol2-M644L rnh201Δ hnt3Δ |
YJW154 | pol2-M644L rnh201::hphMX4 hnt3::natMX4 | This study |
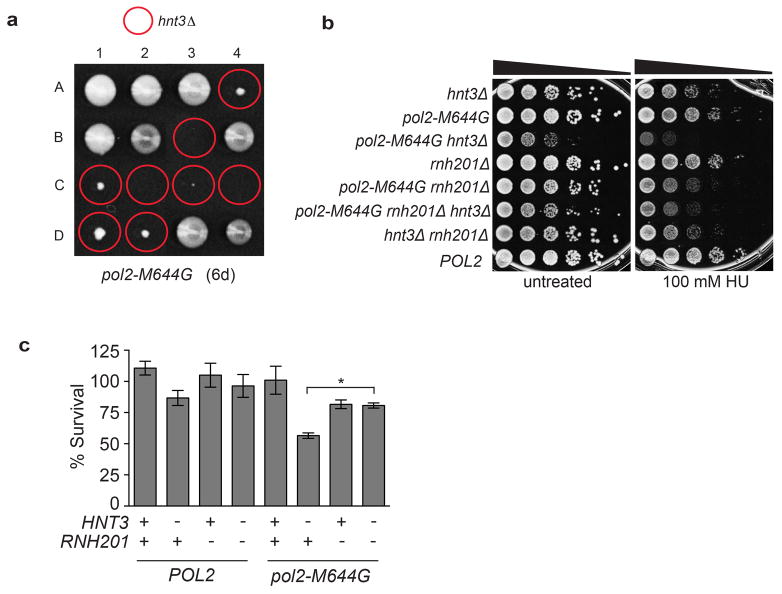
Extended Data Figure 2. HNT3 in the pol2-M644G strain impairs growth and causes genotoxin-sensitivity.
a, Tetrad analysis of the HNT3/hnt3::natMX4 diploid in the pol2-M644G strain background reveals the severe growth defect of the haploid pol2-M644G hnt3Δ mutant. The plate was scanned after 6 days growth on rich medium. b, c Deleting HNT3 in the pol2-M644G strain impairs growth and causes genotoxin-sensitivity that is reduced upon deletion of RNH201. b, Serial (10-fold) dilutions of cells were plated on rich medium ± 100 mM HU and photographed after 3 days of growth at 30 °C. c, A quantitative HU-survival assay was performed as in 12. Data is displayed as the mean ± s.d. (n=3 independent experiments) with % survival calculated as the percentage of surviving cells (grown on YPDA agar + 100 mM HU) compared to the untreated control. *, P <0.0002; (two-tailed t-test).
We hypothesized that the growth defect of the pol2-M644G hnt3Δ strain is linked to accumulation of persistent adenylated DNA strand breaks generated by DNA ligase processing of RNase H2 incised RNA-DNA junctions (i.e. 5′-AMPRNA-DNA). To test if RNase H2 activity contributes to the impaired growth of the pol2-M644G hnt3 mutant, we sporulated and dissected a diploid strain homozygous for deletion of the gene encoding the catalytic subunit of RNase H2 (RNH201). Strikingly, deleting RNH201 (rnh201Δ) largely mitigated the growth defect of the pol2-M644G hnt3Δ mutant (Fig. 2b–c). This observation implies that incision of ribonucleotides in DNA by RNase H2 generates an RER intermediate leading to production of 5′-AMPRNA-DNA that requires deadenylation by Hnt3Aptx(see model, Fig. 2e).
Increased Rnr3 protein level is a sensitive indicator of S-phase checkpoint activation12, 20. An elevated level of the Rnr3 subunit of ribonucleotide reductase was detected in pol2-M644G hnt3Δ cells (Fig. 2d, lane 6), but was reduced in the triple mutant pol2-M644G hnt3Δ rnh201Δ strain (lane 8) to a level equivalent to that of a pol2-M644G rnh201Δ mutant (lane 7). This suggests that failure of Hnt3Aptx to deadenylate 5′-AMPRNA-DNA lesions activates the S-phase checkpoint. We also tested hnt3Δ mutant strains for sensitivity to genotoxic stress caused by hydroxyurea (HU). HU treatment increases rNMP incorporation10 and induces replication fork stalling. Growth of the pol2-M644G hnt3Δ mutant on rich medium was slowed, and survival in the presence of HU was reduced (Extended Data Fig. 2b–c). Importantly, deleting RNH201 reduced HU-sensitivity to a level comparable to pol2-M644G rnh201Δ cells (Extended Data Fig. 2c).
Next we examined the consequences of loss of Hnt3 function in yeast strains containing a Pol ε variant with reduced capacity to incorporate ribonucleotides, pol2-M644L 13. With fewer ribonucleotides in the genome, the pol2-M644L hnt3Δ mutant displayed normal growth (Fig. 2c), and was unaffected by deleting RNH201. The stark contrast between the consequences of loss of Hnt3 function in the pol2-M644G variant (high genomic ribonucleotides) versus the pol2-M644L mutant (reduced genomic ribonucleotides) is consistent with the model wherein Hnt3Aptx deadenylates genotoxic AL intermediates arising during RER of ribonucleotides incorporated by Pol ε during DNA replication (Fig. 2e). A genetic interaction between HNT3 and RNH201 is not apparent in a POL2 strain, possibly because adenylated RNA-DNA junctions may be removed by alternative nucleolytic processing, e.g., mediated by Rad27Fen1 and Mre11/Rad50/Xrs2Nbs1 nucleases8.
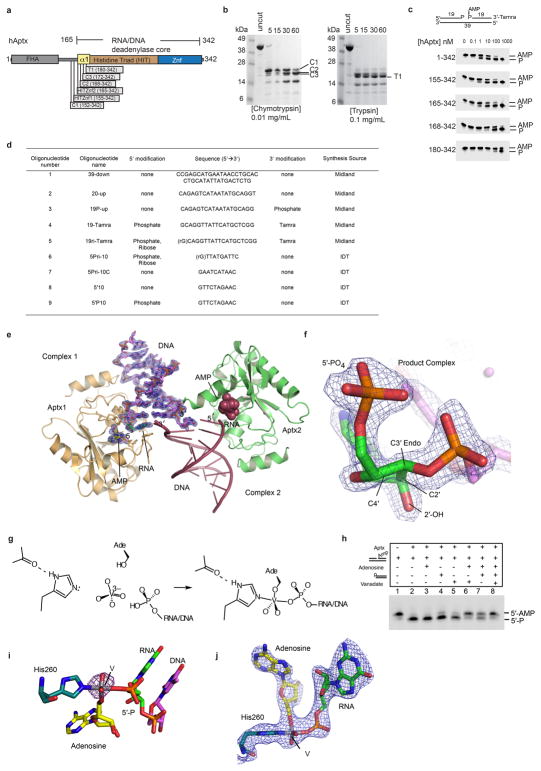
Having implicated Aprataxins in processing 5′-AMPRNA-DNA in vitro and in vivo, we aimed to define the molecular basis for 5′-AMPRNA-DNA processing by human Aptx. Structural analysis of the Schizosaccharomyces pombe Aptx DNA-complex revealed the architecture of the yeast Aptx HIT-Znf domain, and a basis for engagement of DNA ends3. However, the molecular basis for the Aptx RNA-DNA interactions, and the mechanism of the Aptx DNA damage direct reversal catalytic reaction remain unclear (see Supplementary Discussion). The minimal catalytic domain of hAptx was mapped to residues 165–342 using deletion mutagenesis, limited proteolysis and deadenylation assays (Extended Data Fig. 3a–c). We then determined four X-ray crystal structures of 1) an RNA-DNA bound hAptx/5′-AMP/RNA-DNA/Zn quaternary product complex, 2) a mimic of an adenylated RNA-DNA processing enzymatic transition state, 3) a DNA-only bound hAptx/5′-AMP/DNA/Zn quaternary complex structure and 4) an AOA1 mutant hAptx-K197Q RNA-DNA bound quaternary product complex, (see Supplementary Discussion, Extended Data Table 2, Extended Data Fig. 3).
Extended Data Figure 3. hAptx domain mapping and structure determination.
a, Aptx protein domain schematic. b, Protease stable domains in hAptx were identified with limited tryptic and chymotryptic digests. (Left) Chymotryptic proteolysis of full-length hAptx produces clustered cut sites (C1 through C3) flanking the N-terminus of the hAptx histidine triad (HIT) domain helix. (Right) Tryptic proteolysis of full-length hAptx produces a major cut site (T1) near the N-terminus of the HIT domain. This analysis reveals a meta-stable HIT-Znf domain encompassing residues 152–342, and a chymotrypsin resilient core bounding residues 172–342. c, A comparison of the DNA 5′-deadenylation activities of the chymotyptic C2 fragment (aa 168–342), a smaller tryptic fragment (T1, aa 180–342) and two designed recombinant fragments (HIT-Znf1, aa 155–342, and HIT-Znf2, aa 165–342), shows that the HITZnf2 fragment, but not the smaller C2 and T1 fragments retain robust deadenylation activity. Further, the N-terminal boundary of the minimal catalytic domain in the absence of damaged DNA substrate is accessible to proteolytic digest. The HITZnf2 (165–342) fragment was used for crystallization studies. d, Table of crystallization and assay oligonucleotides. e, The product complex crystallographic asymmetric unit contains two copies of the Aptx/RNA-DNA/AMP/Zn complex. An omit (the RNA-DNA duplex and AMP were excluded from the model for electron density map calculation) σ-A weighted 1.95 Å Fo-Fc map is displayed contoured at 3.0 σ overlaid upon the AMP and RNA-DNA duplex for Complex 1. DNA unwinding of the terminal base pair also facilitates crystallization and formation of a one nucleotide base-pair between the two complexes. f. An omit (the RNA-DNA and AMP were excluded from the model for electron density map calculation) σ-A weighted 1.95 Å Fo-Fc map is displayed contoured at 3.5 σ overlaid upon the terminal 5′-rG, showing clearly the location of the 2′-OH and the C3′-endo sugar pucker of the 5′–terminal nucleotide. g, Assembly of the Aptx/AMP/RNA-DNA/Vanadate transition state mimic complex. Soaking of an adenosine RNA/DNA bound crystal form with orthovanadate facilitates an in crystallo reaction, and formation of the Aptx/AMP/RNA-DNA/Vanadate covalent complex. h, Adenosine and orthovanadate addition in the presence of a 5′-phosphorylated RNA-DNA duplex inhibits Aptx activity on 5′-AMPRNA-DNA, suggesting formation of a specific Aptx/RNA-DNA/adenosine/vanadate complex in solution. i. Model phased anomalous difference fourier for the transition state mimic complex is calculated from a 2.85 Å dataset for the transition state mimic complex crystal collected on the NIEHS rotating anode home source (λ = 1.5418 Å). A 3σ peak marks the position of the vanadium. j. Unbiased electron density for the enzyme-transition state mimic covalent complex. The σ-A weighted 2Fo-Fc electron density 2.5 Å map (contoured at 1.0 σ) is calculated using a model in which the displayed atoms were not included, and prior to refinement.
Extended Data Table 2.
X-ray data collection and refinement statistics
| Data set | Aptx/DNA/AMP/Zn | Aptx/RNA–DNA/AMP/Zn | Aptx-K197Q/RNA–DNA/AMP/Zn | Aptx/RNA–DNA/adenosine/vanadate/Zn | Aptx/RNA–DNA/adenosine/vanadate/Zn Cu Kα | Aptx/DNA/AMP/Zn Molecular Replacement |
|---|---|---|---|---|---|---|
| Reaction state | Product Complex | Product Complex | Product Complex | Transition state | Transition state | Product Complex |
| Data collection | ||||||
| Space group | P212121 | P212121 | P212121 | P212121 | P212121 | P21 |
| Cell dimensions | ||||||
| a, b, c (Å) | 40.40, 117.08, 118.20 | 40.43, 116.21, 117.14 | 40.47, 116.17, 115.49 | 40.28, 114.58, 124.66 | 40.23, 114.46, 124.42 | 40.31, 119.25, 110.92 |
| α, β, γ(°) | 90, 90, 90 | 90, 90, 90 | 90, 90, 90 | 90, 90, 90 | 90, 90, 90 | 90, 91.93, 90 |
| Resolution (Å) | 50–1.85 | 50–1.95 | 50–1.90 | 50–2.55 | 50–2.85 | 50–2.50 |
| Wavelength (Å) | 1.0000 | 1.0000 | 1.0000 | 1.0000 | 1.5418 | 1.0000 |
| Rmerge | 0.063 (0.436) | 0.078 (0.588) | 0.102 (0.551) | 0.079 (0.582) | 0.074 (0.548) | 0.079 (0.338) |
| I / σI | 18.9 (2.5) | 16.8 (2.2) | 13.0 (2.4) | 15.6 (2.4) | 16.6 (2.1) | 16.1 (2.5) |
| Completeness (%) | 99.4 (98.5) | 99.9 (99.9) | 99.8 (100) | 99.3 (100) | 99.4 (99.3) | 95.7 (76.0) |
| Redundancy | 3.8 (3.3) | 4.0 (3.9) | 3.9 (3.9) | 4.0 (4.1) | 4.4 (4.0) | 3.4 (2.6) |
| Refinement | ||||||
| Resolution (Å) | 32.7–1.85 | 32.4–1.95 | 38.2–1.90 | 39.0–2.55 | ||
| No. reflections | 48674 | 41440 | 43811 | 19503 | ||
| Rwork / Rfree | 0.162/0.196 | 0.171/0.205 | 0.154/0.182 | 0.208/0.260 | ||
| No. atoms | ||||||
| Protein | 3069 | 3036 | 3051 | 2935 | ||
| Ligand/ion | 955 | 936 | 924 | 864 | ||
| Water | 516 | 569 | 719 | 25 | ||
| B-factors (Å2) | ||||||
| Protein | 27.3 | 22.9 | 19.3 | 91.4 | ||
| Ligand/ion | 32.2 | 26.4 | 22.7 | 79.7 | ||
| Water | 36.2 | 30.9 | 30.9 | 62.3 | ||
| R.m.s. deviations | ||||||
| Bond lengths (Å) | 0.005 | 0.009 | 0.013 | 0.015 | ||
| Bond angles (°) | 1.10 | 1.15 | 1.42 | 1.22 | ||
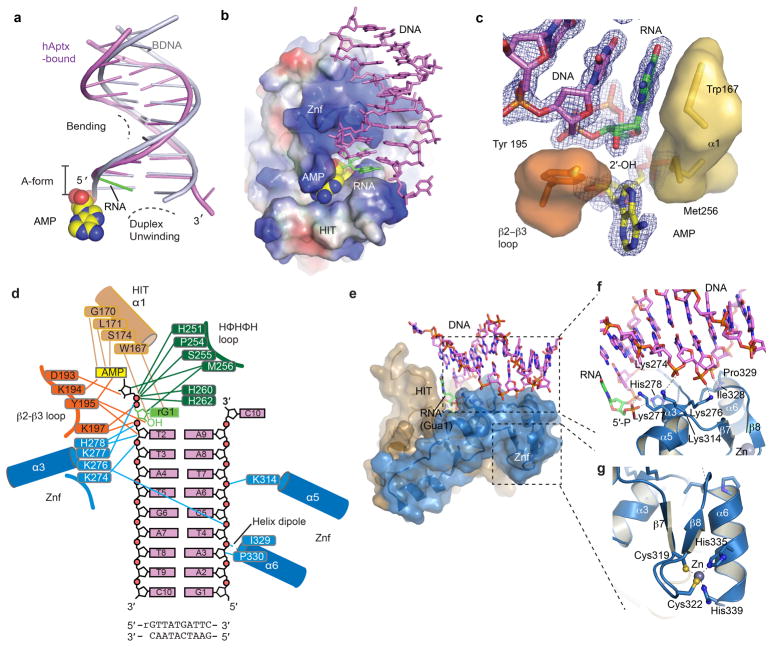
The Aptx α-β histidine triad (HIT) fold domain21 assembles with a DNA-binding Znf domain in human Aptx RNA-DNA deadenylase (Fig. 3b, Extended Data Fig. 4–5). Close interactions between the HIT and Znf subdomains mold both the active site and the extended RNA-DNA damage-binding surface (Fig. 3b, Extended Data Fig. 5). The 5′-adenylate binding pocket and 5′-ribonucleotide interaction surfaces localize to the intersection of the HIT and Znf domains (Fig. 3b–c). The Aptx-bound RNA-DNA junction is significantly distorted from B-form DNA (Extended Data Fig. 5a). A two-point nucleic acid-protein interaction induces a ~15° bend in the RNA-DNA by anchoring the exposed 5′-terminal RNA base stack and the 5′-AMP lesion on one side, while engaging the opposite undamaged strand with an array of contacts from the Znf domain (Extended Data Fig. 5d–g). Biochemical studies revealed Aptx disrupts Watson-Crick base pairing of the adenylated base pair22. In our structures, DNA distortions and capping of the RNA-DNA base-stack by the HIT domain N-terminal helix (α1) provide a possible mechanism for un-pairing of the terminal rG:C base pair to gain access to the lesion (Extended Data Fig. 5b–g). In the DNA-only bound hAptx structure, similar DNA distortions are observed revealing Aptx processes adenylated RNA-DNA and DNA with an analogous modes of substrate engagement (Extended Data Fig. 6 and Supplementary Discussion). Aptx sequesters the 5′-AMP lesion into a hydrophobic active site recess in an extra-helical conformation that is rotated ~180° relative to the RNA-DNA helical axis (Fig. 3c and Extended Data Fig. 5c).
Figure 3. Recognition of adenylated RNA-DNA junctions by hAptx.
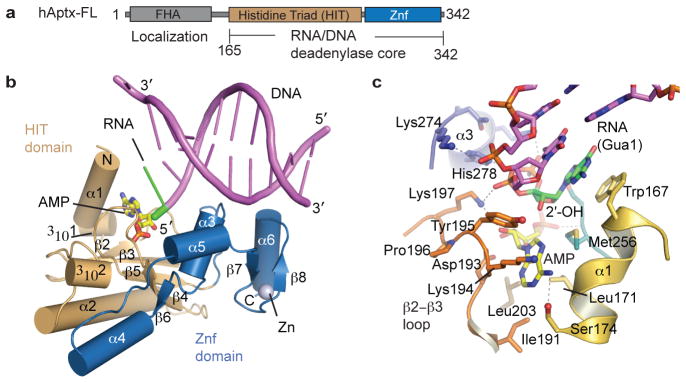
a, Domain architecture of human Aptx. The RNA deadenylase core used for structural studies maps to residues 165–342. b, X-ray structure of the hAptx/RNA-DNA/AMP/Zn reaction product complex. The Aptx HIT domain (tan) and Znf domain (blue) are displayed as cartoon helices (cylinders) and β-strands. DNA is displayed as magenta duplex, with a green 5′-ribonucleotide and yellow AMP lesions. c, Four conserved elements dictate interactions with the 5′-ribonucleotide (green) and 5′-AMP (yellow with orange/red phosphate group). The β2-β3-loop (orange), HIT-α1 (gold), Znf-α3 (blue) and HΦHΦH loop (dark green) completely envelop and orient the 5′-adenylated ribonucleotide lesion for catalytic processing.
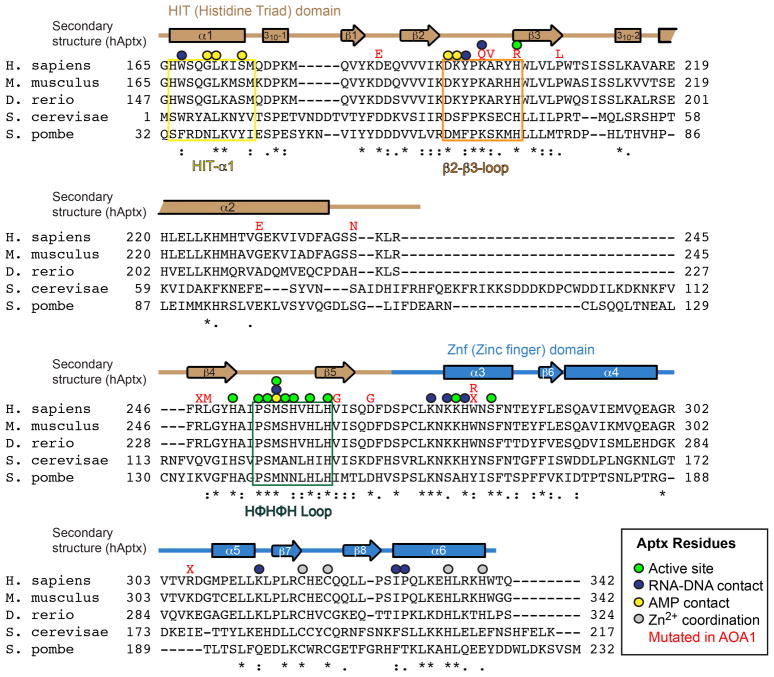
Extended Data Figure 4. Aptx Structure-based sequence alignment.
The positions of AOA1 mutations are marked by red text corresponding to the missense single amino acid substitutions or nonsense (marked by red “X”) coding truncating mutations.
Extended Data Figure 5. hAptx RNA-DNA interactions.
a, Structural distortions of the hAptx bound RNA-DNA. A cartoon representation of the duplex from the hAptx/RNA-DNA/AMP/Zn reaction product complex (magenta and green) is shown superimposed on an ideal B-form DNA duplex (gray), showing distortion of the 5′-terminal nucleotides from B-form geometry. b, Electrostatic potential representation of the hAptx HIT-Znf DNA interaction interface is displayed with electropositive (blue) electronegative (red) and hydrophobic (white) surfaces. An extended positively charged surface of the Znf mediates sequence non-specific RNA-DNA contacts. Hydrophobic base stacking stabilizes the exposed ribonucleotide base. c, Trp167 and Tyr195 anchor the terminal ribonucleotide (green), and envelop the adenylate lesion (yellow). An omit σ-A weighted 1.95 Å Fo-Fc map is displayed contoured at 3.0 σ overlaid upon the AMP and RNA-DNA duplex product complex. The RNA-DNA duplex and AMP were excluded from the model for electron density map calculation. d, hAptx protein RNA-DNA and AMP lesion binding contacts are displayed schematically. e, The HIT (tan) and Znf (blue) surfaces mold a contiguous RNA-DNA damage interacting surface. f, Molecular details of the Znf structure-specific DNA damage binding interface. DNA-protein contacts are mediated by four basic side chains (Lys 276, Lys277, His 278, Lys314) of Znf helicies α3 and α5. Additional sugar-phosphate backbone contacts from Pro 329 and Ile 328, as well as the electropositive helix-dipole of helix α6 also engage the undamaged strand. g, Zn-binding by the hAptx C2H2 zinc finger subdomain. The Zn is coordinated with tetrahedral geometry by four zinc binding residues (Cys319, Cys322, His335 and His339) and scaffolds folding of the Znf domain.
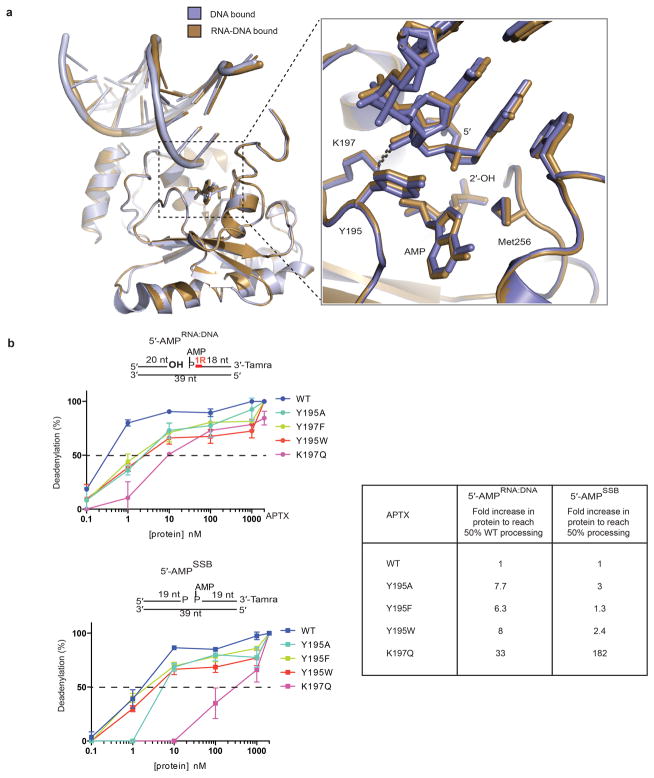
Extended Data Figure 6. Recognition of RNA-DNA and DNA by hAptx.
a, Structural overlays of DNA bound (blue-grey) and RNA-DNA bound (brown) hAptx complex structures. Inset: Interactions at the 5′ terminus reveal similar modes of engagement of RNA-DNA and DNA bound substrates. The β2-β3 loop residues Y195 and K197 orient the 5′ terminus for catalysis. b, Effects of β2-β3 loop mutants on Aptx deadenylation activity. Ten-fold dilutions of Aptx mutant proteins were tested for DNA adenylation activity on 5′-AMPRNA-DNA or 5′-AMPSSB substrates. Mean ± s.d. (n=2 technical replicates) is displayed. Fold increase to of protein to reach 50% activity is relative to the wild type hAptx for each substrate.
RNA-DNA damage detection and reaction chemistry are mediated by four stringently conserved Aptx elements that converge on the 5′-ribonucleotide and 5′AMP-lesion: HIT helix α1, the “histidine triad” HΦHΦH loop (where H=histidine, and Φ denotes a hydrophobic amino acid), the “β2-β3” loop, and Znf helix α3 (Fig. 3c, and Extended Data Fig. 4). The two 5′-terminal nucleotides of the damaged strand are bound in an A-form conformation, consistent with an RNA-DNA processing role for the Aprataxins. Multiple contacts bind a C3′-endo sugar-puckered 5′-rG, including ribose sugar-phosphate interactions from Tyr195 and Lys197 of the β2-β3-loop, and aromatic base stacking from Trp167 of HIT-α1 (Fig. 3c, and Extended Data Fig. 3f, 5c). Cradling of the 2′-hydroxyl of the ribonucleotide with van Der Waals interactions from Tyr195 (β2-β3 loop) and Met256 of the HΦHΦH-loop further anchors the 5′-rG, and aids in aligning the 5′-adenylated RNA terminus for catalysis (Fig. 3c, Extended Data Fig. 5c). Mutational studies underscore the importance of the β2-β3 loop in substrate binding and catalytic activity (Supplementary Discussion and Extended Data Fig. 6).
The first step of the Aptx reaction is proposed to generate a covalent enzyme-AMP intermediate3, 22, via an enzyme-nucleic acid transition state that poses a significant challenge to protein structural interrogation. To trap this transition state, we developed reaction conditions under which Aptx activity is inhibited when co-incubated with adenosine, orthovanadate, and a 5′-phosphorylated RNA-DNA junction duplex (Extended Data Fig. 3g–h). Reaction of hAptx with these reagents in crystallo produced a mimic of the enzyme-RNA/DNA/AMP transition state intermediate for Step 1 of a two-step deadenylation reaction (Fig. 4a, and Extended Data Fig. 3i–j).
Figure 4. RNA-DNA deadenylation reaction mechanism and Aptx inactivation in AOA1.
a, hAptx/RNA-DNA/adenosine/vanadate transition state mimic complex active site. b, Product complex (assembled active site), with 5′-ribonucleotide (green) and 5′-AMP (yellow) bound in the substrate interaction cleft. c, Product complex (disassembled active site) substrate interaction cleft. d, Proposed hAptx reaction mechanism. e, Structural overlays of hAptx states illustrate the coupled movement of the N-terminal α1 helix and the HΦHΦH active site loop. f. Structural repercussions of the AOA1 Aptx K197Q variant. A structural overlay of wild type (gray) and mutant K197Q (pink).
The HΦHΦH loop completely encircles the adenylated 5′-ribonucleotide lesion (Fig. 4), with His260 covalently bonded to a pentavalent coordinate vanadium atom in the transition state mimic complex (Fig. 4a and 4d, Extended Data Fig. 3i). The transition state and product bound structures support a two-step deadenylation reaction initiated by nucleophilic attack of the scissile pyrophosphate by His260 (Fig. 4d). Protein main-chain amides of Ser255-Met256, and salt bridging from a His201-His262 stabilize this transition state (Fig. 4a). His251 is ideally positioned to protonate a 5′-P leaving group, and binds 5′-P together with Ser255 and Lys277. In the proposed reaction scheme (Fig. 4d), Step 1 generates an enzyme-AMP intermediate, which is then resolved via hydrolysis in Step 2. Interestingly, in the product complex, a Na+ ion (assigned by oxygen-ion bond lengths) with octahedral coordination binds between Ser255 and 5′-P (Fig. 4b), suggesting that while Aptx activity is metal-independent, transient solvent cation binding stabilizes the product state, in a matter analogous to third metal binding in DNA polymerase η23.
Human Aptx is found in two dramatically different conformations in the product-bound structure. The first conformation (the “assembled active site” Fig. 4b and Extended Data Fig. 7 a–b) has an intact active site characterized by close interactions between HIT-α1 (Leu171 and Trp167) with the HΦHΦH loop, and correct positioning of His260 for catalysis. This state has the His260 imidazole ring hydrogen bonded to the His268 main chain carbonyl oxygen. In the second state (the “disassembled active site”), α1 is displaced by ~4 Å relative to a rearranged HΦHΦH loop, and His260 is flipped out of alignment for nucleophilic attack (compare Fig. 4b and 4c). Structural overlays (Fig. 4e) and interpolations between these two states (Supplementary Videos S1 and S2) indicate that concerted conformational rearrangements sculpt the HΦHΦH loop, and may be linked to RNA-DNA substrate binding by α1 and HΦHΦH (Extended data Fig. 7b–e). We hypothesize that RNA-DNA:protein interactions proximal to the active site regulate active site conformations involving HIT-α1. RNA/DNA-regulated assembly of the Aptx active site may “license” catalytic activity and also prevent inappropriate, non-specific hydrolysis of nucleotides (eg. ATP or ADP hydrolysis). Discrimination against ATP cleavage may be critical for mitochondrial Aptx isoforms that have previously been implicated in DNA damage repair in mitochondria24, because off-target catalysis could imbalance nucleotide pool levels.
Extended Data Figure 7. DNA end binding by α1 bridges active site conformations to DNA end sensing status.
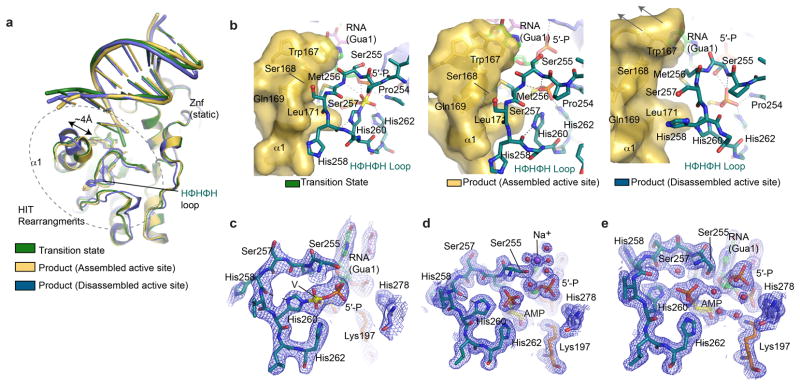
a, Structural overlays of three states reported in this study. b. Conformational rearrangements localize to the HIT N-terminal helix and the HIT HΦHΦH loop. HIT-α1 is found in variable conformations, and movement of α1 is linked to rearrangement of the active site HΦHΦH loop. The conformation of Met 256, His260 and His258 is modulated by van der Waals interactions with Leu171 and Trp167 from α1 that together flank the HΦHΦH loop. In the disassembled active site conformer of the product complex, α1 migrates ~4 Å away from HΦHΦH, with concomitant morphing of His260 conformation into an inactive state. c, Transition state complex σ-A weighted 2.55 Å 2Fo-Fc electron density map is displayed contoured at 1.0 σ for the active site. A yellow sphere, “V”, marks the position of the vanadium covalently bonded to His260, the 5′-phosphate of 5′-rG and adenosine. d, Product complex (assembled active site) σ-A weighted 1.95 Å 2Fo-Fc electron density map is displayed contoured at 1.5 σ for the active site. e, Product complex (disassembled active site) σ-A weighted 1.95 Å 2Fo-Fc electron density map is displayed contoured at 1.5 σ.
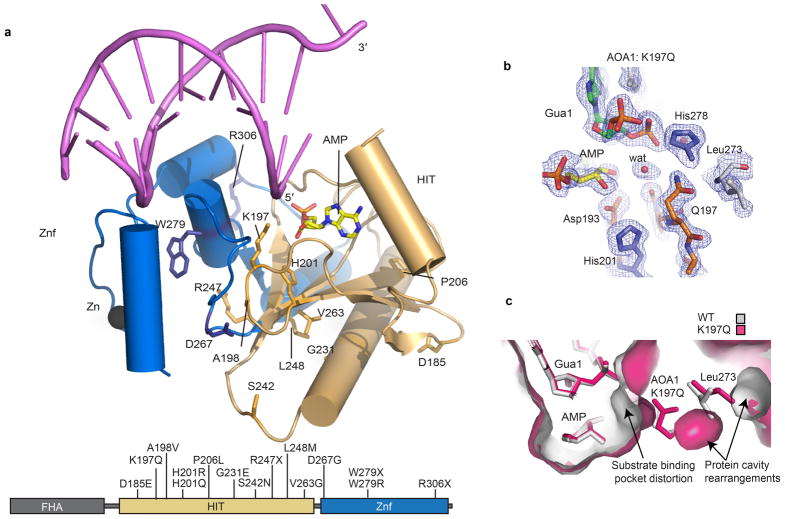
Both missense and truncating Aptx substitutions are linked to neurodegenerative disease15–17. Based on the human Aptx structures determined here, we predict that the majority of AOA1 mutations (D185E, A198V, P206L, G231E, R247X, V263G, D267G, W279X, W279R and R306X) will decrease protein stability by truncating the polypeptide or by altering the protein-folding core (Extended Data Fig. 8a). Conformational differences between our RNA-DNA bound structures extend into the protein core (Extended Data Fig. 7a). Aptx conformational changes may thus be subject to mutagenic modulation in disease. We posit differential impacts on protein folding, active site chemistry and substrate induced-fit active site assembly may all contribute to the variable clinical outcomes observed in patients harboring Aptx defects17.
Extended Data Figure 8. Ataxia Oculomotor Apraxia (AOA1) mutations.
a, The positions of Aptx mutations found in AOA1 are mapped onto the structure of human Aptx. b. Omit 2Fo-Fc electron density for the K197Q variant. A solvent molecule occupies the position of the Lys 97 epsilon amino group of the wild type protein, and Gln197 rotates away from the active site pocket, into the protein core. c, Surface representation of the K197Q mutant (pink) overlaid upon Wt-Aptx (gray). In K197Q, the active site pocket is distorted, and rearrangements in the protein core proximal to Gln197 are also observed, and involve Leu273.
One AOA1 mutation is found in the RNA-DNA substrate interaction cleft (K197Q) and two participate directly in active site chemistry (H201R and H201Q) (Fig. 4a–c, Extended Data Fig. 8a). The late onset AOA1 variant Aptx-K197Q17, displays significantly impaired deadenylation activity on both the 5′-AMPSSB and 5′-AMPRNA:DNA substrates (Extended Data Fig. 6b). To understand the molecular basis for the K197Q defect, we determined a 1.90 Å X-ray structure of Aptx-K197Q bound to RNA-DNA and AMP that reveals the mutant protein harbors a distorted active site pocket (Fig. 4f and Extended Data Fig. 8b–c). In the wild type protein, Lys197 participates in salt bridging interactions with the 5′-terminal sugar-phosphate backbone and the AMP lesion 2′-hydroxyl. In the mutant, Gln197 is rotated away from the substrate binding pocket, and substitutes direct protein-substrate interactions with through-water nucleic acid binding contacts, thus revealing that distortions in the Aptx-K197Q substrate-binding pocket underlie AOA1.
Our data indicate that during repair of non-canonical ribonucleotides introduced into DNA during replication of the nuclear genome, DNA ligases generate 5′-adenylated RNA-DNA junctions that can elicit a DNA damage checkpoint response unless this is prevented by Aptx deadenylase. In addition to frequent ribonucleotide incorporation by DNA replicases, rNTPs are used by RNA primase to initially synthesize ~ 5% of the nascent lagging strand, and rNTPs are also incorporated during mitochondrial DNA replication25,26, during translesion synthesis27, and during DNA repair28. Ribonucleotide incorporation during DNA repair may be more prevalent in non-proliferating cells because dNTP concentrations are lower29, 30, thereby increasing rNTP:dNTP ratios30. Thus, the late onset of AOA1 might partly reflect failure to deadenylate RNA-DNA junctions resulting from ribonucleotides incorporated in DNA transactions occurring over many years in quiescent neurons. It will be important in future work to establish quantitative measures of RNA-DNA adenylation to explore this hypothesis.
In this context, Aptx acts in a nucleic acid transaction that is not exclusively DNA or RNA. Instead, using a reaction mechanism that is finely tuned to operate on RNA-DNA junctions, Aptx acts in an RNA-DNA damage response (RDDR) to protect the genome from a compound insult, a ribosylated, adenylated 5′-terminus. In a broader sense, it seems probable that other enzymes may also modulate the RDDR via the detection, processing and signaling of RNA-DNA-derived structures posing threats to genomic integrity.
METHODS
Aptx Protein Expression and Purification
An E. coli codon-optimized coding sequence (GenScript) facilitated robust recombinant overexpression of hAptx. hAptx full-length protein and truncated variants were expressed from pET15b as N-terminal 6xHis-tagged proteins in E. coli BL21(DE3) codon-plus cells (Novagen). Aptx mutations were introduced using the Quickchange system (Stratagene). Cell cultures were grown at 37 °C in LB medium containing ampicillin (100 μg mL−1) and chloramphenicol (34 μg mL−1) until A600 reached 0.8 to 1, at which time cells were cooled to 16 °C, and grown for an additional 8–12 hours, without IPTG induction. Cells were lysed by sonication in lysis buffer (50 mM Tris, pH 8.5, 500 mM NaCl, 10 mM imidazole, 0.01 g/L lysozyme, with Roche mini EDTA-free protease inhibitor). The soluble lysate was applied to Ni-NTA column (5 mL, Qiagen) and 6x His-tagged hAptx proteins were eluted in lysis buffer with 300 mM imidazole. The 6xHis-tag was removed with overnight thrombin digestion (50U) (Sigma) at 4°C. Subsequent purification was achieved by size exclusion chromatography (Superdex 75, GE healthcare in 50 mM Tris, pH 7.5, 500 mM NaCl, 5% glycerol, 0.1% β-mercaptoethanol) and cation exchange chromatography on a 5 mL Hi-Trap SP HP (GE Healthcare). S. pombe Aptx was expressed and purified as previously described3.
DNA ligation reactions
For DNA ligation experiments, human DNA ligase I (residues 232–919), and DNA ligase III β (residues 170–862) catalytic domains were expressed and purified as described previously1,31. Recombinant T4 DNA ligase and E. coli LigA were obtained from New England Biolabs. Ligation reactions (35 μL) contained DNA ligases (1 μM), 5′-DNA substrate (50 nM, oligonucleotides 1, 2, and 4, Extended Data Fig. 3d) or 5′-RNA (50 nM, oligonucleotides 1, 2, and 5, Extended Data Fig. 3d) in 10 mM Tris, pH 7.5, 2 mM MgCl2, 1 mM DTT, 1 mM ATP, and 350 ng BSA. 5 μL aliquots of the reaction mixture were taken at 0, 10, 30, 60, 120, 240 min and immediately heat inactivated in 8 M urea and 5% glycerol (5 μL) for 10 min. Ligation reaction products were analyzed on 15% TBE-Urea gels (Invitrogen). Reaction products were analyzed on 15% TBE-Urea gel (Invitrogen). Carboxytetramethylrhodamine (Tamra) labeled reaction products were quantitated on a Typhoon scanner (GE Healthcare).
Limited Proteolysis
Proteolysis reaction mixtures (60 μL) contained hAptx (22 μM), and protease (0.01 mg/mL chymotrypsin or 0.1 mg/mL trypsin) in protease reaction buffer (20 mM Tris, pH 7.5, 450 mM NaCl, 0.1% β-mercaptoethanol). A 10 μl aliquot of the reaction mixture was taken at 0, 5, 15, 30, and 60 min and immediately mixed with 1 mg/mL PMSF (1 μL), and heated in Novex SDS sample buffer (Invitrogen) at 95°C for 10 min. Protease digestion reaction products were analyzed by SDS-PAGE.
Preparation of Adenylated DNA substrates
The adenylated 5′-AMPRNA-DNA substrate was generated by abortive ligation (AL) of human DNA ligase I on the 5′-RNA duplex (oligonucleotides 1, 2, and 5, Extended Data Fig. 3d). The 5′-AMPSSB adenylated strand was generated in AL reactions (50 μL) with T4 DNA ligase (2400U) (NEB) on a 5′-SSB duplex (oligonucleotides 1, 3, and 4, Extended Data Fig. 3d). AL reactions were heat inactivated in 8 M urea at 95 °C for 10 min, and reaction products were fractionated in 20 % TBE-urea gels for purification. The adenylated products were excised from the gel and extracted in 0.3 M sodium acetate pH 5.2 at 37° overnight, followed by desalting on Sep-Pak C18 cartridges (Waters). For Aptx deadenylation analysis, the purified adenylated strands were then re-annealed with the appropriate complementary oligonucleotides (oligonucleotides 1 and 2 to form 5′-AMPRNA-DNA, or oligonucleotides 1 and 3 to form 5′-AMPSSB).
Aptx Deadenylation Reactions
Deadenylation reactions for Aptx protein-truncation mapping experiments (10 μL) contained 5′-adenylated duplex 5′-AMPSSB(30 nM) and hAptx (0.1 nM to 1 μM) in deadenylation reaction buffer (50 mM Tris, pH 8.0, 40 mM NaCl, 5 mM EDTA, 1 mM DTT, and 5% glycerol). Reactions were incubated at 20 °C for 10 min, and inactivated by heating for 10 min at 100 °C following addition of 10 μL gel loading buffer (8 M urea, 50 mM Tris, pH 7.5, 25 mM EDTA, and 5% glycerol). For time course experiments, deadenylation reactions (40 μl) contained hAptx (2 nM), 5′-adenylated duplex 5′-AMPRNA-DNA (10 nM) or 5′-AMPSSB (10 nM) in deadenylation reaction buffer. 5 μl aliquots of the reaction mixtures were taken at 0, 0.5, 1, 2, 5, 10, 30 min, and immediately heat inactivated in 8 M urea and 5% glycerol (5 μl). Reaction products were analyzed on 15% TBE-Urea gel (Invitrogen). Carboxytetramethylrhodamine (Tamra) labeled reaction products were quantitated on a Typhoon scanner (GE Healthcare). For enzyme kinetic analyses (5 μL reactions) contained hAptx (165–342) (2 nM), 5′-AMPRNA-DNA (7.5 – 240 nM) or 5′-AMPSSB (7.5 – 480 nM), in deadenylation reaction buffer and were incubated at 20 °C for 5 min. For S. cerevisiae AptxHnt3, 5 μl enzyme kinetics reactions contained AptxHnt3 (8 nM, purchased from New England Biolabs), 5′-AMPRNA-DNA (25 – 32000 nM) or 5′-AMPSSB (25 – 32000 nM), in deadenylation reaction buffer, and were incubated at 20 °C for 5 min. Kinetic parameters were obtained from non-linear regression fitting to a Michaelis-Menten model in Graphpad Prism.
hAptx Crystallization
Initial crystals of a hAptx/DNA/AMP/Zn complex (oligonucleotide 8, Extended Data Fig. 3d) were grown by mixing complex solution 1 (10 mg ml−1 hAptx–165–342, 1 mM AMP, 1.5:1 DNA–protein ratio, in 150 mM NaCl, 20 mM Tris-HCl, pH 7.5, and 0.1 % β-mercaptoethanol) with an equal volume (300 nL) of the precipitant solution 1 (100 mM Tris, pH 8.5, 20 % w/v polyethylene glycol 10000). Single crystals appeared after two weeks of incubation at 4 °C. Crystals of the hAptx/DNA/AMP product complex (Oligo 9, Extended Data Fig. 3d) were grown by mixing complex solution 2 (10 mg ml−1 hAptx–165–342, 1 mM AMP, 1:1 DNA–protein ratio, in 150 mM NaCl, 20 mM Tris-HCl, pH 7.5, and 0.1% β-mercaptoethanol) with an equal volume (300 nL) of precipitant solution 2 (150 mM magnesium acetate, 8 % w/v polyethylene glycol 3350). Single crystals appeared overnight after incubation at 4 °C. Crystals of the hAptx/RNA-DNA/AMP product complex (Oligos 6 and 7, Extended Data Fig. 3d) were grown by mixing complex solution 3 (10 mg ml−1 hAptx–165–342, 1 mM AMP, 1:1 RNA/DNA–protein ratio, in 150 mM NaCl, 20 mM Tris-HCl, pH 7.5, and 0.1 % β-mercaptoethanol) with an equal volume (300 nL) of precipitant solution 3 (200 mM potassium sodium tartrate, 20% w/v polyethylene glycol 3350). Single crystals appeared overnight after incubation at 4 °C. Crystals of the hAptx/RNA-DNA/vanadate/adenosine/Zn transition state complex (Oligos 6 and 7, Extended Data Fig. 3d) were grown by mixing complex solution 4 (10 mg ml−1 hAptx–165–342, 1 mM adenosine, 1:1 RNA/DNA–protein ratio, in 150 mM NaCl, 20 mM Tris-HCl, pH 7.5, and 0.1 % β-mercaptoethanol) with an equal volume (300 nL) of precipitant solution 4 (100 mM sodium formate, 20% w/v polyethylene glycol 3350). The adenosine/RNA-DNA bound crystals were then soaked and reacted for 1 hour at 4 °C in cryoprotectant solution supplemented with 0.5 mM orthovanadate. Crystals of the hAptx-K197Q/RNA-DNA/AMP product complex (Oligos 6 and 7, Extended Data Fig. 3d) were grown by mixing complex solution 5 (10 mg ml−1 hAptx (165–342)–K197Q, 1 mM AMP, 1:1 RNA/DNA–protein ratio, in 150 mM NaCl, 20 mM Tris-HCl, pH 7.5, and 0.1% β-mercaptoethanol) with an equal volume (300 nL) of precipitant solution 5 (200 mM potassium acetate, 20% w/v polyethylene glycol 3350). All crystals were washed in cryo-protectant (precipitant solutions supplemented with 12% glycerol) and flash frozen in liquid nitrogen for data collection. Diffraction data were processed with HKL200032.
Yeast Strains
Saccharomyces cerevisiae strains used are isogenic derivatives of strain Δ|(-2)|-7B-YUNI300 (MATa CAN1 his7-2 leu2-Δ::kanMX ura3-Δ trp1-289 ade2-1 lys2-DGG2899-2900 agp1::URA3-OR1 or OR2)38. Relevant strain genotypes are listed in Extended Data Table 1. HNT3 deletion strains were generated by two experimental strategies. For the POL2 (Pol ε-wild type) and pol2-M644G strains, diploids homozygous for the polymerase mutation (and rnh201Δ, where applicable) were made heterozygous for HNT3 (HNT3/hnt3Δ) by PCR-based targeted gene disruption. Deletion of one copy of the HNT3 gene was verified by PCR, haploids were obtained from tetrad dissections and were verified by PCR, appropriate drug-resistance and sequencing of the POL2 locus. Dissection plates were photographed after 3 d growth on rich medium (YPDA: 1 % yeast extract, 2 % bacto-peptone, 250 mg/L adenine, 2 % dextrose, 2 % agar for plates). For the pol2-M644L strains (± RNH201), deletion-replacement of HNT3 was performed via transformation with a PCR product containing the nourseothricin-resistance cassette (natMX4) amplified from pAG25 and flanked by 60 nucleotides of sequence homologous to the intergenic regions upstream and downstream of the HNT3 open reading frame. Transformants that arose from homologous recombination were verified by proper drug-resistance and PCR analysis.
hAptx structure solution and refinement
Molecular replacement phases for the hAptx/DNA/AMP/Zn complex (complex 1) to 3.0 Å were obtained by employing a systematic molecular replacement search varying ~190 model and data parameters in PHASER33., and testing multiple molecular constructs based on an S. pombe Aptx–DNA complex (3SZQ) (~ 29 % identity with hAptx)3. The successful solution (PHASER TFZ=9.6, LLG=159, Refmac Rfree = 48.9) contained 4 copies of hAptx in a P21 asymmetric unit (ASU). Map quality and molecular replacement phases were improved and extended to 2.5 Å using prime-and-switch density modification with NCS averaging in RESOLVE34,35. The initial model was fit manually in O (v10.0) and partially refined in Refmac36. This model was then used for molecular replacement searches to phase the hAptx/RNA-DNA/AMP/Zn (at 1.95 Å, 2 molecules/ASU), hAptx/DNA/AMP/Zn (at 1.85 Å, 2 molecules/ASU), and hAptx-K197Q/RNA-DNA/AMP/Zn product complexes (at 1.90 Å, 2 molecules/ASU). Following autobuilding using PHENIX Autobuild35, models were fit manually in Coot37 and refined in PHENIX35. The refined product RNA-DNA complex structure was used to phase the hAptx/RNA-DNA/Adenosine/vanadate/Zn transition state complex (at 2.5 Å). Final structures display excellent geometry (Extended Data Table 2) and refinement statistics.
Yeast Strain Growth and HU-sensitivity Analyses
Yeast strains were grown in YPDA at 30 °C. Growth curves were determined in duplicate; a representative plot is displayed. Strain doubling times (Dt) were calculated from measurements of the OD600nm of cultures in the logarithmic phase of growth in rich medium at 30 °C over a 17 h time-course. Dt measurements were made using data from 4 independent biological replicates (8 for the pol2-M644G hnt3δ genotype) and the average Dt ± standard deviation is displayed. Statistical analysis (Fig. 2d) was performed in GraphPad Prism. D’Agostino & Pearson omnibus normality test (alpha = 0.05) is passed using doubling time determinations for the pol2-M644G hnt33 strain (n=8). The sample size is too small to run a normality test on the doubling time measurements for the hnt3Δ or pol2-M644G hnt3Δ rnh201Δ strains (n=4 for each). The coefficients of variations in the data are as follows: 11.4 % for the hnt3Δ strain, 19.1 % for the pol2-M644G hnt3Δ strain and 15.2 % for the pol2-M644G hnt3Δ rnh201Δ strain. A spot dilution assay was performed by spotting 10-fold serial dilutions of mid-log phase cultures onto YPDA agar ± 100 mM HU. Plates were incubated at 30 °C and photographed after 3 days of growth. A quantitative HU-survival assay was performed as described previously12. Exponentially-growing cells were arrested in G1 for 3 h with α-factor (5 μg/ml). Approximately 500 cells from each strain were plated onto YPDA agar (untreated) or YPDA agar containing 100 mM HU, incubated for 3–6 days at 30 °C and counted. Percentage survival was calculated as the % of surviving cells compared to the untreated control. The experiment was performed in triplicate, data are displayed as the average ± standard deviation.
Immunoblotting
Whole-cell extracts were prepared from exponentially growing cells as described 12. The positive control is an extract prepared from wild-type cells treated with 200 mM HU for 3 h. Actin was probed as a loading control. Proteins were resolved on a 10 % Bis-Tris gel (Life Technologies) and western blotting was performed using a 1:1000 dilution of an affinity-purified rabbit polyclonal antibody against Rnr3 (Agrisera; AS09574). The α-actin antibody (Millipore, #MAB1501) was used at 1:1000.
Supplementary Material
Acknowledgments
This work was supported by the intramural research program of the US National Institutes of Health (NIH), National Institute of Environmental Health Sciences (NIEHS) projects 1Z01ES102765 to R.S.W. and Z01ES065070 to T.A.K. X-ray diffraction data were collected at Southeast Regional Collaborative Access Team (SER-CAT) 22-ID (or 22-BM) beamline at the Advanced Photon Source, Argonne National Laboratory. Use of the Advanced Photon Source was supported by the U. S. Department of Energy, Office of Science, Office of Basic Energy Sciences, under Contract No. W-31-109-Eng-38. We thank L. Pedersen of the NIEHS collaborative crystallography group, and the Advanced Photon Source (APS) Southeast Regional Collaborative Access Team (SER-CAT) staff for assistance with crystallographic data collection. We thank L. Pedersen and B. Wallace for critical reading of the manuscript, Juno Krahn for assistance with movies, and T. Ellenberger and P. O’brien for DNA ligase expression vectors.
Footnotes
Each dataset was collected from a single crystal. Values in parentheses are for highest-resolution shell (1.95 to 1.85 Å for the Aptx/DNA/AMP product dataset, 1.97 to 1.90 Å for the K197Q–Aptx/DNA/AMP product dataset, 2.02 to 1.95 Å for the Aptx/RNA–DNA/AMP product dataset, 2.64 to 2.55 Å for the Aptx/RNA–DNA/adenosine/ vanadate transition state dataset, 2.95 to 2.85 Å for the Aptx/RNA–DNA/adenosine/vanadium–Cu Kα dataset, and 2.59 to 2.50 Å for the Aptx/DNA/AMP product molecular replacement dataset). Rfree calculated from 5% subset of randomly selected reflections.
Author contributions
P.T. performed biochemical studies and crystallization. M.J.S and R.S.W. solved and refined X-ray structures. J.S.W performed S. cerevisiae experiments. All authors contributed to experimental design, data analysis, and preparation of the manuscript.
Author information
Molecular coordinates and structure factors for X-ray structures reported here have been deposited in the RCSB protein data bank, PDB ID codes: 4NDF (hAptx/RNA–DNA/AMP/Zn complex), 4NDG (hAptx RNA–DNA/adenosine/vanadate/Zn complex), 4NDH (hAptx/DNA/AMP/Zn complex), and 4NDI hAptx–K197Q/RNA–DNA/AMP/Zn complex. The authors declare no competing financial interests.
Supplementary Information is linked to the online version of the paper at www.nature.com/nature.
References
- 1.Pascal JM, O’Brien PJ, Tomkinson AE, Ellenberger T. Human DNA ligase I completely encircles and partially unwinds nicked DNA. Nature. 2004;432:473–478. doi: 10.1038/nature03082. [DOI] [PubMed] [Google Scholar]
- 2.Ellenberger T, Tomkinson AE. Eukaryotic DNA ligases: structural and functional insights. Annu Rev Biochem. 2008;77:313–338. doi: 10.1146/annurev.biochem.77.061306.123941. [DOI] [PMC free article] [PubMed] [Google Scholar]
- 3.Tumbale P, et al. Structure of an aprataxin-DNA complex with insights into AOA1 neurodegenerative disease. Nat Struct Mol Biol. 2011;18:1189–1195. doi: 10.1038/nsmb.2146. [DOI] [PMC free article] [PubMed] [Google Scholar]
- 4.Ahel I, et al. The neurodegenerative disease protein aprataxin resolves abortive DNA ligation intermediates. Nature. 2006;443:713–716. doi: 10.1038/nature05164. [DOI] [PubMed] [Google Scholar]
- 5.Rass U, Ahel I, West SC. Actions of aprataxin in multiple DNA repair pathways. J Biol Chem. 2007;282:9469–9474. doi: 10.1074/jbc.M611489200. [DOI] [PubMed] [Google Scholar]
- 6.Harris JL, et al. Aprataxin, poly-ADP ribose polymerase 1 (PARP-1) and apurinic endonuclease 1 (APE1) function together to protect the genome against oxidative damage. Hum Mol Genet. 2009;18:4102–4117. doi: 10.1093/hmg/ddp359. [DOI] [PubMed] [Google Scholar]
- 7.El-Khamisy SF, et al. Synergistic decrease of DNA single-strand break repair rates in mouse neural cells lacking both Tdp1 and aprataxin. DNA Repair (Amst) 2009;8:760–766. doi: 10.1016/j.dnarep.2009.02.002. [DOI] [PMC free article] [PubMed] [Google Scholar]
- 8.Daley JM, Wilson TE, Ramotar D. Genetic interactions between HNT3/Aprataxin and RAD27/FEN1 suggest parallel pathways for 5′ end processing during base excision repair. DNA Repair (Amst) 2010;9:690–699. doi: 10.1016/j.dnarep.2010.03.006. [DOI] [PMC free article] [PubMed] [Google Scholar]
- 9.Sparks JL, et al. RNase H2-initiated ribonucleotide excision repair. Molecular cell. 2012;47:980–986. doi: 10.1016/j.molcel.2012.06.035. [DOI] [PMC free article] [PubMed] [Google Scholar]
- 10.Reijns MA, et al. Enzymatic removal of ribonucleotides from DNA is essential for mammalian genome integrity and development. Cell. 2012;149:1008–1022. doi: 10.1016/j.cell.2012.04.011. [DOI] [PMC free article] [PubMed] [Google Scholar]
- 11.Nick McElhinny SA, et al. Abundant ribonucleotide incorporation into DNA by yeast replicative polymerases. Proceedings of the National Academy of Sciences of the United States of America. 2010;107:4949–4954. doi: 10.1073/pnas.0914857107. [DOI] [PMC free article] [PubMed] [Google Scholar]
- 12.Williams JS, et al. Topoisomerase 1-mediated removal of ribonucleotides from nascent leading-strand DNA. Molecular cell. 2013;49 doi: 10.1016/j.molcel.2012.12.021. [DOI] [PMC free article] [PubMed] [Google Scholar]
- 13.Nick McElhinny SA, et al. Genome instability due to ribonucleotide incorporation into DNA. Nature chemical biology. 2010;6:774–781. doi: 10.1038/nchembio.424. [DOI] [PMC free article] [PubMed] [Google Scholar]
- 14.Rumbaugh JA, Murante RS, Shi S, Bambara RA. Creation and removal of embedded ribonucleotides in chromosomal DNA during mammalian Okazaki fragment processing. The Journal of biological chemistry. 1997;272:22591–22599. doi: 10.1074/jbc.272.36.22591. [DOI] [PubMed] [Google Scholar]
- 15.Date H, et al. Early-onset ataxia with ocular motor apraxia and hypoalbuminemia is caused by mutations in a new HIT superfamily gene. Nat Genet. 2001;29:184–188. doi: 10.1038/ng1001-184. [DOI] [PubMed] [Google Scholar]
- 16.Moreira MC, et al. The gene mutated in ataxia-ocular apraxia 1 encodes the new HIT/Zn-finger protein aprataxin. Nat Genet. 2001;29:189–193. doi: 10.1038/ng1001-189. [DOI] [PubMed] [Google Scholar]
- 17.Tranchant C, Fleury M, Moreira MC, Koenig M, Warter JM. Phenotypic variability of aprataxin gene mutations. Neurology. 2003;60:868–870. doi: 10.1212/01.wnl.0000048562.88536.a4. [DOI] [PubMed] [Google Scholar]
- 18.Kijas AW, Harris JL, Harris JM, Lavin MF. Aprataxin forms a discrete branch in the HIT (histidine triad) superfamily of proteins with both DNA/RNA binding and nucleotide hydrolase activities. J Biol Chem. 2006;281:13939–13948. doi: 10.1074/jbc.M507946200. [DOI] [PubMed] [Google Scholar]
- 19.Lujan SA, et al. Mismatch repair balances leading and lagging strand DNA replication fidelity. PLoS genetics. 2012;8 doi: 10.1371/journal.pgen.1003016. [DOI] [PMC free article] [PubMed] [Google Scholar]
- 20.Davidson MB, et al. Endogenous DNA replication stress results in expansion of dNTP pools and a mutator phenotype. The EMBO journal. 2012;31:895–907. doi: 10.1038/emboj.2011.485. [DOI] [PMC free article] [PubMed] [Google Scholar]
- 21.Lima CD, Klein MG, Hendrickson WA. Structure-based analysis of catalysis and substrate definition in the HIT protein family. Science. 1997;278:286–290. doi: 10.1126/science.278.5336.286. [DOI] [PubMed] [Google Scholar]
- 22.Rass U, Ahel I, West SC. Molecular mechanism of DNA deadenylation by the neurological disease protein aprataxin. J Biol Chem. 2008;283:33994–34001. doi: 10.1074/jbc.M807124200. [DOI] [PMC free article] [PubMed] [Google Scholar]
- 23.Nakamura T, Zhao Y, Yamagata Y, Hua YJ, Yang W. Watching DNA polymerase eta make a phosphodiester bond. Nature. 2012;487:196–201. doi: 10.1038/nature11181. [DOI] [PMC free article] [PubMed] [Google Scholar]
- 24.Sykora P, Croteau DL, Bohr VA, Wilson DM., 3rd Aprataxin localizes to mitochondria and preserves mitochondrial function. Proc Natl Acad Sci U S A. 2011;108:7437–7442. doi: 10.1073/pnas.1100084108. [DOI] [PMC free article] [PubMed] [Google Scholar]
- 25.Kasiviswanathan R, Copeland WC. Ribonucleotide discrimination and reverse transcription by the human mitochondrial DNA polymerase. The Journal of biological chemistry. 2011;286:31490–31500. doi: 10.1074/jbc.M111.252460. [DOI] [PMC free article] [PubMed] [Google Scholar]
- 26.Yang MY, et al. Biased incorporation of ribonucleotides on the mitochondrial L-strand accounts for apparent strand-asymmetric DNA replication. Cell. 2002;111:495–505. doi: 10.1016/s0092-8674(02)01075-9. [DOI] [PubMed] [Google Scholar]
- 27.McDonald JP, Vaisman A, Kuban W, Goodman MF, Woodgate R. Mechanisms employed by Escherichia coli to prevent ribonucleotide incorporation into genomic DNA by Pol V. PLoS genetics. 2012;8:e1003030. doi: 10.1371/journal.pgen.1003030. [DOI] [PMC free article] [PubMed] [Google Scholar]
- 28.Nick McElhinny SA, Ramsden DA. Polymerase mu is a DNA-directed DNA/RNA polymerase. Molecular and cellular biology. 2003;23:2309–2315. doi: 10.1128/MCB.23.7.2309-2315.2003. [DOI] [PMC free article] [PubMed] [Google Scholar]
- 29.Chabes A, et al. Survival of DNA damage in yeast directly depends on increased dNTP levels allowed by relaxed feedback inhibition of ribonucleotide reductase. Cell. 2003;112:391–401. doi: 10.1016/s0092-8674(03)00075-8. [DOI] [PubMed] [Google Scholar]
- 30.Ferraro P, Franzolin E, Pontarin G, Reichard P, Bianchi V. Quantitation of cellular deoxynucleoside triphosphates. Nucleic acids research. 2010;38:e85. doi: 10.1093/nar/gkp1141. [DOI] [PMC free article] [PubMed] [Google Scholar]
- 31.Cotner-Gohara E, et al. Human DNA ligase III recognizes DNA ends by dynamic switching between two DNA-bound states. Biochemistry. 2010;49:6165–6176. doi: 10.1021/bi100503w. [DOI] [PMC free article] [PubMed] [Google Scholar]
- 32.Otwinowski Z, Minor W. Methods in Enzymology. In: Carter CW Jr, Sweets RM, editors. Macromolecular Crystallography, part A. Vol. 276. Academic Press; 1997. pp. 307–326. [Google Scholar]
- 33.McCoy AJ, RWGK, Adams PD, Winn MD, Storoni LC, Read RJ. Phaser crystallographic software. J Appl Cryst. 2007;40:658–674. doi: 10.1107/S0021889807021206. [DOI] [PMC free article] [PubMed] [Google Scholar]
- 34.Terwilliger TC. Maximum-likelihood density modification. Acta Crystallogr D Biol Crystallogr. 2000;56 ( Pt 8):965–972. doi: 10.1107/S0907444900005072. [DOI] [PMC free article] [PubMed] [Google Scholar]
- 35.Adams PD, et al. PHENIX: a comprehensive Python-based system for macromolecular structure solution. Acta Crystallogr D Biol Crystallogr. 2010;66:213–221. doi: 10.1107/S0907444909052925. [DOI] [PMC free article] [PubMed] [Google Scholar]
- 36.Murshudov GN, Vagin AA, Dodson EJ. Refinement of macromolecular structures by the maximum-likelihood method. Acta Crystallogr D Biol Crystallogr. 1997;53:240–255. doi: 10.1107/S0907444996012255. [DOI] [PubMed] [Google Scholar]
- 37.Emsley P, Lohkamp B, Scott WG, Cowtan K. Features and development of Coot. Acta crystallographica Section D, Biological crystallography. 2010;66:486–501. doi: 10.1107/S0907444910007493. [DOI] [PMC free article] [PubMed] [Google Scholar]
- 38.Pavlov YI, Shcherbakova PV, Kunkel TA. In vivo consequences of putative active site mutations in yeast DNA polymerases alpha, epsilon, delta, and zeta. Genetics. 2001;159:47–64. doi: 10.1093/genetics/159.1.47. [DOI] [PMC free article] [PubMed] [Google Scholar]
Associated Data
This section collects any data citations, data availability statements, or supplementary materials included in this article.


