Abstract
Obesity is a risk factor for many human diseases. However, the underlying molecular causes of obesity are not well understood. Here, we report that protein tyrosine phosphatase receptor T (PTPRT) knockout mice are resistant to high-fat diet-induced obesity. Those mice avoid many deleterious side effects of high-fat diet-induced obesity, displaying improved peripheral insulin sensitivity, lower blood glucose and insulin levels. Compared to wild type littermates, PTPRT knockout mice show reduced food intake. Consistently, STAT3 phosphorylation is up-regulated in the hypothalamus of PTPRT knockout mice. These studies implicate PTPRT-modulated STAT3 signaling in the regulation of high-fat diet-induced obesity.
Introduction
Numerous studies have shown the deleterious effects of obesity on health, increasing all-cause mortality [1] and predisposing individuals to cardiovascular disease, diabetes and cancer [2]. Diet plays a crucial role in obesity, specifically those high in fats and sugar that increase body fat [3], [4]. Adipocytes, which increase in size and number during obesity, can dramatically influence a variety of metabolic processes by disturbing normal homeostatic signals [5]. Chief among these disturbances is insulin resistance, leading to hyperglycemia and diabetes [6]–[9].
Energy imbalance – essentially a combination of increased food intake with decreased energy expenditure – causes obesity [3], [10]. Circulating hormones, such as insulin and leptin, are readouts of the body’s energy state and act at the hypothalamus to affect food intake [3], [11]–[15]. Ideally, energy intake is equal to energy expenditure, leading to weight homeostasis. However, if not enough energy is released proportional to calories consumed, the excess energy is stored as lipid in adipocytes and weight gain ensues [13]. For example, dietary fat consumption affects both sides of the energy imbalance equation. Since it releases less satiety signals in comparison to protein and carbohydrate, it leads to increased food intake [10]. Conversely, since fats are an efficient form of energy and because they are stored instead of used as an energy source after feeding, dietary lipids also contribute to decreased energy expenditure [10], [13]. Therefore, from both biochemical and physiologic perspectives of energy homeostasis, an excess of food intake over what is expended leads to weight gain.
Protein tyrosine phosphatases (PTPs) modulate signaling pathways that regulate a variety of metabolic processes through de-phosphorylating tyrosine residues on proteins [16]. Increasing evidence suggests that PTPs play a crucial role in obesity and metabolic disease [16]. It has long been known that PTP1B is implicated in obesity, insulin resistance and type-2 diabetes mellitus by regulating insulin signaling [17]. A recent study showed that TCPTP is also involved in obesity through modulating leptin signaling [18]. TCPTP dephosphorylates STAT3 at the tyrosine 705 (Y705) residue. STAT3 Y705 phosphorylation is a key mediator of leptin signaling in the hypothalamus [19], [20]. Leptin-STAT3 signaling suppresses the drive for food intake by increasing the expression of anorectic neuropeptides and repress those favoring orexigenic responses [11], [17], [18], [21], [22].
Because we previously showed that STAT3 is a substrate of protein tyrosine phosphatase receptor T (PTPRT) [23], we investigate here whether PTPRT regulates food intake and obesity in mice.
Results
Ptprt −/− Mice are Resistant to High-fat Diet-induced Obesity
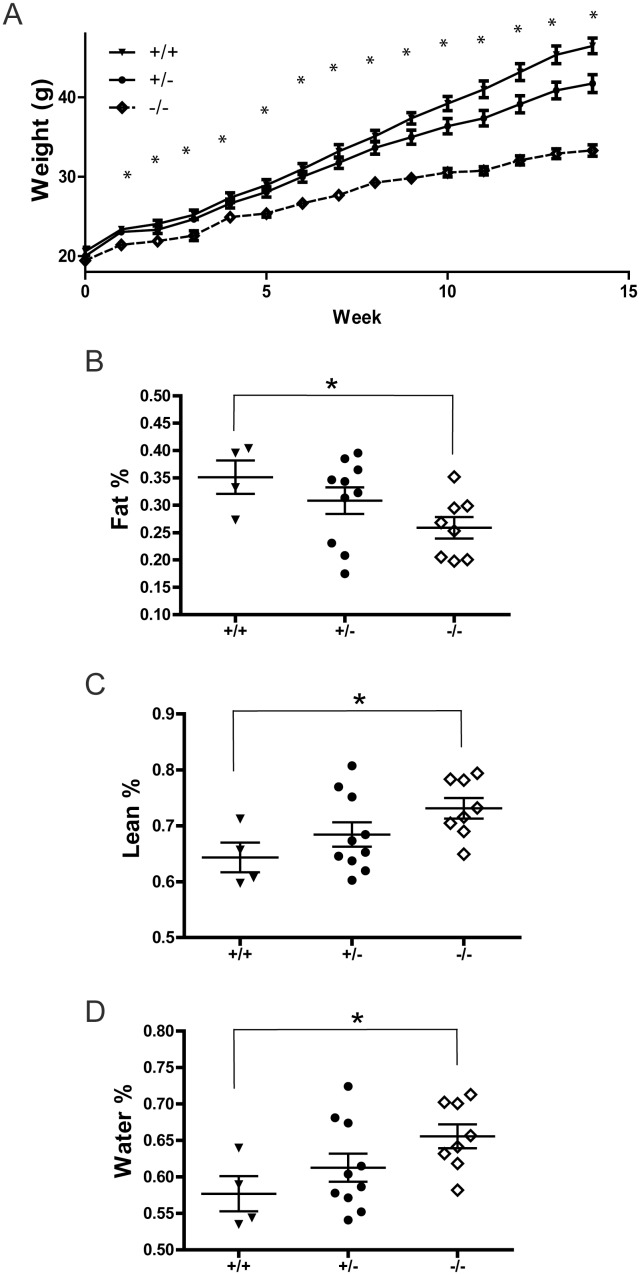
As described previously [24], we bred the Ptprt knockout allele into the C57BL/6 strain for over 15 generations. When mouse body weights were measured from 8-week-old to 36-week-old mice, we observed that the body weight of Ptprt −/− mice were slightly and consistently lower than those of Ptprt +/+ littermates on chow diet (Figure S1). However, these mice were not obese. It is well documented that high-fat diet induces obesity and insulin resistance in C57BL/6 male mice [25]. To interrogate if PTPRT plays a role in obesity, five-week-old male Ptprt +/+, Ptprt +/− and Ptprt −/− mice were fed with a high-fat diet for 14 weeks. Although Ptprt −/− mice were largely indistinguishable from their Ptprt +/+ and Ptprt +/− littermates in terms of body weight on a normal diet at a baseline of five weeks (Figure 1A, Time 0 weeks), the body weights of Ptprt −/− mice are significantly lower than those of Ptprt +/+ littermates through the course of the high-fat diet (Figure 1A). Consistent with previous reports [25], the Ptprt +/+ male mice were obese at the end of 14 weeks (average body weight = 46.5 g). In contrast, the Ptprt −/− male mice remained lean (average body weight = 33.3 g) after being fed with a high-fat diet for 14 weeks, suggesting that knocking out of Ptprt renders male mice resistant to high-fat diet-induced obesity.
Figure 1. PTPRT KO mice are resistant to high-fat diet-induced body composition changes.
A) Five week-old male mice of Ptprt +/+ (n = 8), Ptprt +/− (n = 14) and Ptprt −/− (n = 11) genotypes were fed with high-fat diet for 14 weeks. Body weight of the three genotypes was assessed weekly. (*p<0.05; t-test comparing Ptprt +/+ and Ptprt −/− genotypes). B–D) Body composition was analyzed by quantitative magnetic resonance after 14 weeks on a high-fat diet (Fat % – B, Lean % – C, Water % – D; *p<0.05; t-test comparing Ptprt +/+ and Ptprt −/− genotypes; t-test comparing Ptprt +/− and Ptprt −/− genotypes was not significant).
Ptprt −/− Mice have Less Body Fat by Percentage than Wild Type Littermates
Obesity and its associated co-morbidities are caused by excess amounts of body fat. Therefore, we set out to determine body composition of the high-fat diet fed mice using quantitative magnetic resonance to ensure that the difference in weight gain can be attributed to increased obesity [26]. As expected, the percentages of body fat of Ptprt+/+ and Ptprt+/− mice were significantly higher than that of Ptprt −/− mice (Figure 1B). Consistently, the lean body mass and water in Ptprt+/+ mice were lower than the Ptprt −/− mice (Figure 1 C and D). Since the body weight and body fat percentage of Ptprt +/− mice were not significantly different from those of Ptprt +/+ mice (Figure 1), we focused on Ptprt +/+ versus Ptprt −/− mice for in depth analyses in this study.
Ptprt −/− Reduces Food Intake
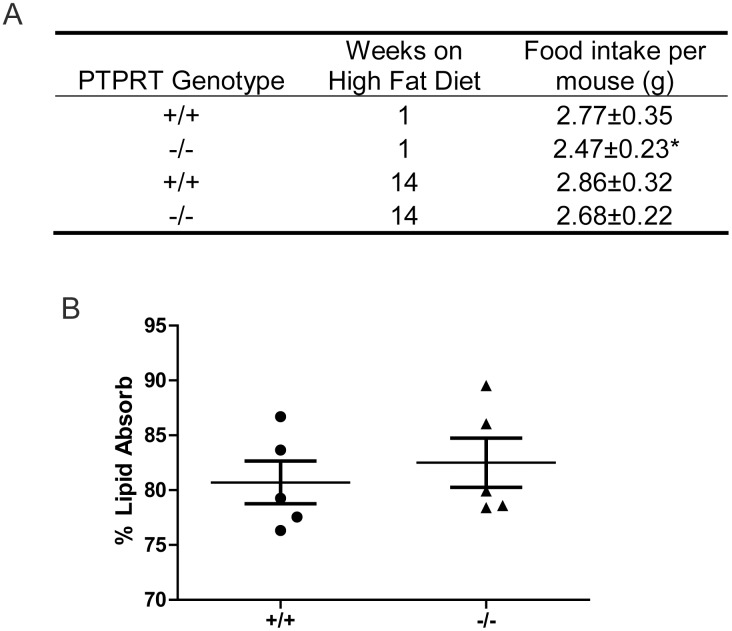
Next, we set out to interrogate the variety of mechanisms by which Ptprt −/− mice are resistant to high-fat diet-induced obesity. Given that food intake is one of the major factors that impact body weight, we measured food intake of Ptprt +/+ and Ptprt −/− mice both at the beginning and at the end of the high-fat diet. For a ten-day period, food intake was measured daily and average values were calculated. As shown in Figure 2A, Ptprt −/− mice ate significantly less than their Ptprt +/+ counterparts at the beginning of the high-fat diet period. However, at the end of the high-fat diet period, Ptprt −/− mice again trended toward lower food intake, but the difference did not reach statistical significance (p = 0.17).
Figure 2. PTPRT KO mice eat less but do not absorb dietary fats differently.
A) Average daily food intake of Ptprt +/+ (n = 8), and Ptprt −/− (n = 12) mice was assessed at beginning and end of the high-fat diet (*p<0.05; t-test). B) Dietary lipid absorption was assessed using fecal samples of Ptprt +/+ and Ptprt −/− mice after being fed a butter oil and sucrose behenate diet.
To determine the reason behind the increased food intake in Ptprt +/+ versus Ptprt −/− mice, we inferred that neurohormonal signals may play a role. Chief among these signals are leptin and neuropeptide Y, serving in an anorectic or orexigenic fashion, respectively. While plasma levels of leptin did not show significant difference between Ptprt +/+ versus Ptprt −/− mice (Figure S2), Ptprt +/+ mice had a significantly higher plasma level of neuropeptide Y versus Ptprt −/− mice at the beginning of the high-fat diet period (Figure S3A). This difference disappeared by the end of the high-fat diet period (Figure S3B). The plasma NPY appears to correlate with the food intake patterns at the beginning and end of the high-fat diet period.
Since dietary lipid absorption also impacts body weight and because PTPRT is expressed in the small intestine and colon [24], we set out to assess the lipid absorption capacity of Ptprt +/+ and Ptprt −/− mice using non-invasive fecal analysis [27]. However, these two cohorts did not show any difference in absorbing dietary fats (Figure 2B). Taken together, our data suggest that the reduced body weight of Ptprt −/− mice may be due to less food consumption.
Ptprt −/− Mice have Reduced Energy Expenditure than Wild Type Mice
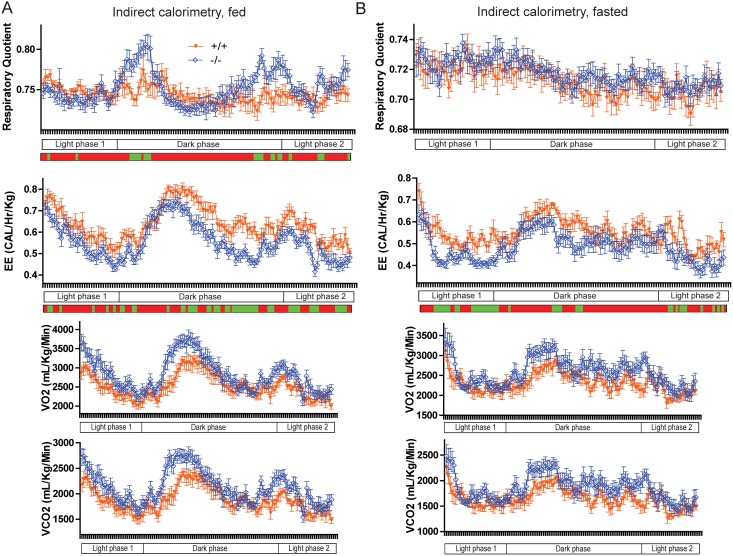
Since reduced energy expenditure and differences in nutrient utilization could also contribute to obesity, we assessed the energy expenditure and respiratory quotient of Ptprt +/+ and Ptprt −/− mice via indirect calorimetry in both the fed (Figure 3A) and fasted (Figure 3B) state. According to the energy expenditure values, Ptprt −/− mice had reduced energy expenditure than Ptprt +/+ mice in both the fed and fasted state (Figure 3, second row). However, reduced energy expenditure in Ptprt −/− mice does not explain the weight difference between Ptprt +/+ and Ptprt −/− mice. The respiratory quotient of Ptprt +/+ and Ptprt −/− mice was indistinguishable in the fasted state (Figure 3B, top panel). In the fed state, Ptprt −/− mice had a higher respiratory quotient than Ptprt +/+ mice during the dark phase (Figure 3A, top panel), indicating they preferentially use glucose, but this difference was not sustained through the whole 24-hour period of testing. Taken as a whole, indirect calorimetry demonstrates that the metabolic phenotype of Ptprt −/− mice does not explain their reduced body weight versus their Ptprt +/+ littermates.
Figure 3. PTPRT KO mice utilize more glucose and expend less energy than wild type mice.
Energy expenditure (Heat Released and Respiratory Quotient) was assessed through indirect calorimetry for mice in fed (A) and fasted (B) state through 24 hours (green segments: p<0.05; t-test). Ptprt +/+ (n = 8); Ptprt −/− (n = 11).
Ptprt −/− Mice Resist High-fat Diet-induced Hyperglycemia and Insulin Resistance
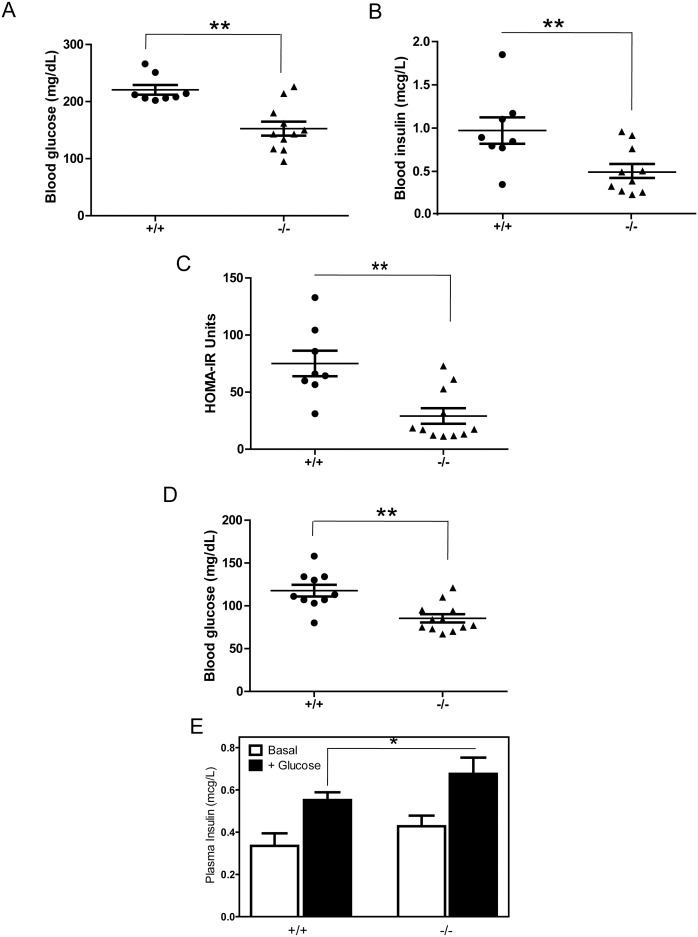
Given that obesity often causes metabolic syndrome, such as hyperglycemia and peripheral insulin resistance, we measured fasting glucose and insulin levels in Ptprt+/+ and Ptprt −/− littermates. At the end of the high-fat diet treatment, the average blood glucose levels in Ptprt +/+ mice reached 220.6 mg/dL; therefore, these mice were hyperglycemic. In contrast, the blood glucose levels in Ptprt −/− were within normal range at 152.6 mg/dL (Figure 4A). Accordingly, Ptprt +/+ mice also had higher insulin levels than the Ptprt −/− counterparts after the high-fat diet (Figure 4B). These blood glucose and blood insulin values can be used to estimate peripheral insulin resistance using the HOMA-IR model [28]. By this calculation, Ptprt −/− had much lower HOMA-IR values than their Ptprt +/+ littermates (Figure 4C), indicating a prediction of insulin sensitivity versus Ptprt +/+ mice. It is worth noting that the Ptprt +/+ mice were neither hyperglycemic nor insulin resistant before high-fat diet treatment, although the blood glucose levels in the Ptprt +/+ mice were slightly higher than that of Ptprt −/− littermates (Figure 4D). No blood insulin difference was observed before high-fat diet treatment among the Ptprt +/+ and Ptprt −/− mice (data not shown). Before the high-fat diet, Ptprt −/− mice also secreted more insulin in response to a glucose bolus (Figure 4E).
Figure 4. PTPRT KO mice have less insulin resistance than wild type mice after high-fat diet.
A) Fasting blood glucose levels were assessed after 14 weeks on a high-fat diet (**p<0.01; t-test). B) Fasting insulin levels were assessed after 14 weeks on a high-fat diet (**p<0.01; t-test). C) HOMA-IR calculations of Ptprt +/+ and Ptprt −/− mice after high-fat diet (**p<0.01; t-test). D) Fasting blood glucose levels were assessed before high-fat diet (*p<0.05). E) Glucose stimulated insulin secretion test between Ptprt +/+ (n = 5) and Ptprt −/− (n = 5) mice before high-fat diet (*p<0.05; t-test).
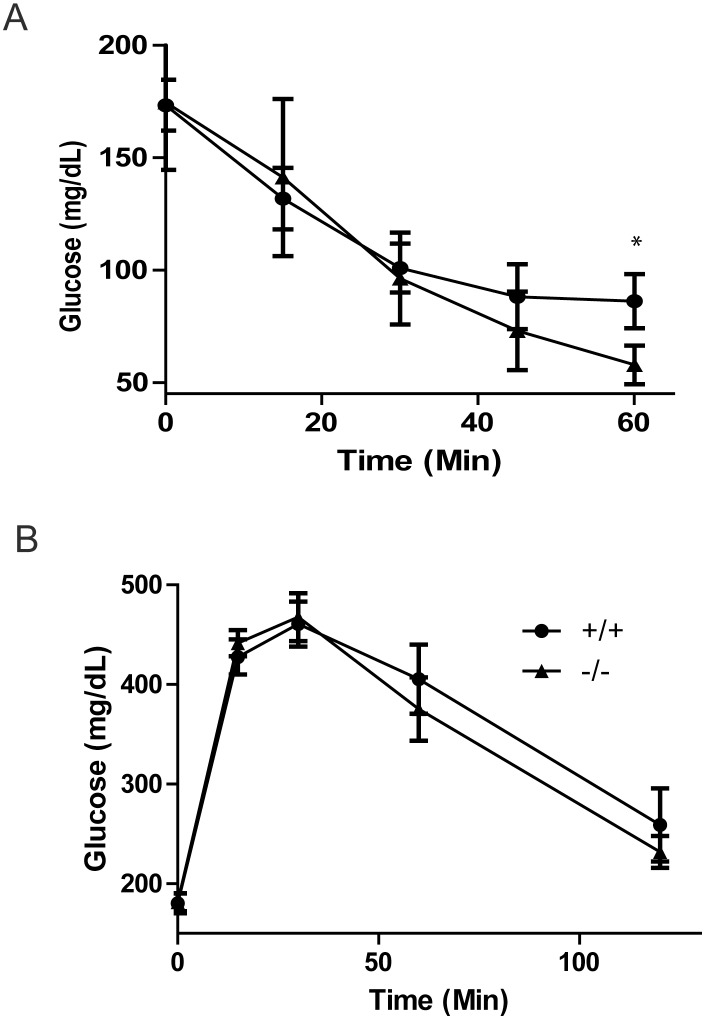
We then further measured peripheral insulin resistance in mice fed the high-fat diet via an insulin tolerance test. Consistent with the HOMA-IR calculation, Ptprt −/− mice had a lower glucose value in response to an insulin bolus after 60 minutes (Figure 5A). However, Ptprt −/− and Ptprt +/+ mice did not have different glucose clearance in response to a glucose tolerance test (Figure 5B). Taken together, our data suggest that loss of PTPRT function attenuates the development of peripheral insulin resistance after a high-fat diet.
Figure 5. PTPRT KO mice demonstrate better insulin regulation than wild type mice.
A) Insulin tolerance test of Ptprt +/+ (n = 8) and Ptprt −/− (n = 11) mice after high-fat diet (*p<0.05; t-test). B) Glucose tolerance test of Ptprt +/+ (n = 8) and Ptprt −/− (n = 11) mice after high-fat diet.
Metabolic Differences between Ptprt +/+ and Ptprt −/− Littermates
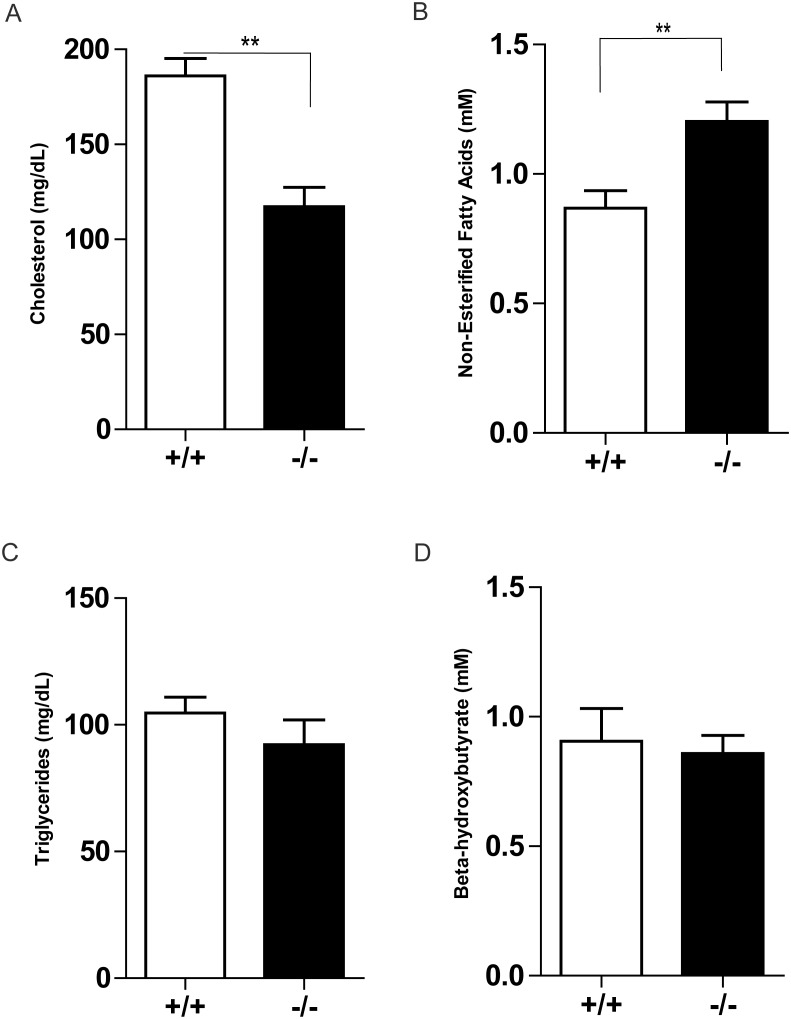
Given the deviation seen between Ptprt +/+ and Ptprt −/− mice as it relates to glucose and insulin metabolism, we decided to interrogate their blood plasma for differences in other nutrients. These blood metabolites will shed additional light onto the metabolic disturbances that Ptprt +/+ mice are experiencing. Interestingly, Ptprt −/− mice had lower cholesterol and higher free-fatty acids than Ptprt +/+ mice, but we did not observe an increase in triglycerides or β-hydroxybutyrate in these mice (Figure 6). Once fatty acids are oxidized, the acetyl CoA produced is used to generate ketone bodies such as β-hydroxybutyrate. As such, PTPRT may also regulate the utilization and storage of dietary fats.
Figure 6. PTPRT KO mice have different blood chemistry values after high-fat diet.
Fasted plasma concentrations of cholesterol (A), non-esterified fatty acids (B), triglycerides (C) and beta-hydroxybutyrate (D) of Ptprt +/+ (n = 8) and Ptprt −/− (n = 11) mice after high-fat diet (**p<0.01; t-test).
Phospho-STAT3 Increased in the Hypothalamus of Ptprt −/− Mice
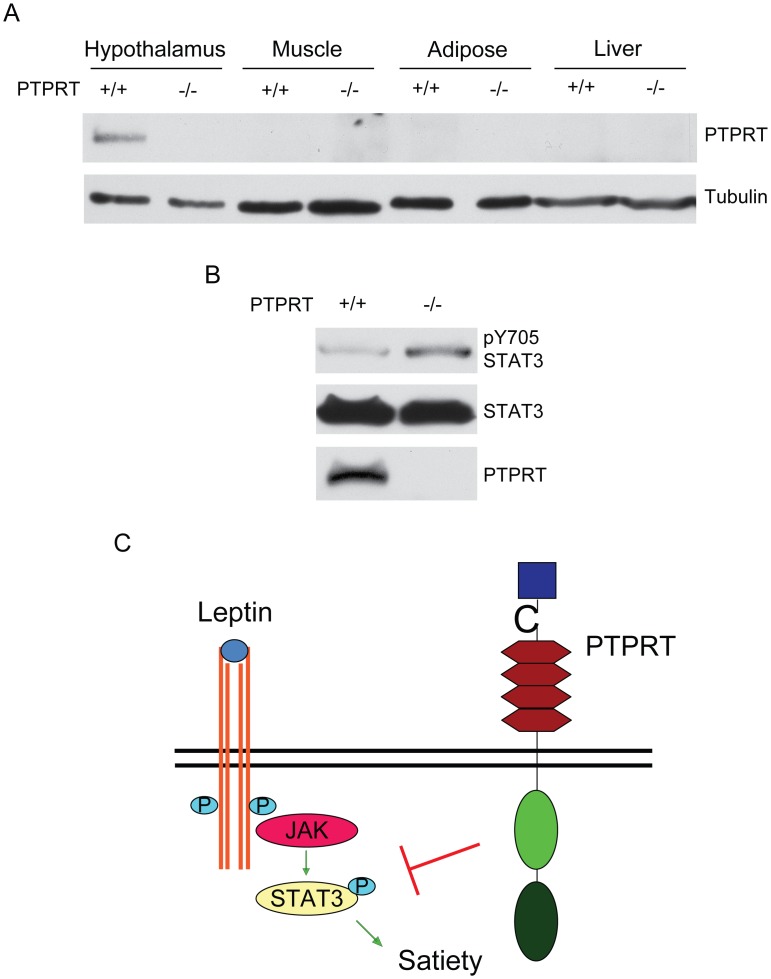
To elucidate the molecular mechanisms by which Ptprt −/− mice resist high-fat diet-induced obesity, we assessed PTPRT expression in tissues implicated in metabolic regulation. Consistent with a previous report that PTPRT is expressed in the hypothalamus [29], we detected PTPRT protein in the hypothalamus using Western blot analyses (Figure 7A). However, it is not expressed in the liver, adipose or muscle. Since STAT3 is a substrate of PTPRT, we reasoned that phospho-STAT3 levels may be increased in the hypothalamus of Ptprt −/− mice. As expected, we found that pY705 STAT3 is up-regulated in hypothalamus of Ptprt −/− mice compared to Ptprt +/+ mice (Figure 7B), suggesting that PTPRT modulates food intake by affecting phospho-STAT3 levels in the hypothalamus (Figure 7C).
Figure 7. PTPRT regulates STAT3 phosphorylation in mouse hypothalamus.
A) Tissue lysates from Ptprt +/+ and Ptprt −/− mice were blotted with the indicated antibodies. B) Hypothalamic lysates from Ptprt +/+ and Ptprt +/− mice were blotted with the indicated antibodies. C) Proposed model for the effect of PTPRT on food intake.
Discussion
Our study reveals that PTPRT regulates metabolism and body weight. Our data suggest that PTPRT could be a drug target for obesity, because Ptprt −/− mice resist many key effects of a high-fat diet, including increased body mass, hyperglycemia, hypercholesterolemia, insulin resistance and increased adiposity. Consistent with this notion, several recent human genetic studies linked obesity to chromosome 20q12–13 [30]–[32], the genomic region in which PTPRT is located.
The decreased food intake in Ptprt −/− mice suggests a behavioral mechanism as to why they weigh less than their Ptprt +/+ littermates. Food intake is primarily decreased by leptin signaling pathway [11], [21], [22] and increased by neuropeptide Y [14], [15], [33]. Leptin suppresses food intake by activating STAT3 phosphorylation in the hypothalamus [19], [20]; our previous study shows that PTPRT dephosphorylates STAT3 in colorectal cancers [23]. The decreased food intake in Ptprt −/− mice in the absence of increased circulating leptin levels suggests that Ptprt −/− mice have increased phospho-STAT3 independent of leptin activity in the hypothalamus (Figure 7C). Our data indicate that STAT3 hyper-phosphorylation in the hypothalamus represses food intake in Ptprt −/− mice. As such, we propose that the central nervous system plays a dominant role in the phenotype of Ptprt −/− mice.
Ptprt −/− mice demonstrate decreased peripheral insulin resistance as well as lower levels of blood insulin and glucose. Although a human study shows that PTPRT expression levels in adipose tissue are much higher in insulin-resistant individuals compared to insulin-sensitive individuals [34], we failed to detect PTPRT protein in mouse adipose (Figure 7A). Neither could we detect PTPRT protein in liver or muscle (Figure 7A). Our data indicate that PTPRT does not directly modulate insulin sensitivity in peripheral tissues. Instead, PTPRT may indirectly impact peripheral insulin resistance through affecting the nervous system control of energy homeostasis. It is well documented that increased plasma NPY from autonomic nervous system sources is associated with greater adiposity and increased insulin resistance [35]–[40]. Consistently, our data show increased NPY secretion in Ptprt +/+ mice that go on to develop obesity and insulin resistance. As such, the decrease in NPY in Ptprt −/− mice further suggests the role of PTPRT in nervous system regulating obesity and peripheral insulin resistance [41]–[46].
Materials and Methods
Animals and Diet
Treatment of experimental mice and related protocols were done in accordance with the Institutional Animal Care and Use Committee at Case Western Reserve University (CWRU). The protocol (Number 2010-0125) was approved by the IACUC Committee at CWRU. Male and female PTPRT heterozygous and homozygous knockout mice in a C57BL/6 background were generated as described previously [24]; referred to as Ptprt +/− and Ptprt −/−, respectively. Colonies of these mice were maintained on a normal chow diet (#5010 (4.5% fat by weight, 12.7% fat by calorie), LabDiet St. Louis, MO). Five weeks after birth, male Ptprt +/+, Ptprt +/− and Ptprt −/− mice were put on a high-fat diet (#D12331: 33% Hydrogenated Coconut Oil (35% fat by weight; 58% fat by calorie), Research Diets, Inc. New Brunswick, NJ) for 14 weeks. Body composition was analyzed by quantitative magnetic resonance as described previously [26].
Glucose and Insulin Tolerance Test
Tests were done as described previously [47], [48]. Mice were deprived of food overnight and then injected intraperitoneally with glucose (2 g/Kg) or insulin (0.9 g/Kg). Tail vein blood was sampled for glucose levels at 0, 15, 30 and 60 minutes after insulin or 0, 15, 30, 60 and 120 minutes after glucose using an UltraTouch meter. GTT was performed at the Mouse Metabolic Phenotyping Center of CWRU.
HOMA-IR
Insulin resistance was estimated for Ptprt +/+ and Ptprt −/− mice after high-fat diet using the homeostatic model assessment [28]. Formula = (Insulin (mcU/L)×Glucose (mg/dl)/405).
Insulin, Neuropeptide Y and Blood Chemistry Measurements
Tests were done as described previously [48]. Mouse blood plasma was isolated using Microtainer plasma separator tubes (BD Biosciences). Insulin was measured using an insulin enzyme-linked immunosorbent assay (Mercodia, Inc., Uppsala, SWE). Neuropeptide Y was measured using neuropeptide Y insulin enzyme-linked immunosorbent assay (EMD Millipore, Billerica, Massachusetts, USA). Mouse plasma was sent to Marshfield Laboratories to assess β-hydroxybutyrate, triglycerides, non-esterified fatty acids and total cholesterol.
Lipid Absorption
Tests were done as described previously [49]. Mice were fed a diet consisting of butter oil and 5% sucrose polybehenate for three days. Fecal pellets from these mice were collected and analyzed via gas chromatography of fatty acid methyl esters. The ratio of behenic acid to other fatty acids then was used to determine intestinal lipid absorption [27]. The lipid absorption studies were performed at the Cincinnati Mouse Metabolic Phenotyping Center.
Glucose-stimulated Insulin Secretion Test
Tests were done as described previously [50]. For the glucose-stimulated insulin secretion test, mice were starved overnight and 2 g/kg of glucose was injected intraperitoneally into the mice. Tail vein blood was collected and plasma insulin concentrations were measured at 0 and 30 minutes after glucose injection.
Indirect Calorimetry
Tests were done as described previously [51]. Indirect calorimetry (IDC) was performed using the Oxymax system (Columbus Instruments’ Comprehensive Lab Animal Monitoring System (CLAMS), Columbus, OH). VO2, VCO2, respiratory quotient (RQ) and heat (energy expenditure – EE) were determined. Energy expenditure was normalized to body mass. IDC was performed on mice either after an overnight fast and water (Fasted) or with ad lib food and water (Fed). The experiments ran for 22 hours on a 12 hour dark cycle (6 pm to 6 am).
Food Intake
Mice with ad lib access to food and water were placed in a clean cage and the food was weighed. The remaining food after 24 hours was weighed and the average food intake per mouse was calculated [47].
Western Blot
Tissues were lysed as described previously [52]. Total brain, hypothalamus, hind leg muscle, perigonadal adipose or liver tissue were lysed in RIPA lysis buffer (150 mM NaCl, 10 mM Tris-HCl (pH 7.5), 0.1% SDS, 1% Triton X-100, 1% Deoxycholate, 0.5 M 5 mM EDTA) supplemented with protease (Roche, Penzberg, GER) and phosphatase inhibitors (1 mM NaVO4, 50 mM NaF). Western blots were performed as described previously [24]. Antibodies for pSTAT3Y705 and STAT3 were from Cell Signaling (Danvers, MA, USA), tubulin from Sigma-Aldrich (St. Louis, MO, USA) and PTPRT from Biovendor (Asheville, NC, USA).
Statistical Analysis
Results were assessed using two-tailed unpaired Student’s t-test with significance set at p<0.05.
Supporting Information
PTPRT KO mice demonstrate slightly lower body weight than wild type littermates on normal chow diet. Eight week-old male mice of Ptprt +/+ (n = 13), Ptprt +/− (n = 13) and Ptprt −/− (n = 13) genotypes were maintained on a normal chow diet for 29 weeks. Body weight of the three genotypes was assessed weekly. (*p<0.05; t-test comparing Ptprt +/+ and Ptprt −/− genotypes).
(TIF)
PTPRT KO mice do not have different circulating levels of leptin. A) Fasting plasma leptin levels of Ptprt +/+ and Ptprt −/− mice were assessed before high-fat diet. B) Fasting plasma leptin levels of Ptprt +/+ and Ptprt −/− mice were assessed after 14 weeks on a high-fat diet.
(TIF)
PTPRT KO mice have decreased NPY levels before high-fat diet. A) Fasting plasma neuropeptide Y levels of Ptprt +/+ and Ptprt −/− mice were assessed before high-fat diet (**p<0.01; t-test). B) Fasting plasma neuropeptide Y levels of Ptprt +/+ and Ptprt −/− mice were assessed after 14 weeks on a high-fat diet.
(TIF)
Acknowledgments
The authors would like to thank Drs. Brian Bai and Zhi Huang for their technical assistance.
Funding Statement
Funding came from the National Institutes of Health R01CA127590, P50CA150964, U24 DK059630 and U24-DK76174. The funders had no role in study design, data collection and analysis, decision to publish, or preparation of the manuscript.
References
- 1. Berrington de Gonzalez A, Hartge P, Cerhan JR, Flint AJ, Hannan L, et al. (2010) Body-mass index and mortality among 1.46 million white adults. N Engl J Med 363: 2211–2219. [DOI] [PMC free article] [PubMed] [Google Scholar]
- 2. Flegal KM, Graubard BI, Williamson DF, Gail MH (2007) Cause-specific excess deaths associated with underweight, overweight, and obesity. JAMA 298: 2028–2037. [DOI] [PubMed] [Google Scholar]
- 3. Ahima RS (2011) Digging deeper into obesity. J Clin Invest 121: 2076–2079. [DOI] [PMC free article] [PubMed] [Google Scholar]
- 4. Bray GA (2010) Soft drink consumption and obesity: it is all about fructose. Curr Opin Lipidol 21: 51–57. [DOI] [PubMed] [Google Scholar]
- 5. Haslam DW, James WP (2005) Obesity. Lancet 366: 1197–1209. [DOI] [PubMed] [Google Scholar]
- 6. Rossmeisl M, Rim JS, Koza RA, Kozak LP (2003) Variation in type 2 diabetes–related traits in mouse strains susceptible to diet-induced obesity. Diabetes 52: 1958–1966. [DOI] [PubMed] [Google Scholar]
- 7. Schreyer SA, Wilson DL, LeBoeuf RC (1998) C57BL/6 mice fed high fat diets as models for diabetes-accelerated atherosclerosis. Atherosclerosis 136: 17–24. [DOI] [PubMed] [Google Scholar]
- 8. Surwit RS, Seldin MF, Kuhn CM, Cochrane C, Feinglos MN (1991) Control of expression of insulin resistance and hyperglycemia by different genetic factors in diabetic C57BL/6J mice. Diabetes 40: 82–87. [DOI] [PubMed] [Google Scholar]
- 9.Hussain AH, M.Z.I.; Claussen, B.; Asghar, S. (2010) Type 2 Diabetes and obesity: A review. Journal of Diabetology 2.
- 10. Jequier E (2002) Pathways to obesity. Int J Obes Relat Metab Disord 26 Suppl 2 S12–17. [DOI] [PubMed] [Google Scholar]
- 11. Schwartz MW, Woods SC, Porte D Jr, Seeley RJ, Baskin DG (2000) Central nervous system control of food intake. Nature 404: 661–671. [DOI] [PubMed] [Google Scholar]
- 12. Williams KW, Elmquist JK (2012) From neuroanatomy to behavior: central integration of peripheral signals regulating feeding behavior. Nat Neurosci 15: 1350–1355. [DOI] [PMC free article] [PubMed] [Google Scholar]
- 13. Hariri N, Thibault L (2010) High-fat diet-induced obesity in animal models. Nutr Res Rev 23: 270–299. [DOI] [PubMed] [Google Scholar]
- 14. Beck B (2006) Neuropeptide Y in normal eating and in genetic and dietary-induced obesity. Philos Trans R Soc Lond B Biol Sci 361: 1159–1185. [DOI] [PMC free article] [PubMed] [Google Scholar]
- 15. Bi S, Kim YJ, Zheng F (2012) Dorsomedial hypothalamic NPY and energy balance control. Neuropeptides 46: 309–314. [DOI] [PMC free article] [PubMed] [Google Scholar]
- 16.Xu E, Schwab M, Marette A (2013) Role of protein tyrosine phosphatases in the modulation of insulin signaling and their implication in the pathogenesis of obesity-linked insulin resistance. Rev Endocr Metab Disord. [DOI] [PubMed]
- 17. Bence KK, Delibegovic M, Xue B, Gorgun CZ, Hotamisligil GS, et al. (2006) Neuronal PTP1B regulates body weight, adiposity and leptin action. Nat Med 12: 917–924. [DOI] [PubMed] [Google Scholar]
- 18. Loh K, Fukushima A, Zhang X, Galic S, Briggs D, et al. (2011) Elevated hypothalamic TCPTP in obesity contributes to cellular leptin resistance. Cell Metab 14: 684–699. [DOI] [PMC free article] [PubMed] [Google Scholar]
- 19. Vaisse C, Halaas JL, Horvath CM, Darnell JE Jr, Stoffel M, et al. (1996) Leptin activation of Stat3 in the hypothalamus of wild-type and ob/ob mice but not db/db mice. Nat Genet 14: 95–97. [DOI] [PubMed] [Google Scholar]
- 20. Bates SH, Stearns WH, Dundon TA, Schubert M, Tso AW, et al. (2003) STAT3 signalling is required for leptin regulation of energy balance but not reproduction. Nature 421: 856–859. [DOI] [PubMed] [Google Scholar]
- 21. Munzberg H, Bjornholm M, Bates SH, Myers MG Jr (2005) Leptin receptor action and mechanisms of leptin resistance. Cell Mol Life Sci 62: 642–652. [DOI] [PubMed] [Google Scholar]
- 22. Elmquist JK, Maratos-Flier E, Saper CB, Flier JS (1998) Unraveling the central nervous system pathways underlying responses to leptin. Nat Neurosci 1: 445–450. [DOI] [PubMed] [Google Scholar]
- 23. Zhang X, Guo A, Yu J, Possemato A, Chen Y, et al. (2007) Identification of STAT3 as a substrate of receptor protein tyrosine phosphatase T. Proc Natl Acad Sci U S A. 104: 4060–4064. [DOI] [PMC free article] [PubMed] [Google Scholar]
- 24. Zhao Y, Zhang X, Guda K, Lawrence E, Sun Q, et al. (2010) Identification and functional characterization of paxillin as a target of protein tyrosine phosphatase receptor T. Proc Natl Acad Sci U S A. 107: 2592–2597. [DOI] [PMC free article] [PubMed] [Google Scholar]
- 25. West DB, Boozer CN, Moody DL, Atkinson RL (1992) Dietary obesity in nine inbred mouse strains. Am J Physiol 262: R1025–1032. [DOI] [PubMed] [Google Scholar]
- 26. Tinsley FC, Taicher GZ, Heiman ML (2004) Evaluation of a quantitative magnetic resonance method for mouse whole body composition analysis. Obes Res 12: 150–160. [DOI] [PubMed] [Google Scholar]
- 27. Jandacek RJ, Heubi JE, Tso P (2004) A novel, noninvasive method for the measurement of intestinal fat absorption. Gastroenterology 127: 139–144. [DOI] [PubMed] [Google Scholar]
- 28. Matthews DR, Hosker JP, Rudenski AS, Naylor BA, Treacher DF, et al. (1985) Homeostasis model assessment: insulin resistance and beta-cell function from fasting plasma glucose and insulin concentrations in man. Diabetologia 28: 412–419. [DOI] [PubMed] [Google Scholar]
- 29. Visel A, Carson J, Oldekamp J, Warnecke M, Jakubcakova V, et al. (2007) Regulatory pathway analysis by high-throughput in situ hybridization. PLoS Genet 3: 1867–1883. [DOI] [PMC free article] [PubMed] [Google Scholar]
- 30. Lembertas AV, Perusse L, Chagnon YC, Fisler JS, Warden CH, et al. (1997) Identification of an obesity quantitative trait locus on mouse chromosome 2 and evidence of linkage to body fat and insulin on the human homologous region 20q. J Clin Invest 100: 1240–1247. [DOI] [PMC free article] [PubMed] [Google Scholar]
- 31. Lee JH, Reed DR, Li WD, Xu W, Joo EJ, et al. (1999) Genome scan for human obesity and linkage to markers in 20q13. Am J Hum Genet 64: 196–209. [DOI] [PMC free article] [PubMed] [Google Scholar]
- 32. Borecki IB, Rice T, Perusse L, Bouchard C, Rao DC (1994) An exploratory investigation of genetic linkage with body composition and fatness phenotypes: the Quebec Family Study. Obes Res 2: 213–219. [DOI] [PubMed] [Google Scholar]
- 33. Brothers SP, Wahlestedt C (2010) Therapeutic potential of neuropeptide Y (NPY) receptor ligands. EMBO Mol Med 2: 429–439. [DOI] [PMC free article] [PubMed] [Google Scholar]
- 34. Elbein SC, Kern PA, Rasouli N, Yao-Borengasser A, Sharma NK, et al. (2011) Global gene expression profiles of subcutaneous adipose and muscle from glucose-tolerant, insulin-sensitive, and insulin-resistant individuals matched for BMI. Diabetes 60: 1019–1029. [DOI] [PMC free article] [PubMed] [Google Scholar]
- 35. Ruohonen ST, Pesonen U, Moritz N, Kaipio K, Roytta M, et al. (2008) Transgenic mice overexpressing neuropeptide Y in noradrenergic neurons: a novel model of increased adiposity and impaired glucose tolerance. Diabetes 57: 1517–1525. [DOI] [PubMed] [Google Scholar]
- 36. Han R, Li A, Li L, Kitlinska JB, Zukowska Z (2012) Maternal low-protein diet up-regulates the neuropeptide Y system in visceral fat and leads to abdominal obesity and glucose intolerance in a sex- and time-specific manner. FASEB J 26: 3528–3536. [DOI] [PMC free article] [PubMed] [Google Scholar]
- 37. Kuo LE, Kitlinska JB, Tilan JU, Li L, Baker SB, et al. (2007) Neuropeptide Y acts directly in the periphery on fat tissue and mediates stress-induced obesity and metabolic syndrome. Nat Med 13: 803–811. [DOI] [PubMed] [Google Scholar]
- 38. Ruohonen ST, Vahatalo LH, Savontaus E (2012) Diet-induced obesity in mice overexpressing neuropeptide y in noradrenergic neurons. Int J Pept 2012: 452524. [DOI] [PMC free article] [PubMed] [Google Scholar]
- 39. Warne JP, Dallman MF (2007) Stress, diet and abdominal obesity: Y? Nat Med 13: 781–783. [DOI] [PubMed] [Google Scholar]
- 40. Bagherian A, Kalhori KA, Sadeghi M, Mirhosseini F, Parisay I (2010) An in vitro study of root and canal morphology of human deciduous molars in an Iranian population. J Oral Sci 52: 397–403. [DOI] [PubMed] [Google Scholar]
- 41. Koch L, Wunderlich FT, Seibler J, Konner AC, Hampel B, et al. (2008) Central insulin action regulates peripheral glucose and fat metabolism in mice. J Clin Invest 118: 2132–2147. [DOI] [PMC free article] [PubMed] [Google Scholar]
- 42. Lam CK, Chari M, Rutter GA, Lam TK (2011) Hypothalamic nutrient sensing activates a forebrain-hindbrain neuronal circuit to regulate glucose production in vivo. Diabetes 60: 107–113. [DOI] [PMC free article] [PubMed] [Google Scholar]
- 43. Pagotto U (2009) Where does insulin resistance start? The brain. Diabetes Care 32 Suppl 2 S174–177. [DOI] [PMC free article] [PubMed] [Google Scholar]
- 44. Gerozissis K (2008) Brain insulin, energy and glucose homeostasis; genes, environment and metabolic pathologies. Eur J Pharmacol 585: 38–49. [DOI] [PubMed] [Google Scholar]
- 45. Obici S, Zhang BB, Karkanias G, Rossetti L (2002) Hypothalamic insulin signaling is required for inhibition of glucose production. Nat Med 8: 1376–1382. [DOI] [PubMed] [Google Scholar]
- 46. Carey M, Kehlenbrink S, Hawkins M (2013) Evidence for central regulation of glucose metabolism. J Biol Chem 288: 34981–34988. [DOI] [PMC free article] [PubMed] [Google Scholar]
- 47.Marwarha G, Berry DC, Croniger CM, Noy N (2013) The retinol esterifying enzyme LRAT supports cell signaling by retinol-binding protein and its receptor STRA6. FASEB J. [DOI] [PMC free article] [PubMed]
- 48. Berry DC, Jacobs H, Marwarha G, Gely-Pernot A, O’Byrne SM, et al. (2013) The STRA6 receptor is essential for retinol-binding protein-induced insulin resistance but not for maintaining vitamin A homeostasis in tissues other than the eye. J Biol Chem 288: 24528–24539. [DOI] [PMC free article] [PubMed] [Google Scholar]
- 49. Buchner DA, Geisinger JM, Glazebrook PA, Morgan MG, Spiezio SH, et al. (2012) The juxtaparanodal proteins CNTNAP2 and TAG1 regulate diet-induced obesity. Mamm Genome 23: 431–442. [DOI] [PMC free article] [PubMed] [Google Scholar]
- 50. Millward CA, Desantis D, Hsieh CW, Heaney JD, Pisano S, et al. (2010) Phosphoenolpyruvate carboxykinase (Pck1) helps regulate the triglyceride/fatty acid cycle and development of insulin resistance in mice. J Lipid Res 51: 1452–1463. [DOI] [PMC free article] [PubMed] [Google Scholar]
- 51. Prince A, Zhang Y, Croniger C, Puchowicz M (2013) Oxidative metabolism: glucose versus ketones. Adv Exp Med Biol 789: 323–328. [DOI] [PubMed] [Google Scholar]
- 52. Marwarha G, Berry DC, Croniger CM, Noy N (2014) The retinol esterifying enzyme LRAT supports cell signaling by retinol-binding protein and its receptor STRA6. FASEB J 28: 26–34. [DOI] [PMC free article] [PubMed] [Google Scholar]
Associated Data
This section collects any data citations, data availability statements, or supplementary materials included in this article.
Supplementary Materials
PTPRT KO mice demonstrate slightly lower body weight than wild type littermates on normal chow diet. Eight week-old male mice of Ptprt +/+ (n = 13), Ptprt +/− (n = 13) and Ptprt −/− (n = 13) genotypes were maintained on a normal chow diet for 29 weeks. Body weight of the three genotypes was assessed weekly. (*p<0.05; t-test comparing Ptprt +/+ and Ptprt −/− genotypes).
(TIF)
PTPRT KO mice do not have different circulating levels of leptin. A) Fasting plasma leptin levels of Ptprt +/+ and Ptprt −/− mice were assessed before high-fat diet. B) Fasting plasma leptin levels of Ptprt +/+ and Ptprt −/− mice were assessed after 14 weeks on a high-fat diet.
(TIF)
PTPRT KO mice have decreased NPY levels before high-fat diet. A) Fasting plasma neuropeptide Y levels of Ptprt +/+ and Ptprt −/− mice were assessed before high-fat diet (**p<0.01; t-test). B) Fasting plasma neuropeptide Y levels of Ptprt +/+ and Ptprt −/− mice were assessed after 14 weeks on a high-fat diet.
(TIF)


