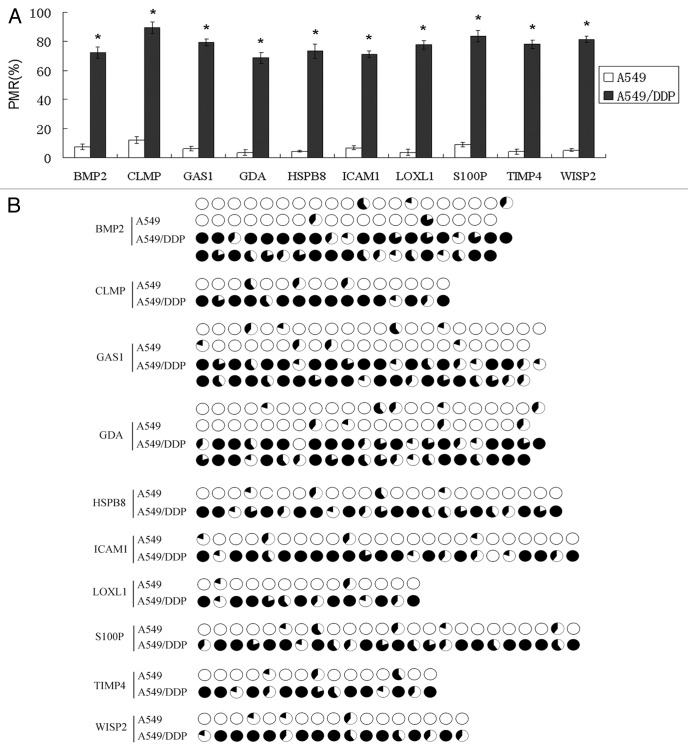
Figure 2. Validation of the methylation status by qMSP (A) and BSP (B). All 10 candidate genes were confirmed to be hypermethylated in A549/DDP cells compared with A549 cells. The amount of methylated DNA was determined by the threshold cycle number (Ct) for each sample and assessed as the percentage of methylation reference (PMR). Each pie in BSP results represented a CpG site; methylation (black) and unmethylation (white) ratios were calculated according to the five clones.

An official website of the United States government
Here's how you know
Official websites use .gov
A
.gov website belongs to an official
government organization in the United States.
Secure .gov websites use HTTPS
A lock (
) or https:// means you've safely
connected to the .gov website. Share sensitive
information only on official, secure websites.
