

Abstract
We hypothesized that competition between NRTI-triphosphate and endogenous deoxyribonucleoside triphosphate (dNTP) may lead to depletion of dNTP pools and mitochondrial dysfunction independent of Pol-γ inhibition. We collected peripheral blood mononuclear cells from 75 adults (25 cases: HIV-infected with mitochondrial toxicity, 25 HIV-infected positive controls, and 25 HIV-negative controls). We observed statistically significant individual and group differences in ribonucleotide (RN) and deoxyribonucleotide (dRN) pools. The median RN pool was 10062 (IQR, 7090 – 12590), 4360 (IQR, 3058 –6838), and 2968 (IQR, 2538 – 4436) pmol/106 cells for negative controls, positive controls, and cases, respectively. Cases had significantly higher absolute mtDNA copy number compared to negative controls (p<0.05). Cases had significantly higher expression of Pol-γ, nucleoside transporters, cellular kinases, and ABC compared to controls. Antiretroviral therapy perturbs ribonucleotide and deoxyribonucleotide pools. Depletion of RN and dRN pools may be associated with ART-induced mitochondrial toxicity independent of Pol-γ inhibition.
Keywords: Ribonucleotides, deoxyribonucleotides, mitochondrial toxicity, human immunodeficiency virus, polymerase gamma, nucleoside transporters, cellular kinases, ATP-Binding Cassette proteins
Introduction
Antiretroviral therapy (ART) has significantly reduced HIV-related morbidity and mortality (1). However, therapeutic benefit of ART is often limited by delayed drug-associated toxicity (2, 3). ART regimens employ at least one nucleoside reverse transcriptase inhibitor (NRTI) (http://AIDSinfo.nih.gov). The adverse effects of NRTI are mediated through the effect on host DNA polymerase activity. DNA polymerase gamma (Pol-γ), responsible for mitochondrial DNA (mtDNA) replication, is inhibited by NRTIs (4). In vitro studies have demonstrated that inhibition of Pol-γ by NRTIs leads to depletion of mtDNA and subsequent dysfunction of mitochondria; the ‘Pol-γ hypothesis’ (4–7). However, there are conflicting results from clinical studies on inhibition of Pol-γ leading to mtDNA depletion. Several studies have reported a lack of correlation between mitochondria toxicity and mtDNA depletion (8–11). Moreover, protease inhibitors (PIs) and non-nucleoside reverse transcriptase inhibitors (NNRTIs) do not inhibit Pol-γ and yet they cause mitochondrial dysfunction as well (12–14). These conflicting reports could be due to methodological differences and/or the tissue-specificity of NRTI-induced mitochondrial toxicity (15–17). Is it possible that ART-induced mitochondrial toxicity may not be limited to inhibition of Pol-γ alone?
We hypothesized that competition between NRTI-triphosphate and endogenous deoxyribonucleoside triphosphate (dNTP) may lead to depletion of dNTP pools and mitochondrial dysfunction independent of Pol-γ inhibition. dNTPs are synthesized via two pathways: de novo and salvage pathways (18). NRTIs are prodrugs metabolized by cells to their active moieties (triphosphates) using pathways similar to that of endogenous ribonucleosides (RNs) and deoxyribonucleosides (dRNs). NRTI-triphosphates compete with endogenous dNTPs for incorporation into elongating DNA; leading to chain termination (19).
Nucleosides and their analogs are hydrophobic molecules and cannot cross cellular membranes by simple diffusion; therefore, they require nucleoside transport proteins (20). The RN and dRN pools could be affected by the nucleoside transport proteins and ATP-Binding Cassette (ABC) transport proteins. Nucleoside transport proteins are encoded by three gene families: SLC22, SLC28, and SLC29. SLC22 encodes organic anion transporter (e.g., OAT1 and OAT2) and organic cation transporter (e.g., OCT1 and OCT2); SLC28 encodes concentrative nucleoside transporter (e.g., CNT1 and CNT2); and SLC29 encodes equilibrative nucleoside transporter (e.g., ENT1 and ENT2) proteins. The ABC transport proteins such as MDR1, MRP1, MRP2, and MRP4 are known to efflux nucleotides (21).
The determination of RN and dRN pools sizes could be useful in predicting the efficacy and toxicity of nucleoside analogs. There are limited studies on dNTP pool size in relation to nucleoside analog efficacy and toxicity due to the time-consuming and insensitivity of available assays. We recently reported using a novel LC/MS/MS assay to simultaneously quantify all RNs and dRNs in cellular extracts (22). In the current study, we sought to determine the association between RN and dRN pool sizes and ART-induced mitochondrial toxicity in order to refine and generate hypotheses on potential mechanisms of ART-induced mitochondrial toxicity.
Results
Characteristics of study population
We enrolled 25 HIV-infected patients on NRTIs with mitochondrial toxicity (cases) to the study. Each case was matched for age, race, and gender with an HIV-infected control on NRTI-based ART without mitochondrial toxicity and an HIV-uninfected volunteer. The median age of participants was 53 years (interquartile range (IQR), 50–57) with 60% of them being males. The race distribution among participants was 60% African American, 28% White, and 12% Hispanics. At the time of enrollment, the cases had the following toxicities: hyperlipidemia (28%), elevated liver function tests (36%), thrombocytopenia (28%), elevated BUN/creatinine (16%), anemia (8%), lipodystrophy (12%), peripheral neuropathy (8%), lactic acidosis (5%), and pancytopenia (4%). Fifty two percent of cases had only one manifestation of toxicity and 48% had multiple manifestations of toxicity. The median duration of mitochondrial toxicity was 2.2 years (IQR, 1.3 –7.0). As shown in Table 1, the cases and positive controls were balanced with respect to HIV viral load, current nucleoside type, previous nucleoside analog use, duration and number of previous nucleoside analogs. HIV-infected controls compared with cases had higher CD4 count (p=0.04), longer duration of HIV diagnosis (p<0.001), and current nucleoside analog use (p=0.02).
Table 1.
HIV disease characteristics among HIV-infected individuals with and without mitochondrial toxicity
| Continuous variable, Median (IQR*) | HIV-infected without Toxicity | HIV-infected with Toxicity | P-value |
|---|---|---|---|
| CD4 count, cells/μL | 661 (597–840) | 500 (293–709) | 0.04 |
| Viral Load, copies/mL | 20 (20–20)† | 20 (20–29)† | 0.28 |
| Duration of HIV (years) | 16 (10–18) | 9 (6–10) | 0.001 |
| Duration on current nucleoside analogs (years) | 5 (4–6) | 3 (2–5.5) | 0.02 |
| Duration of previous nucleoside (years) | 2 (0–4) | 2 (0–5) | 0.99 |
| Categorical variable, (N,%) | |||
| Current HIV nucleoside analog type | 0.33 | ||
| Truvada | 10 (42%) | 14 (58%) | |
| Atripla | 10 (67%) | 5 (33%) | |
| Combivir | 0 (0%) | 1 (100%) | |
| Epivir | 4(44%) | 5 (56%) | |
| Trizivir | 1(100%) | 0 (0%) | |
| Previous nucleosides use | 17 (46%) | 20 (54%) | 0.52 |
| Number of previous nucleoside analogs | 0.13 | ||
| None | 8 (53%) | 7(47%) | |
| Single | 3 (25%) | 9 (75%) | |
| Multiple | 14 (61%) | 9 (39%) | |
Interquartile range, IQR
Limit of detection of the viral load assay is 20 copies/mL; patients with undetectable viral load were assigned a value of 20 copies/mL for the analysis.
Ribonucleotide (RN) pool size differences among study groups
We determined the RN pool sizes among the three study groups using our novel LC/MS/MS assay (22). We observed individual variation and group differences in the RN pool size as illustrated in Figure 1. The heat map presents concentration of each RN standardized across participants in all three groups and is color-coded with red, black, and green denoting high, medium, and low concentrations, respectively. The HIV-uninfected individuals (ID numbers prefixed by ‘N’) had significantly higher concentrations of all ribonucleotide pools (i.e., adenosine, cytosine, guanosine, and uridine) compared with HIV-infected controls (ID number prefixed by ‘P’) and cases (ID number prefixed by ‘C’). The median total RN concentration was 10062 (IQR, 7090 – 12590), 4360 (IQR, 3058 –6838), and 2968 (IQR, 2538 – 4436) pmol/106 cells for negative controls, positive controls, and cases, respectively (Figure 2A). The difference in RN pool between the negative controls and positive controls; negative controls and cases; and positive controls and cases was significant (p<0.0001, <0.0001, and <0.05, respectively).
Figure 1.

Differences in ribonucleotide pool sizes among study groups. The ribonucleotides were extracted from PBMCs from participants and the concentration quantified using LC/MS/MS as detailed in the ‘Methods’. The heat map shows the intensity of ribonucleotide pool concentrations among HIV-infected with mitochondrial toxicity (identification number prefixed with ‘C’ on y-axis), HIV-infected without mitochondrial toxicity (identification number prefixed with ‘P’ on y-axis), and HIV-uninfected controls (identification number prefixed with ‘N’ on y-axis). On the x-axis are the different ribonucleotides. Each ribonucleotide concentration was normalized and compared across the groups; the absolute concentrations for the different ribonucleotides differ. The color code represents the magnitude of ribonucleotide concentration across each column, with green, black and red representing low, medium, and high concentrations, respectively. The color coding was obtained by z-transformation of concentrations (i.e., the concentration of a ribonucleotide of interest for an individual minus the mean concentration for all participants and divided by the standard deviation). The color coding is a continuum with green as negative, black as zero, and red as positive z-transformed data.
Figure 2.
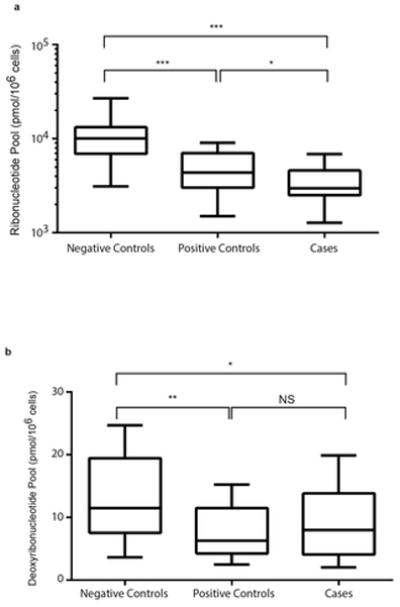
Variation in ribonucleotide and deoxyribonucleotide pools. The nucleotides were extracted from PBMCs from participants and the concentration quantified using LC/MS/MS as detailed in the ‘Methods’. Data are represented as box-and-stem plots, in which boxes represent the median values and the second and third quartiles, and stems extend to the 10th and 90th percentiles. Different superscripts *, **, *** indicate significant differences at p≤0.05, ≤0.01, and ≤0.001, respectively. NS, no significance. A. Ribonucleotide pools. B. Deoxyribonucleotide pools.
Deoxyribonucleotide pool size differences among study groups
Since NRTI triphosphates compete with endogenous dNTPs, we investigated the association between NRTI-based ART and deoxyribonucleotide (dRN) pool sizes (19). We observed individual and group differences in dRN pools (Figure 2B). The median total dRN concentration was 11.0 (IQR, 7 –19), 6.3 (IQR, 4 – 11), and 8.0 (IQR, 4 –14) pmol/106 cells for negative controls, positive controls, and cases, respectively. Negative controls had significantly larger dRN pool size compared with positive controls (p=0.02) and cases (p=0.05). However, there was no significant difference between positive controls and cases.
Ratios of ribonucleotides and deoxyribonucleotides among study groups
There was no significant difference in adenosine triphosphate (ATP) levels among the groups so we determined the energy charge and ratio of RN to dRN among the groups. The energy charge was defined as the concentration of ATP divided by the concentration of adenosine diphosphate (ADP). Since RNs other than ATP could be used as phosphate donor, we calculated the energy ratios for the other RNs (Figure 3A). The energy charge (ATP/ADP) and guanosine triphosphate/guanosine diphosphate (GTP/GDP) ratio were not significantly different among the groups (p>0.1). However, negative controls had a significantly higher ratio for cytosine triphosphate/cytosine diphophate (CTP/CDP) and uridine triphosphate/uridine diphosphate (UTP/UDP) than positive controls and cases (Figure 3A).
Figure 3.
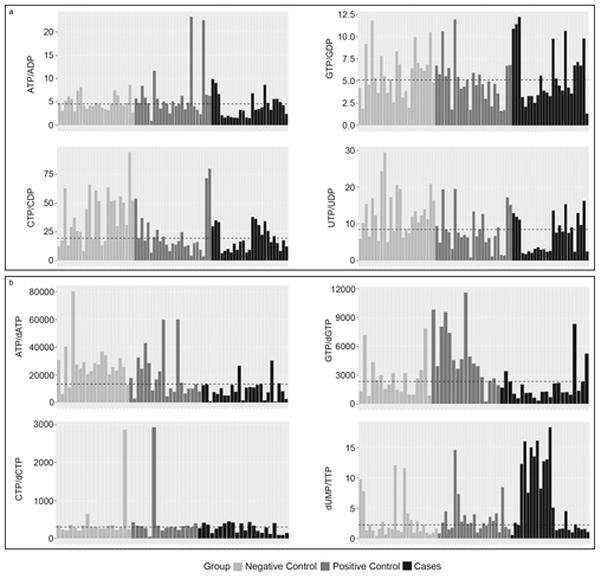
Figure 3A. Energy ratios among study groups. The waterfall plots illustrate the energy ratios with the dashed line representing the median ratio. The upper panel - left is ATP/ADP and right is GTP/GDP. The lower panel - left is CTP/CDP and right is UTP/UDP. The color code - grey is HIV-uninfected control (negative control); dark grey is HIV-infected without mitochondrial toxicity (positive control) and black is HIV-infected with mitochondrial toxicity (cases).
Figure 3B. Differences in ratios of ribonucleotide and deoxyribonucleotide pools among study groups. The waterfall plots illustrate the RN/dRN ratios with the dashed line representing the median ratio. The upper panel – left is ATP/dATP and right is GTP/dGTP. The lower panel – left is CTP/dCTP and right is dUMP/TTP. The color code - grey is HIV-uninfected control (negative control); dark grey is HIV-infected without mitochondrial toxicity (positive control) and black is HIV-infected with mitochondrial toxicity (cases).
The predominant pathway for production of dRN is de novo synthesis: the reduction of the respective RN to dRN by ribonucleotide reductase (18). Interestingly, cases had significantly lower RN pool compared to positive controls but there was no statistical difference in the dRN pool size. We calculated the RN/dRN ratio as a surrogate of the reserve potential of the de novo pathway (Figure 3B). The ATP/dATP ratio was significantly lower in cases compared to negative controls (p≤0.01). Cases had significantly higher dUMP/TTP ratio compared to positive and negative controls (p≤0.05).
Differences in mitochondrial DNA concentration and Pol-γ expression among study groups
With our finding of association between RN and dRN pool sizes and mitochondrial toxicity, we further investigated if the Pol-γ hypothesis of mitochondrial DNA depletion applied in our study participants. The absolute mtDNA copy number per 100 ng of genomic DNA was determined as described in the methods section. To our surprise, negative controls had statistically significant lower absolute mtDNA copy number compared to either cases (p<0.05) or positive controls (p<0.01). We did not observe mtDNA depletion in the cases as expected (Figure 4A). However, there was no statistically significant difference in absolute mtDNA copy number between cases and positive controls. With the apparent decreased in dNTPs, precursors for DNA synthesis, and normal or higher absolute mtDNA copy number in cases and positive controls, we investigated the expression of Pol-γ. As illustrated in Figure 4B, cases had significantly higher expression of Pol-γ in comparison to positive controls (p<0.05) and negative controls (p<0.01). There was no statistically significant difference in the expression of Pol-γ between negative controls and positive controls.
Figure 4.
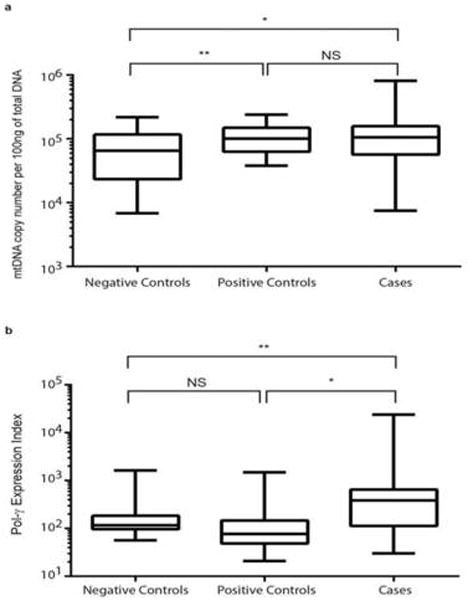
Figure 4A. Mitochondrial DNA copy number among study groups. A fragment of D-Loop of the mitochondrial DNA was amplified in duplicate in two independent experiments using quantitative RT-PCR. The absolute mtDNA copy number was calculated using serial dilutions of plasmid with known copy numbers of mtDNA (D-loop). Data are represented as box-and-stem plots, in which boxes represent the median values and the second and third quartiles, and stems extend to the 10th and 90th percentiles. Different superscripts *, **, *** indicate significant differences at p≤0.05, ≤0.01, and ≤0.001, respectively. NS, no significance.
Figure 4B. Differences in mRNA expression of Pol-γ among study groups. Quantitative real-time PCR was performed using RNA extracted from PBMCs to determine the mRNA expression of Pol-γ compared with GAPDH. The mRNA expression of Pol-γ was calculated as an expression index (EI), where EI = 1000 × 2−ΔCt, where ΔCt = Ctpol-γ − CtGAPDH. Data are represented as box-and-stem plots, in which boxes represent the median values and the second and third quartiles, and stems extend to the 10th and 90th percentiles. Different superscripts *, **, *** indicate significant differences at p≤0.05, ≤0.01, and ≤0.001, respectively. NS, no significance.
Differences in expression of key enzymes involved in deoxyribonucleoside metabolism
Since we did not observe mtDNA depletion in cases, we next investigated the determinants of the variation in RN and dRN pool sizes among the study groups. We evaluated the expression of the key enzymes involved in the metabolism of RNs and dRNs. We determined the mRNA expressions of p53RR (a subunit of ribonucleotide reductase; the rate limiting enzyme in the de novo pathway), TKI and dCK (rate limiting enzymes in the salvage pathway), as well as TK2 (rate limiting enzyme in the salvage pathway in the mitochondria). There was differential expression of TK1 (p<0.001), dCK (p<0.001), and TK2 (p=0.02) among the groups. Expression of p53RR was not significantly different (p=0.3). As illustrated in the heat map (Figure 5A), we observed a higher expression of dCK and TK1 in cases.
Figure 5.

Differences in mRNA expression of cellular kinases and transport proteins. Quantitative real-time PCR was performed using RNA extracted from PBMCs to determine the mRNA expression of enzyme or gene of interest compared with GAPDH. The mRNA expression of enzyme or gene of interest (x) was calculated as an expression index (EI), where EI = 1000 × 2−ΔCt, where ΔCt = Ctx − CtGAPDH. The heat map shows the intensity of expression of enzyme or gene of interest among HIV-infected with mitochondrial toxicity (identification number prefixed with ‘C’ on y-axis), HIV-infected without mitochondrial toxicity (identification number prefixed with ‘P’ on y-axis), and HIV-uninfected controls (identification number prefixed with ‘N’ on y-axis). The expression of each enzyme or gene was normalized and compared across the groups. The color code represents the magnitude of EI across each column, with red, black and green representing high, medium, and low concentrations, respectively.
A. Differences in mRNA expression of enzymes involved in biosynthesis of ribonucleotides and deoxyribonucleotides. dCK, deoxycytidine kinase; p53RR, subunit of ribonucleotide reductase; TKI, thymidine kinase -1; and TK2, thymidine kinase-2.
B. Differences in mRNA expression of nucleoside transport proteins. Concentrative nucleoside transporter (CNT1 and CNT2); equilibrative nucleoside transporter (ENT1 and ENT2); organic cation transporter (NTsOCT1 and NTsOCT2); and organic anion transporter (OAT1 and OAT2).
C. mRNA expression of ABC transporters. MDR1, MRP1, MRP2, MRP4, and MRP5.
Effect of nucleoside transporters and ATP-binding cassette proteins on pool size
Because nucleoside transport proteins determine the entry and export of nucleosides, they may have a direct effect on the pool size. There was statistically significant differential expression of ENT1 (p=0.03), OAT1 (p<0.001), and OCT2 (p=0.02) among the groups. As illustrated in Figure 5B, cases tended to have a higher expression of CNT1, ENT1, ENT2, OCT1, OCT2, OAT1 and OAT2. Of note, Negative controls had the least expression of the nucleoside transporters tested.
Furthermore, the pool size can be affected by the degree of efflux of nucleotides by ABC transport proteins. We investigated whether the expression of ATP-Binding Cassette (ABC) transport proteins (MDR1, MRP1, MPP2, and MRP4) was associated with the variation in the pool sizes among the three groups. Almost all the ABC transport proteins were differentially expressed among the groups: MDR1 (p<0.0001), MRP1 (p<0.001), MRP2 (p=0.12), MRP4 (p<0.0001), and MRP5 (p<0.0001). As illustrated in Figure 5C, cases tended to have much higher expression of MDR1, MRP2, MRP4, and MRP5 compared to either positive or negative controls.
Discussion
In our case-control study, we observed that ART perturbs both ribonucleotide and deoxyribonucleotide pool sizes in HIV-infected individuals in comparison to age, gender and race/ethnicity matched HIV-uninfected controls. Moreover, we observed that HIV-infected individuals on treatment with clinical and/or laboratory diagnosis of mitochondrial toxicity tended to have smaller pool sizes compared to HIV-infected individuals on treatment without a diagnosis of mitochondrial toxicity. Cases and positive controls had significantly higher absolute mtDNA copy number than that of negative controls. To our surprise, cases had statistically significant higher mRNA expression of Pol-γ compared to positive and negative controls. Our findings of depletion of RN and dRN pools but no significant depletion in absolute mtDNA in cases support our hypothesis that NRTI-induced mitochondrial dysfunction may result from an indirect effect of NRTI treatment through competition with endogenous dNTPs independent of inhibition of Pol-γ. Thus NRTI-induced mitochondria dysfunction may not be explained solely by the ‘Pol-γ hypothesis’.
Mitochondrial DNA depletion is the sine qua non of the ‘Pol-γ hypothesis’ of mitochondrial toxicity. NRTIs inhibit mtDNA Pol-γ leading to depletion of mtDNA and subsequent dysfunction of mitochondria (5, 6). Mitochondrial toxicity symptoms have been reported to correlate with mtDNA depletion in affected tissues (15). However, several studies have found a lack of correlation between mitochondrial toxicity and mtDNA depletion (8–11). Several studies have reported lower mtDNA to nDNA ratio in PBMCs of individuals with mitochondrial toxicity (23–25). Others studies found no difference or higher mtDNA/nDNA ratios in cases compared to controls (11, 26). These conflicting reports may be due to differences in the methods used for quantification (i.e., relative versus absolute quantification). Hammond et al. reported significant concordance between laboratories when absolute mtDNA content was measured using standards (27). We therefore quantified the absolute mtDNA content in our study. Interestingly, we found significantly higher absolute mtDNA copy number in cases using a standard curve for quantification. This is consistent with prior studies that determined absolute mtDNA copy number instead of relative mtDNA/nDNA ratio (10, 28). McComsey et al explained that the increased in mtDNA content seen in their study in NRTI-treated patients could be due to mitochondrial proliferation in order to offset the unfavorable condition in the presence of NRTI(11). Our finding of increased mRNA expression of Pol-γ in cases is consistent with this explanation. It is possible that in patients with mitochondrial toxicity - thus mitochondrial dysfunction - there is a compensatory increase in mitochondrial biogenesis which is evident in increased mtDNA content and high expression of Pol-γ. This is also consistent with observed proliferation of defective mitochondria in some inherited mitochondrial disorders(29).
To the best of our knowledge, this is the first clinical study establishing a possible association between NRTI-induced mitochondrial toxicity and perturbation in dNTP pool size. Moreover, our finding of depletion of dNTPs by NRTI treatment is consistent with the biochemistry of dNTP synthesis and several in vitro reports (18, 30). Several studies have reported similar alterations of RN and dRN pool sizes when cells were treated with nucleoside analogs (31, 32). In clinical studies, uridine supplementation was associated with improvement in lipoathrophy scores in HIV-infected patients (33, 34) and a transient improvement in limb fat in patients with lipoathrophy (35). Taken together, these earlier reports support our finding that NRTI treatment could perturb RN and dRN pools.
Patients with mitochondrial toxicity may be undergoing ‘replicative stress’ to compensate for decreased RN and dRN pools and dysfunctional mitochondria. This is supported by our findings of increased expression of nucleoside transporters, cellular kinases, and Pol-γ in cases (Figures 4 and 5). The net dNTP pool size will depend on rate of transport of nucleosides into the cell, rate and efficiency of phosphorylation of nucleoside, and rate of the efflux of nucleotides. To our surprise, cases had significantly higher mRNA expression of nucleoside transporters, cellular kinases, ABC transporters, and Pol-γ. Since NRTIs and endogenous nucleosides share the same transport and phosphorylation systems, any attempt to increase the efficiency of these systems will enhance NRTI metabolism and potentiate NRTI toxicity. Guallar et al found an association between ART-induced lipoatrophy and up-regulation of CNT2 and ENT1 mRNAs, and enhanced gene expression of CNT1, CNT3 and ENT2 (36). Moreover, recent evidence implicates OAT1 and MRP4 over-expression in tenofovir renal toxicity (37). Differential expression of TK1 and TK2 has been associated with tissue specific effects of some NRTIs (37). Is the increased expression of nucleoside transporters and cellular kinases a compensatory attempt to replenish the pool size by increasing the trafficking of nucleosides into the cell for subsequent phosphorylation? To avoid the genotoxicity of the accumulating nucleoside analog metabolites, there is increased efflux of metabolites by over-expression of ABC transporters. However, ABC transporters can also efflux dRNs leading to a net depletion of dRNs.
ART-induced mitochondrial toxicity, like most biological processes, results from the interplay of different mechanisms. Our findings and previous reports support this assertion. We posit that ART-induced mitochondrial toxicity results from both Pol-γ dependent and independent mechanisms. As illustrated in Figure 6A, under normal conditions there is a constant dialogue and inter-dependency between the nucleus and mitochondria involving ribonucleotide and deoxyribonucleotide biosynthesis, DNA synthesis, and mitochondrial function. These inter-connections are impaired during ART-induced toxicity. We propose five potential mechanisms of ART-induced mitochondrial toxicity (Figure 6B): [1] Competitive inhibition of endogenous RN and dRN biosynthesis by nucleoside analog triphosphates leading to decreased RN and dRN pools. Decreased RN and dRN pools could lead to decreased replication of both nuclear and mitochondrial DNA with concomitant decrease in the synthesis of both nuclear and mitochondrial proteins essential for the electron transport chain (ETC). [2] Inhibition of Pol-γ by nucleoside analog triphosphates leading to decreased synthesis of mtDNA and essential proteins of the ETC. Several studies support this Pol-γ hypothesis (4–7). [3] Compensatory proliferation of mtDNA: patients with mitochondrial toxicity had significantly higher expression of Pol-γ resulting in increased mtDNA content. This state of replicative stress might result in accumulation of mtDNA mutations. Mitochondrial DNA mutations have been observed in various animal and cell culture models in the absence of mtDNA depletion (38). [4] Direct effect of ART on mtDNA replication and translation. NRTIs are associated with changes in the expression of genes related to oxidative stress, apoptosis, and adipogensis in HIV treatment-experienced patients with lipodystrophy (39). Furthermore, exposure of cells to NRTIs led to alteration in mitochondrial RNA in the absence of mtDNA depletion and/or prior to changes in mtDNA(40). [5] Production of reactive oxygen species (ROS) by NRTIs; several in vitro studies have reported that short-term exposure to NRTIs increases mitochondrial ROS production (41). In a recent review by Apostolova et al, the authors concluded from emerging reports that mitochondrial dysfunction cannot not be explained solely by Pol-γ inhibition (42). Our current findings of perturbations of RN and dRN pools, increased expression of Pol-γ, high mtDNA content, and apparent replicative stress in patients with mitochondrial toxicity add to this evidence.
Figure 6.
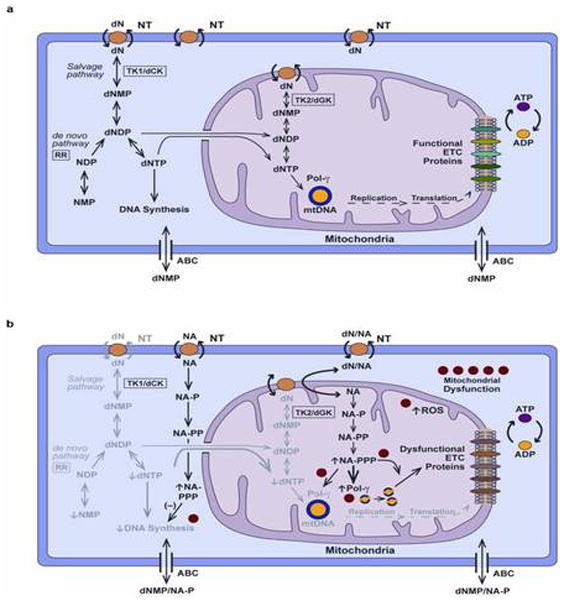
Potential mechanisms of ART-induced mitochondrial toxicity. A. Biosynthesis of endogenous nucleotides under normal conditions: Deoxyribonucleotise (dN) is transported into the cell through nucleoside transporter (NT). dN is phosphorylated to deoxyribonucleotide triphosphate (dNTP) in a step-wise fashion using deoxyribonucleoside kinases such thymidine kinase (TK1) and deoxycytidine kinase (dCK); nucleoside monophosphate kinases (NMPKs); and nucleoside diphosphate kinases (NDPKs): the salvage pathway. dNTP is also produced via the de novo pathway through the reduction of ribonucleotide diphosphate (NDP) to deoxyribonucleotide (dNDP) catalyzed by ribonucleotide reductase (RR). dNTP is used for the synthesis of both nuclear and mitochondrial DNA. Mitochondrial dNTP arises from both an import from the cytosol and synthesis in the mitochondrial through the salvage pathway. Mitochondrial DNA contains genes that encodes for essential proteins of the electronic transport chain (ETC). Monophosphates of both endogenous and nucleoside analog nucleotides can be efflux by ATP-Binding Cassette (ABC) proteins in cell membrane. B. Biosynthesis of nucleotides during ART-induced mitochondrial toxicity. Nucleoside analogs (NA) are metabolized in a step-wise fashion catalyze by the enzymes of the salvage pathway in the cytosol and mitochondria. The metabolism and usage of nucleoside analog triphosphates (NA-PPP) with time lead to competitive and feedback inhibition of the metabolism of endogenous nucleotides. Decreased synthesis of ribonucleotides (NMP, ribonucleotide monophosphate; NDP, ribonucleotide diphosphate) and dNTPs result in decreased DNA synthesis in the nucleus and mitochondrial; indicated by fading of the endogenous pathway. Analog triphosphate (NA-PPP) incorporation in DNA results inhibition of nuclear and mitochondrial DNA synthesis. Compensatory attempt at increasing DNA synthesis results in increased expression of deoxyribonucleoside kinases (TK1/2, dCK). The excess of analog metabolites could contribute to five potential mechanisms of mitochondrial toxicity numbered in the diagram: [1] Competitive inhibition of nucleotide metabolism resulting in decreased DNA synthesis; [2] Inhibition of Pol-γ by NA-PPP; [3] Compensatory proliferation of mtDNA; [4] Direct effect of ART on mitochondrial DNA replication and translation processes; [5] Production of reactive oxygen species (ROS).
Our study, like most cross-sectional studies, has several limitations. First, we cannot prove causality between pool size and mitochondrial toxicity. Second, due to limited sample size, our study is mainly exploratory and hypotheses generating. Third, the signs and symptoms of mitochondrial toxicity are non-specific; therefore, some of the cases could have been misclassified. Fourth, we lack an HIV-infected, treatment-naïve control group. Lastly, changes in tissues may not be reflected by depletion of mtDNA in PBMCs (15). However, the consistency with other clinical observations and in vitro data makes our alternate hypothesis of an indirect effect of ART on mitochondria – one independent of Pol-γ inhibition - compelling enough to warrant further research. Taken together, this first clinical study suggests that the depletion of dRNs could be in the causal pathway of NRTI-induced mitochondrial toxicity. Our findings support our alternate hypothesis that NRTIs could cause mitochondrial dysfunction independent of Pol-γ inhibition. If this is confirmed, it will have significant implications on pathogenesis of ART-induced mitochondrial toxicity and its management.
Methods
Study population and design
We conducted a case-control study of NRTI-associated toxicities in HIV-infected individuals on NRTI-based regimens. We enrolled 75 adult participants from April 2011 to March 2013. The cases comprised of 25 HIV-infected individuals on a stable NRTI-based ART regimen for at least 12 months at the time of study enrollment with one or more clinical or laboratory toxicities that have been associated with NRTI therapy (i.e., pancreatitis, peripheral neuropathy, lipodystrophy, creatinine >1.2 mg/dl, GFR <60 ml/min, hyperlipidemia – cholesterol >199 mg/dl, triglyceride > 150 mg/dl) (43, 44). After a case was identified, two controls were recruited: (1) an HIV-infected individual on stable NRTI-based ART for at least 12 months at time of study enrollment, without any of the observed clinical or laboratory toxicities (positive controls N=25) and (2) a healthy HIV-uninfected volunteer (negative controls N=25). The controls were matched to the cases by exact age, gender, and race (supplementary Table 1). Specific exclusion criteria were: (1) subjects with any acute illness within two weeks of study enrollment, (2) history or presence of an active opportunistic infection that required interruption of antiretroviral therapy, (3) history of chronic diseases such as muscular dystrophy, lupus, diabetes, renal failure and hepatic failure prior to diagnosis of HIV or initiation of NRTI-based regimen, and (4) active alcohol or substance abuse.
The HIV-infected individuals were recruited from the Adults AIDS Care Programs at Yale-New Haven Hospital and the 25 HIV-uninfected volunteers were recruited through posting of signs at Yale University. The study protocol was approved by the Institutional Review Board of the Yale School of Medicine. All participants gave their written informed consent before participation in the study.
Patient procedures
At enrollment participants answered a brief survey comprised of questions regarding past medical history and demographic characteristics. Medical records of HIV-infected participants were reviewed for date of HIV diagnosis, medication history, date of diagnosis of toxicity, complete blood count, serum chemistries, liver function test, lipid profile, urinalysis, HIV RNA copy number, and CD4+ T-cell count at study entry. About 20 ml of venous blood was collected from all study participants at the time of enrollment. Peripheral blood mononuclear cells (PBMCs) were isolated from whole blood within 2 hours of collection using Ficoll gradient (Ficoll-Hypaque; ICN) as previously described (45). Aliquots of PBMCs were either used immediately for extraction of nucleotides or stored at −80°C prior to extraction of RNA and DNA for the experiments.
Extraction and quantification of nucleotides from PBMCs
The nucleotide was extracted using acid extraction method previously published (22). In brief, a cell pellet of 1 × 10⁷ PBMCs was treated with 150 μL of 15% trichloroacetic acid (TCA) containing 3 μL of 19.8 uM 13C-ATP as internal standard and placed on ice for 30 minutes. After centrifugation at 13,500 rpm for 10 min in the cold room, the acidic supernatant was separated and neutralized twice with an 80 μL mixture of trioctylamine and 1, 1, 2-trichlorotrifluoroethane (a volume ratio of 45 to 55).
The instrumentation and protocol for simultaneous determination of RNs and dRNs using LC/MS/MS was developed by Cohen et al (46) and we have previously published a slight modification of this method (22). In brief, 20 μl of extract was injected into the chromatographic system comprising of an Agilent 1200SL high pressure liquid chromatography (HPLC) System (Agilent Technologies). After chromatographic separation, the mobile phase was directly introduced into an Applied Biosystems Sciex 4000 Q-trap® mass spectrometer (Applied Biosystems Sciex; Foster, CA) via the electrospray source (ESI) operating in either the negative or positive mode for detection. Data acquisition was carried out using Analyst 1.4.2® software (Applied Biosystems) and the concentration was determined using calibration standards for the metabolite of interest. A calibration curve for each RN and dRN was obtained by quadratic regression analysis with 1/X2 weighting based on the peak area ratio of the analyte to the internal standard. Calibration curves with a correlation coefficient (r) higher than 0.98 were acceptable. The lower limit of quantification (LLOQ) was defined as the lowest concentration on the calibration curve.
Mitochondrial DNA quantification
To evaluate mtDNA depletion, genomic DNA was extracted from PBMCs using using TRIzol® Reagent (Invitrogen, Carlsbad, CA) according to manufacturer’s instructions. A fragment of mitochondrial D-Loop was amplified in duplicate in two independent experiments using quantitative RT-PCR as previously described (47). The standard deviation of the mtDNA assay in duplicate repeats of different samples was within 5%. The primers used to amplify D-loop are shown in supplementary Table 2. Absolute mtDNA copy numbers was calculated using serial dilutions of plasmid with known copy numbers of mtDNA (D-loop).
Quantitative RT-PCR for expression of cellular kinases, nucleoside transporters, ABC transporters, and polymerase gamma
RNA was extracted from 400 μl of PBMCs using TRIzol® Reagent (Invitrogen, Carlsbad, CA) according to manufacturer’s instructions and used in quantitative real-time PCR was performed as previously described (48). Melting curve analysis was performed after the completion of PCR reaction to assess the possibility of false-positive results. All of the samples were run in duplicate in two independent experiments. The primers for thymidine kinase-1 (TK1), thymidine kinase-2 (TK2), deoxycytidine kinase (dCK), ribonucleotide reductase subunit (p53RR), organic anion transporter (OAT1 and OAT2), organic cation transporter (OCT1 and OCT2), concentrative nucleoside transporter (CNT1 and CNT2), equilibrative nucleoside transporter (ENT1 and ENT2), and Pol-γ are shown in Supplementary Table 1. The primers for the ABC-transporter genes (MDR1, MRP1, MRP2, and MRP4) have been previously described (49). The GAPDH gene was used as an internal control for all reactions. The threshold cycle (Ct) values of the genes for each participant were determined. The mRNA expression of gene of interest (x) was calculated as an expression index (EI), derived from a formula previously described (50). The expression index (EI) = 1000 × 2−ΔCt, where ΔCt = Ctx − CtGAPDH.
Data analysis and statistics
The data are presented as medians with interquartile ranges (IQRs) and as frequencies with percentages for continuous and categorical variables, respectively. Wilcoxon rank sum and Fisher’s exact tests were used to compare continuous and categorical variables among the study groups, respectively. Spearman’s rank correlations were used to examine bivariate associations between study outcomes. Multivariate analyses of variance (MANOVA) based on Pillais trace test was used to simultaneously compare the study outcomes among the three groups. Significant differences were examined further using Kruskal-Wallis and Wilcoxon rank sum tests. P-values are two sided and considered significant if <0.05.
Supplementary Material
Study Highlights.
What is the current knowledge on the topic?
Nucleoside analog reverse transcriptase inhibitors (NRTIs) inhibit mtDNA polymerase γ leading to depletion of mtDNA. This is the proposed mechanism of NRTI-induced and mitochondrial dysfunction.
What question this study addressed?
The newer generation nucleosides/nucleotides analogs have less inhibitory effect on Pol-γ; however, they are still associated with significant mitochondrial toxicity. Is there an alternate hypothesis, independent of Pol-γ, to explain NRTI-associated mitochondrial toxicity?
What this study adds to our knowledge?
Antiretroviral therapy (ART) may be associated with perturbation of ribonucleotide and deoxyribonucleotide pools. Depletion of RN and dRN pools may be associated with ART-induced mitochondrial toxicity independent of Pol-γ inhibition. Patients with mitochondrial toxicity are undergoing ‘replicative stress’ to compensate for the decreasing dNTP pool size and mitochondrial dysfunction..
How this might change clinical pharmacology and therapeutics?
These findings have significant implications on pathogenesis and management of HIV treatment-associated mitochondrial toxicity. Replenishing of dNTP pools may reverse ART-associated mitochondrial toxicity.
Acknowledgments
We are grateful to the patients at Nathan Smith Clinic, Yale-New Haven Hospital for their cooperation. We thank all the providers and nursing staff at Nathan Smith Clinic for making the study possible. This study was supported by a grant from the National Institutes of Health (KO8AI074404 to EP). Y.-C.C (supported by grant AI-38204) is a fellow of the National Foundation for Cancer Research.
Footnotes
Conflict of Interest
All authors declared no conflict of interest.
Author Contributions
S.S., M.G., and E.P. wrote the manuscript; S.S., M.L., A.L.B., E.T., R.E., W.L., Y.C.C., and E.P. designed the research; S.S., M.L., Y.F., A.O., L.B., A.L.B., E.T., R.E., W.L., and E.P. performed the research; S.S., M.G., M.L., Y.F., A.O., L.B., Y.C.C., and E.P. analyzed the data.
References
- 1.Yeni PG, et al. Treatment for adult HIV infection: 2004 recommendations of the International AIDS Society-USA Panel. Jama. 2004;292:251–65. doi: 10.1001/jama.292.2.251. [DOI] [PubMed] [Google Scholar]
- 2.Lenert LA, Feddersen M, Sturley A, Lee D. Adverse effects of medications and trade-offs between length of life and quality of life in human immunodeficiency virus infection. Am J Med. 2002;113:229–32. doi: 10.1016/s0002-9343(02)01156-7. [DOI] [PubMed] [Google Scholar]
- 3.Powderly WG. Long-term exposure to lifelong therapies. J Acquir Immune Defic Syndr. 2002;29 (Suppl 1):S28–40. doi: 10.1097/00126334-200202011-00005. [DOI] [PubMed] [Google Scholar]
- 4.Lewis W, Dalakas MC. Mitochondrial toxicity of antiviral drugs. Nat Med. 1995;1:417–22. doi: 10.1038/nm0595-417. [DOI] [PubMed] [Google Scholar]
- 5.Chen CH, Cheng YC. Delayed cytotoxicity and selective loss of mitochondrial DNA in cells treated with the anti-human immunodeficiency virus compound 2′,3′-dideoxycytidine. J Biol Chem. 1989;264:11934–7. [PubMed] [Google Scholar]
- 6.Chen CH, Vazquez-Padua M, Cheng YC. Effect of anti-human immunodeficiency virus nucleoside analogs on mitochondrial DNA and its implication for delayed toxicity. Mol Pharmacol. 1991;39:625–8. [PubMed] [Google Scholar]
- 7.Brinkman K, Smeitink JA, Romijn JA, Reiss P. Mitochondrial toxicity induced by nucleoside-analogue reverse-transcriptase inhibitors is a key factor in the pathogenesis of antiretroviral-therapy-related lipodystrophy. Lancet. 1999;354:1112–5. doi: 10.1016/S0140-6736(99)06102-4. [DOI] [PubMed] [Google Scholar]
- 8.Maagaard A, Kvale D. Long term adverse effects related to nucleoside reverse transcriptase inhibitors: clinical impact of mitochondrial toxicity. Scand J Infect Dis. 2009;41:808–17. doi: 10.3109/00365540903186181. [DOI] [PubMed] [Google Scholar]
- 9.Cote HC. Possible ways nucleoside analogues can affect mitochondrial DNA content and gene expression during HIV therapy. Antivir Ther. 2005;10 (Suppl 2):M3–11. [PubMed] [Google Scholar]
- 10.Mallon PW, et al. In vivo, nucleoside reverse-transcriptase inhibitors alter expression of both mitochondrial and lipid metabolism genes in the absence of depletion of mitochondrial DNA. J Infect Dis. 2005;191:1686–96. doi: 10.1086/429697. [DOI] [PubMed] [Google Scholar]
- 11.McComsey G, Tan DJ, Lederman M, Wilson E, Wong LJ. Analysis of the mitochondrial DNA genome in the peripheral blood leukocytes of HIV-infected patients with or without lipoatrophy. Aids. 2002;16:513–8. doi: 10.1097/00002030-200203080-00001. [DOI] [PubMed] [Google Scholar]
- 12.Deng W, Baki L, Yin J, Zhou H, Baumgarten CM. HIV protease inhibitors elicit volume-sensitive Cl- current in cardiac myocytes via mitochondrial ROS. Journal of molecular and cellular cardiology. 2010;49:746–52. doi: 10.1016/j.yjmcc.2010.08.013. [DOI] [PMC free article] [PubMed] [Google Scholar]
- 13.Blas-Garcia A, et al. Inhibition of mitochondrial function by efavirenz increases lipid content in hepatic cells. Hepatology. 2010;52:115–25. doi: 10.1002/hep.23647. [DOI] [PubMed] [Google Scholar]
- 14.Apostolova N, Gomez-Sucerquia LJ, Moran A, Alvarez A, Blas-Garcia A, Esplugues JV. Enhanced oxidative stress and increased mitochondrial mass during efavirenz-induced apoptosis in human hepatic cells. British journal of pharmacology. 2010;160:2069–84. doi: 10.1111/j.1476-5381.2010.00866.x. [DOI] [PMC free article] [PubMed] [Google Scholar]
- 15.Maagaard A, Holberg-Petersen M, Kollberg G, Oldfors A, Sandvik L, Bruun JN. Mitochondrial (mt)DNA changes in tissue may not be reflected by depletion of mtDNA in peripheral blood mononuclear cells in HIV-infected patients. Antivir Ther. 2006;11:601–8. [PubMed] [Google Scholar]
- 16.Maagaard A, Holberg-Petersen M, Lovgarden G, Holm M, Pettersen FO, Kvale D. Distinct mechanisms for mitochondrial DNA loss in T and B lymphocytes from HIV-infected patients exposed to nucleoside reverse-transcriptase inhibitors and those naive to antiretroviral treatment. J Infect Dis. 2008;198:1474–81. doi: 10.1086/592713. [DOI] [PubMed] [Google Scholar]
- 17.McComsey GA, et al. Mitochondrial RNA and DNA alterations in HIV lipoatrophy are linked to antiretroviral therapy and not to HIV infection. Antivir Ther. 2008;13:715–22. [PMC free article] [PubMed] [Google Scholar]
- 18.Van Rompay AR, Johansson M, Karlsson A. Phosphorylation of nucleosides and nucleoside analogs by mammalian nucleoside monophosphate kinases. Pharmacol Ther. 2000;87:189–98. doi: 10.1016/s0163-7258(00)00048-6. [DOI] [PubMed] [Google Scholar]
- 19.Jordheim LP, Dumontet C. Review of recent studies on resistance to cytotoxic deoxynucleoside analogues. Biochim Biophys Acta. 2007;1776:138–59. doi: 10.1016/j.bbcan.2007.07.004. [DOI] [PubMed] [Google Scholar]
- 20.Huber-Ruano I, Pastor-Anglada M. Transport of nucleoside analogs across the plasma membrane: a clue to understanding drug-induced cytotoxicity. Curr Drug Metab. 2009;10:347–58. doi: 10.2174/138920009788499030. [DOI] [PubMed] [Google Scholar]
- 21.Kock K, et al. Expression of adenosine triphosphate-binding cassette (ABC) drug transporters in peripheral blood cells: relevance for physiology and pharmacotherapy. Clin Pharmacokinet. 2007;46:449–70. doi: 10.2165/00003088-200746060-00001. [DOI] [PubMed] [Google Scholar]
- 22.Zhang W, et al. Analysis of deoxyribonucleotide pools in human cancer cell lines using a liquid chromatography coupled with tandem mass spectrometry technique. Biochem Pharmacol. 2011;82:411–7. doi: 10.1016/j.bcp.2011.05.009. [DOI] [PMC free article] [PubMed] [Google Scholar]
- 23.McComsey GA, et al. Improvements in lipoatrophy, mitochondrial DNA levels and fat apoptosis after replacing stavudine with abacavir or zidovudine. Aids. 2005;19:15–23. doi: 10.1097/00002030-200501030-00002. [DOI] [PubMed] [Google Scholar]
- 24.Sharma TS, et al. Short communication: The relationship between mitochondrial dysfunction and insulin resistance in HIV-infected children receiving antiretroviral therapy. AIDS Res Hum Retroviruses. 2013;29:1211–7. doi: 10.1089/aid.2012.0354. [DOI] [PMC free article] [PubMed] [Google Scholar]
- 25.Cherry CL, et al. Tissue-specific associations between mitochondrial DNA levels and current treatment status in HIV-infected individuals. J Acquir Immune Defic Syndr. 2006;42:435–40. doi: 10.1097/01.qai.0000224974.67962.ce. [DOI] [PubMed] [Google Scholar]
- 26.Blanche S, et al. Persistent mitochondrial dysfunction and perinatal exposure to antiretroviral nucleoside analogues. Lancet. 1999;354:1084–9. doi: 10.1016/S0140-6736(99)07219-0. [DOI] [PubMed] [Google Scholar]
- 27.Hammond EL, et al. Assessment of precision and concordance of quantitative mitochondrial DNA assays: a collaborative international quality assurance study. J Clin Virol. 2003;27:97–110. doi: 10.1016/s1386-6532(02)00134-8. [DOI] [PubMed] [Google Scholar]
- 28.Gerschenson M, Shiramizu B, LiButti DE, Shikuma CM. Mitochondrial DNA levels of peripheral blood mononuclear cells and subcutaneous adipose tissue from thigh, fat and abdomen of HIV-1 seropositive and negative individuals. Antivir Ther. 2005;10 (Suppl 2):M83–9. [PubMed] [Google Scholar]
- 29.Oldfors A, Holme E, Tulinius M, Larsson NG. Tissue distribution and disease manifestations of the tRNA(Lys) A-->G(8344) mitochondrial DNA mutation in a case of myoclonus epilepsy and ragged red fibres. Acta neuropathologica. 1995;90:328–33. doi: 10.1007/BF00296519. [DOI] [PubMed] [Google Scholar]
- 30.Kohler JJ, Lewis W. A brief overview of mechanisms of mitochondrial toxicity from NRTIs. Environmental and molecular mutagenesis. 2007;48:166–72. doi: 10.1002/em.20223. [DOI] [PubMed] [Google Scholar]
- 31.Ferraro P, Bianchi V, Biasin MR, Celotti L. Deoxynucleotide pools and DNA synthesis in resting and PHA-stimulated human lymphocytes treated with mutagens. Exp Cell Res. 1992;199:349–54. doi: 10.1016/0014-4827(92)90444-d. [DOI] [PubMed] [Google Scholar]
- 32.Iwasaki H, Huang P, Keating MJ, Plunkett W. Differential incorporation of ara-C, gemcitabine, and fludarabine into replicating and repairing DNA in proliferating human leukemia cells. Blood. 1997;90:270–8. [PubMed] [Google Scholar]
- 33.Sutinen J, et al. Uridine supplementation for the treatment of antiretroviral therapy-associated lipoatrophy: a randomized, double-blind, placebo-controlled trial. Antivir Ther. 2007;2:97–105. [PubMed] [Google Scholar]
- 34.McComsey GA, O’Riordan M, Setzer B, Lebrecht D, Baron E, Walker UA. Uridine supplementation in HIV lipoatrophy: pilot trial on safety and effect on mitochondrial indices. European journal of clinical nutrition. 2008;62:1031–7. doi: 10.1038/sj.ejcn.1602793. [DOI] [PMC free article] [PubMed] [Google Scholar]
- 35.McComsey GA, et al. Uridine supplementation in the treatment of HIV lipoatrophy: results of ACTG 5229. Aids. 2010;24:2507–15. doi: 10.1097/QAD.0b013e32833ea9bc. [DOI] [PMC free article] [PubMed] [Google Scholar]
- 36.Guallar JP, et al. Altered expression of nucleoside transporter genes (SLC28 and SLC29) in adipose tissue from HIV-1-infected patients. Antivir Ther. 2007;12:853–63. [PubMed] [Google Scholar]
- 37.Kohler JJ, et al. Tenofovir renal proximal tubular toxicity is regulated by OAT1 and MRP4 transporters. Laboratory investigation; a journal of technical methods and pathology. 2011;91:852–8. doi: 10.1038/labinvest.2011.48. [DOI] [PMC free article] [PubMed] [Google Scholar]
- 38.Hoschele D. Cell culture models for the investigation of NRTI-induced mitochondrial toxicity. Relevance for the prediction of clinical toxicity. Toxicology in vitro: an international journal published in association with BIBRA. 2006;20:535–46. doi: 10.1016/j.tiv.2005.11.007. [DOI] [PubMed] [Google Scholar]
- 39.Sievers M, et al. Gene expression and immunohistochemistry in adipose tissue of HIV type 1-infected patients with nucleoside analogue reverse-transcriptase inhibitor-associated lipoatrophy. J Infect Dis. 2009;200:252–62. doi: 10.1086/599986. [DOI] [PubMed] [Google Scholar]
- 40.Galluzzi L, et al. Changes in mitochondrial RNA production in cells treated with nucleoside analogues. Antivir Ther. 2005;10:191–5. [PubMed] [Google Scholar]
- 41.Lagathu C, et al. Some HIV antiretrovirals increase oxidative stress and alter chemokine, cytokine or adiponectin production in human adipocytes and macrophages. Antivir Ther. 2007;12:489–500. [PubMed] [Google Scholar]
- 42.Apostolova N, Blas-Garcia A, Esplugues JV. Mitochondrial interference by anti-HIV drugs: mechanisms beyond Pol-gamma inhibition. Trends Pharmacol Sci. 2011;32:715–25. doi: 10.1016/j.tips.2011.07.007. [DOI] [PubMed] [Google Scholar]
- 43.Brinkman K, ter Hofstede HJ, Burger DM, Smeitink JA, Koopmans PP. Adverse effects of reverse transcriptase inhibitors: mitochondrial toxicity as common pathway. Aids. 1998;12:1735–44. doi: 10.1097/00002030-199814000-00004. [DOI] [PubMed] [Google Scholar]
- 44.Kakuda TN. Pharmacology of nucleoside and nucleotide reverse transcriptase inhibitor-induced mitochondrial toxicity. Clin Ther. 2000;22:685–708. doi: 10.1016/S0149-2918(00)90004-3. [DOI] [PubMed] [Google Scholar]
- 45.Tuttle DL, et al. Increased replication of non-syncytium-inducing HIV type 1 isolates in monocyte-derived macrophages is linked to advanced disease in infected children. AIDS Res Hum Retroviruses. 2002;18:353–62. doi: 10.1089/088922202753519133. [DOI] [PubMed] [Google Scholar]
- 46.Cohen S, et al. Simultaneous analysis of eight nucleoside triphosphates in cell lines by liquid chromatography coupled with tandem mass spectrometry. J Chromatogr B Analyt Technol Biomed Life Sci. 2009;877:3831–40. doi: 10.1016/j.jchromb.2009.09.030. [DOI] [PubMed] [Google Scholar]
- 47.McComsey GA, et al. Increased mtDNA levels without change in mitochondrial enzymes in peripheral blood mononuclear cells of infants born to HIV-infected mothers on antiretroviral therapy. HIV Clin Trials. 2008;9:126–36. doi: 10.1310/hct0902-126. [DOI] [PMC free article] [PubMed] [Google Scholar]
- 48.Lu L, Katsaros D, Wiley A, Rigault de la Longrais IA, Puopolo M, Yu H. Expression of MDR1 in epithelial ovarian cancer and its association with disease progression. Oncol Res. 2007;16:395–403. doi: 10.3727/000000006783980892. [DOI] [PubMed] [Google Scholar]
- 49.Colombo S, et al. Influence of ABCB1, ABCC1, ABCC2, and ABCG2 haplotypes on the cellular exposure of nelfinavir in vivo. Pharmacogenet Genomics. 2005;15:599–608. doi: 10.1097/01.fpc.0000172241.42546.d3. [DOI] [PubMed] [Google Scholar]
- 50.Ohishi Y, et al. ATP-binding cassette superfamily transporter gene expression in human primary ovarian carcinoma. Clin Cancer Res. 2002;8:3767–75. [PubMed] [Google Scholar]
Associated Data
This section collects any data citations, data availability statements, or supplementary materials included in this article.